SlideShare a Scribd company logo
1 of 8
Download to read offline
Assessing the costs of Public Higher Education in the
Commonwealth of Virginia Part 3
Robert M. Davis MPA
The Guy in Glasses
5/30/2014
The cost shift in Virginia’s public higher education
0
10
20
30
40
50
60
70
80
2000 2001 2002 2003 2004 2005 2006 2007 2008 2009 2010 2011
%Share
Revenues and Support: Family Vs. State
Share of Public Higher Education
Family Share
of Public
Higher
Education
Operating
Revenues (%)
State Share of
Public Higher
Education
Operating
Revenues (%)
Assessing the costs of Public Higher Education in the Commonwealth of Virginia: Are costs going up?
How much? And have incomes been able to meet those costs?
To illustrate this cost shift, it is beneficial to examine what is called the state share and
family share of public higher education. The state share consists of state tax appropriations that
support or benefit higher education; Family Share is the gross amount of tuition and fees, less
state and institutional financial aid, tuition waivers or discounts. This is a measure of the
resources available through tuition and fees to support instruction and related operations at
public higher education institutions (IPEDS, 2012).
Figure 1: Family share vs. state share of public higher education. This figure illustrates the percentage share in which a
student pays, and what the state pays. The state share is the proportion of cost which is subsidized through appropriations,
whereas the student share (family share) is the proportion of cost paid through tuition and fees (IPEDS, 2012).
The concerns of the public seem to mirror those concerns represented by politicians in
regard to the rising costs of public higher education. The public perspective, according to the
respondent result of the Pew research (2011) survey strengthens the identification of the cost
shifting behaviors taking place in public higher education; cost shifting occurs when the cost
burden (who pays) is shifted (parents and students are paying more to attend public higher
education) as a result of the funding nature in the public higher education market.
0
10
20
30
40
50
60
70
80
200020012002200320042005200620072008200920102011
%Share
Revenues and Support: Family Vs. State
Share of Public Higher Education
Family Share of
Public Higher
Education
Operating
Revenues (%)
State Share of
Public Higher
Education
Operating
Revenues (%)
The 2000-2011 year period data shows that a shift has occurred in the financing share of the
operational cost of higher education, one in which families and students will have to foot a
greater portion of the bill. This has become the new normal according to associated data
collection compiled throughout the context of this research.
How are parents and students managing cost increases?
As cost have risen each year in tandem, so has the number of Virginia residents that are
classified as “with need” for financial assistance to attend one of Virginia’s public four year
institutions. The State Council of Higher Education for Virginia provides a look into the
evolving trends in higher education at the Virginia level. There have been significant increases in
the trend relating to the number of students classified as being “with need” (SCHEV, 2013c).
With need classification entails that a student, based upon their reported income will
need some form of financial support in order to afford the costs of attendance. The number of
Virginia resident students classified as “with need” has grown by 253% or 76,535 from year
1992 to 2012. More Virginia residents are going to college, especially those students from lower
income representative groups (SCHEV, 2013c).
Low income classifications of individuals have increased in terms of enrollment and this
data correlates with the presented data represented by figure 2 illustrates that the number of
students classified as “with need” have increased as well. The majority of increases have
occurred among those income classifications designated as falling below the reported median
household income (SCHEV, 2013c).
Figure 2: Illustrates the number of students designated as “with need” in meeting financial costs of attendance among
Virginia’s colleges and universities (SCHEV, 2013c). Calculations performed by the author.
The findings illustrate how the costs burden has shifted from the state (majority share of
financing) to the individual and as a result individuals must pay more to attend public higher
education in Virginia. Despite this cost shift, individuals from lower income classifications have
increased in enrollment, during a period by which lower income classifications have seen their
reported income earnings stagnate or decline1
. How are these individuals paying for attendance
at public higher education institutions as costs to attend them are increasing? The solution
appears to be loans.
Borrowing to pay for college
The type of financial aid that is available to students comes in the form of three main
classifications: Loans (private and federal), scholarships (money provided by the institution
directly to the student or some other organization) and other aid (grants, work study, and other
1
See Assessing the costs of Public Higher Education in the Commonwealth of Virginia Part 2
30,215
4,892 137
106,750
33,807
10,031
0
20,000
40,000
60,000
80,000
100,000
120,000
$0 to $50,000 $50,000 to $100,000 Greater than $100,000
Number of In-State students classified as "with need"
Years 1992 to 2011
1992-1993 2011-2012
forms of aid). However, loans make up the majority proportional share in meeting the costs of
public higher education (SCHEV, 2013; SCHEV, 2013a).
Figure 2: Illustrates the % share of financial aid in meeting financial costs of attendance among Virginia’s colleges and
universities.
Among public state supported four year institutions, Virginia graduates from the class of
2011 carried $22,655 in student loan debt (average) and from fiscal year 2006 (pre-recession) to
fiscal year 2011, the average amount of debt held by graduates in Virginia increased by 30.5%.
Debt held by students from Virginia public state supported four year institutions saw the amount
of debt burden increase. Virginia’s percentage of graduates finishing with some form of debt
obligation was 56% of total graduates from the class of 2011 among all public colleges and
universities in Virginia; this includes both federal and private loan obligations (College Insight,
2013). The amount of loan borrowers has increased by 27.2% over the same six year period
(SCHEV, 2013a). What this shows is more students attending public higher education
institutions are borrowing loans each year to afford access to public higher education.
The average amount of debt per student among Virginia’s institutions has increased 35%
from year 2006 to2011. Not only has the number of in-state students whom rely on borrowing as
55% 55% 55% 54% 54% 55%
36% 35% 37% 39% 40% 38%
9% 10% 8% 7% 6% 7%
0%
20%
40%
60%
80%
100%
2006 2007 2008 2009 2010 2011
%ShareoftotalFin.Aid.
% share of total Financial aid per source
% Share that Loans make up as total of Fin. Aid (Average) % Share that Other Aid makes up as a total of Fin. Aid (Average)
% Share that Scholarships make up as a total of Fin. Aid (Average)
a need to cover the costs of attendance, but as well so has the amount borrowed per student
increased (SCHEV, 2013a). A regression analysis of the data presented in this research shows
that a strong positive linear relationship correlates between the two variables examined: the
average amount of total costs to attend one of Virginia’s public higher education institutions and
the amount of loans (on average) being borrowed per attending in-state student.
Figure 3: Regression analysis between variables average costs of attendance and average loan amount borrowed.
Figure 4: Regression statistics between variables average costs of attendance and average loan amount borrowed.
The regression analysis and the accompanying statistics from the calculation illustrate
that as the costs of attendance to attend Virginia’s public higher education institutions increases;
there is a related change in the amount of loans being borrowed per enrolled in-state student.
$-
$5,000
$10,000
$15,000
$20,000
$- $2,000 $4,000 $6,000 $8,000 $10,000
AverageTotalCostsofAttendance
Average Loan Amount Borrowed
Cost of Attendance & Amount Borrowed
Regression Analysis
Regression Statistics
Multiple R 0.984878697
R Square 0.969986048
Adjusted R Square 0.96248256
Standard Error 301.1559061
Observations 6
This observational change between the variables (cost of attendance and loan amount borrowed)
signifies the identification of correlation2
.
The average loan amount borrowed accounted for 49% of the lowest quintile income in
year 2006 and 65% in year 2011; for the second quintile group loan amounts accounted for 19%
of household income in year 2006 and 24% in year 2011. Each quintile group experienced a
larger share of their income being accounted for, but lower income quintile groups had a more
significant impact (U.S. Census Bureau, 2013b; SCHEV, 2006-2012).
In summary; the data represents that as loans comprise the majority share of total
financial aid used by students to cover cost, increasing costs has pushed the borrowed loan
amount per borrower higher. Enrollments of individuals from lower income quintile
classification groups during a period of cost shifting is taking place as costs have gone up,
income for lower income groups has remained stagnant or decreased, and individuals have
turned to loans to finance the majority share of Virginia’s public higher education cost.
*Continued in the next segment released3
2
Correlation does not imply causation. This merely identifies that a relationship may be culled from the changes
between the two variables observed.
3
Full body of research can be read, reviewed and accessed here:
http://vtechworks.lib.vt.edu/handle/10919/23281
References
Joint Legislative Audit And Review Commission (JLARC), (2012).Virginia compared to other
states: National rankings on states, budgetary components, and other indicators (419). Retrieved
from Commonwealth of Virginia website: http://jlarc.state.va.us/reports/Rpt419.pdf
United States Census Bureau. (2013a). American community survey: Median income in the past
12 months virginia; years 2006-2011 [Data File]. Retrieved from http://factfinder2.census.gov
United States Census Bureau. (2013b). American community survey: Mean household income of
quintiles Virginia; years 2006-2011 [Data File]. Retrieved from http://factfinder2.census.gov
State Council of Higher Education for Virginia (SCHEV), (1990-2012).Tuition and fees at
virginia's state-supported colleges and universitiys. Richmond,VA: The Commonwealth of
Virginia. http://www.schev.edu/reports/reportsindex.asp
College Board Advocacy & Policy Center. (2012). Trends in College Pricing 2012. Retrieved
2012, from Collegeboard.org: https://trends.collegeboard.org/sites/default/files/college-pricing-
2012-full-report_0.pdf
Integrated Postsecondary Education Data System (IPEDS). (2012). Compare individual
institutions: Virginia public 4 year institutions; finance, tuition revenues, state appropriations
[Data File]. Retrieved from http://nces.ed.gov/ipeds/datacenter/InstitutionList.aspx
Pew Research Center. (2011, May 15). Is college worth it?:college presidents, public assess,
value, quality and mission of higher education. Retrieved from
http://www.pewsocialtrends.org/2011/05/15/is-college-worth-it/

More Related Content

Viewers also liked

Promozione agricoltura
Promozione agricolturaPromozione agricoltura
Promozione agricoltura
RegioneLazio
 
Portfólio Us Eventos
Portfólio Us EventosPortfólio Us Eventos
Portfólio Us Eventos
Raquel Ribas
 
2014 summer B 805
2014 summer B 805 2014 summer B 805
2014 summer B 805
bagrutonline
 
Os custos tributários impactam o crescimento econômico?
Os custos tributários impactam o crescimento econômico?Os custos tributários impactam o crescimento econômico?
Os custos tributários impactam o crescimento econômico?
berbone
 
Bluelife Battery Regeneration Info
Bluelife Battery Regeneration InfoBluelife Battery Regeneration Info
Bluelife Battery Regeneration Info
alfredobluelife
 
Impacto do imposto sobre produtos industrializados nos custos da produção de ...
Impacto do imposto sobre produtos industrializados nos custos da produção de ...Impacto do imposto sobre produtos industrializados nos custos da produção de ...
Impacto do imposto sobre produtos industrializados nos custos da produção de ...
berbone
 

Viewers also liked (17)

Promozione agricoltura
Promozione agricolturaPromozione agricoltura
Promozione agricoltura
 
Join&play new 9 junho_beta
Join&play new 9 junho_betaJoin&play new 9 junho_beta
Join&play new 9 junho_beta
 
MM Strategy Samples
MM Strategy SamplesMM Strategy Samples
MM Strategy Samples
 
Conferenza di medicina quantistica, Luigina Bernardi Progetto Benessere Completo
Conferenza di medicina quantistica, Luigina Bernardi Progetto Benessere CompletoConferenza di medicina quantistica, Luigina Bernardi Progetto Benessere Completo
Conferenza di medicina quantistica, Luigina Bernardi Progetto Benessere Completo
 
『ブラックバイトへの対処法』
『ブラックバイトへの対処法』『ブラックバイトへの対処法』
『ブラックバイトへの対処法』
 
Guion del video "¿como pedir la calle que quieres?"
Guion del video "¿como pedir la calle que quieres?"Guion del video "¿como pedir la calle que quieres?"
Guion del video "¿como pedir la calle que quieres?"
 
Portfólio Us Eventos
Portfólio Us EventosPortfólio Us Eventos
Portfólio Us Eventos
 
2014 summer B 805
2014 summer B 805 2014 summer B 805
2014 summer B 805
 
Os custos tributários impactam o crescimento econômico?
Os custos tributários impactam o crescimento econômico?Os custos tributários impactam o crescimento econômico?
Os custos tributários impactam o crescimento econômico?
 
facebook
facebookfacebook
facebook
 
Bluelife Battery Regeneration Info
Bluelife Battery Regeneration InfoBluelife Battery Regeneration Info
Bluelife Battery Regeneration Info
 
MM UX Samples
MM UX SamplesMM UX Samples
MM UX Samples
 
Impacto do imposto sobre produtos industrializados nos custos da produção de ...
Impacto do imposto sobre produtos industrializados nos custos da produção de ...Impacto do imposto sobre produtos industrializados nos custos da produção de ...
Impacto do imposto sobre produtos industrializados nos custos da produção de ...
 
Wiki
WikiWiki
Wiki
 
credit suisse Financial Report 2Q08
credit suisse Financial Report 2Q08credit suisse Financial Report 2Q08
credit suisse Financial Report 2Q08
 
Proyecto
ProyectoProyecto
Proyecto
 
Surrealismo
SurrealismoSurrealismo
Surrealismo
 

More from Robert M. Davis, MPA

Is The Rent Too High?: Rent and Income in Virginia since 2007
Is The Rent Too High?: Rent and Income in Virginia since 2007Is The Rent Too High?: Rent and Income in Virginia since 2007
Is The Rent Too High?: Rent and Income in Virginia since 2007
Robert M. Davis, MPA
 
Coherent ramblings for coherent minds video session 2 uva wise increasing cost
Coherent ramblings for coherent minds video session 2 uva wise increasing costCoherent ramblings for coherent minds video session 2 uva wise increasing cost
Coherent ramblings for coherent minds video session 2 uva wise increasing cost
Robert M. Davis, MPA
 

More from Robert M. Davis, MPA (20)

Measuring and Improving EMS System Performance: 2015
Measuring and Improving EMS System Performance: 2015Measuring and Improving EMS System Performance: 2015
Measuring and Improving EMS System Performance: 2015
 
Virginia Beach Department of EMS: Annual Report 2014
Virginia Beach Department of EMS: Annual Report 2014Virginia Beach Department of EMS: Annual Report 2014
Virginia Beach Department of EMS: Annual Report 2014
 
Virginia Continues Historic Increases in Public College Costs
Virginia Continues Historic Increases in Public College CostsVirginia Continues Historic Increases in Public College Costs
Virginia Continues Historic Increases in Public College Costs
 
Measuring and Improving EMS System Performance
Measuring and Improving EMS System PerformanceMeasuring and Improving EMS System Performance
Measuring and Improving EMS System Performance
 
Examining Repeat EMS Incidents and Community Paramedicine Programs
Examining Repeat EMS Incidents and Community Paramedicine ProgramsExamining Repeat EMS Incidents and Community Paramedicine Programs
Examining Repeat EMS Incidents and Community Paramedicine Programs
 
Assessing the costs of public higher education in the commonwealth of virgini...
Assessing the costs of public higher education in the commonwealth of virgini...Assessing the costs of public higher education in the commonwealth of virgini...
Assessing the costs of public higher education in the commonwealth of virgini...
 
Assessing the costs of public higher education in the commonwealth of virgini...
Assessing the costs of public higher education in the commonwealth of virgini...Assessing the costs of public higher education in the commonwealth of virgini...
Assessing the costs of public higher education in the commonwealth of virgini...
 
Student Debt: A Drag on U.S. Housing and the Economy
Student Debt: A Drag on U.S. Housing and the EconomyStudent Debt: A Drag on U.S. Housing and the Economy
Student Debt: A Drag on U.S. Housing and the Economy
 
Is The Rent Too High?: Rent and Income in Virginia since 2007
Is The Rent Too High?: Rent and Income in Virginia since 2007Is The Rent Too High?: Rent and Income in Virginia since 2007
Is The Rent Too High?: Rent and Income in Virginia since 2007
 
Student Loans: A Drag on the U.S. Housing Market
Student Loans: A Drag on the U.S. Housing MarketStudent Loans: A Drag on the U.S. Housing Market
Student Loans: A Drag on the U.S. Housing Market
 
Unemployment in swing states
Unemployment in swing statesUnemployment in swing states
Unemployment in swing states
 
Unemployment rate september
Unemployment rate septemberUnemployment rate september
Unemployment rate september
 
Coherent ramblings for coherent minds video session 2 uva wise increasing cost
Coherent ramblings for coherent minds video session 2 uva wise increasing costCoherent ramblings for coherent minds video session 2 uva wise increasing cost
Coherent ramblings for coherent minds video session 2 uva wise increasing cost
 
Coherent ramblings for coherent minds video session 2 uva wise increasing cost
Coherent ramblings for coherent minds video session 2 uva wise increasing costCoherent ramblings for coherent minds video session 2 uva wise increasing cost
Coherent ramblings for coherent minds video session 2 uva wise increasing cost
 
Who pays taxes charts
Who pays taxes chartsWho pays taxes charts
Who pays taxes charts
 
Compare the candidates ppt
Compare the candidates pptCompare the candidates ppt
Compare the candidates ppt
 
Health care waste wp
Health care waste wpHealth care waste wp
Health care waste wp
 

Recently uploaded

{Qatar{^🚀^(+971558539980**}})Abortion Pills for Sale in Dubai. .abu dhabi, sh...
{Qatar{^🚀^(+971558539980**}})Abortion Pills for Sale in Dubai. .abu dhabi, sh...{Qatar{^🚀^(+971558539980**}})Abortion Pills for Sale in Dubai. .abu dhabi, sh...
{Qatar{^🚀^(+971558539980**}})Abortion Pills for Sale in Dubai. .abu dhabi, sh...
hyt3577
 

Recently uploaded (20)

05052024_First India Newspaper Jaipur.pdf
05052024_First India Newspaper Jaipur.pdf05052024_First India Newspaper Jaipur.pdf
05052024_First India Newspaper Jaipur.pdf
 
06052024_First India Newspaper Jaipur.pdf
06052024_First India Newspaper Jaipur.pdf06052024_First India Newspaper Jaipur.pdf
06052024_First India Newspaper Jaipur.pdf
 
Nara Chandrababu Naidu's Visionary Policies For Andhra Pradesh's Development
Nara Chandrababu Naidu's Visionary Policies For Andhra Pradesh's DevelopmentNara Chandrababu Naidu's Visionary Policies For Andhra Pradesh's Development
Nara Chandrababu Naidu's Visionary Policies For Andhra Pradesh's Development
 
BDSM⚡Call Girls in Sector 135 Noida Escorts >༒8448380779 Escort Service
BDSM⚡Call Girls in Sector 135 Noida Escorts >༒8448380779 Escort ServiceBDSM⚡Call Girls in Sector 135 Noida Escorts >༒8448380779 Escort Service
BDSM⚡Call Girls in Sector 135 Noida Escorts >༒8448380779 Escort Service
 
Busty Desi⚡Call Girls in Sector 62 Noida Escorts >༒8448380779 Escort Service
Busty Desi⚡Call Girls in Sector 62 Noida Escorts >༒8448380779 Escort ServiceBusty Desi⚡Call Girls in Sector 62 Noida Escorts >༒8448380779 Escort Service
Busty Desi⚡Call Girls in Sector 62 Noida Escorts >༒8448380779 Escort Service
 
China's soft power in 21st century .pptx
China's soft power in 21st century   .pptxChina's soft power in 21st century   .pptx
China's soft power in 21st century .pptx
 
Group_5_US-China Trade War to understand the trade
Group_5_US-China Trade War to understand the tradeGroup_5_US-China Trade War to understand the trade
Group_5_US-China Trade War to understand the trade
 
Julius Randle's Injury Status: Surgery Not Off the Table
Julius Randle's Injury Status: Surgery Not Off the TableJulius Randle's Injury Status: Surgery Not Off the Table
Julius Randle's Injury Status: Surgery Not Off the Table
 
BDSM⚡Call Girls in Greater Noida Escorts >༒8448380779 Escort Service
BDSM⚡Call Girls in Greater Noida Escorts >༒8448380779 Escort ServiceBDSM⚡Call Girls in Greater Noida Escorts >༒8448380779 Escort Service
BDSM⚡Call Girls in Greater Noida Escorts >༒8448380779 Escort Service
 
Verified Love Spells in Little Rock, AR (310) 882-6330 Get My Ex-Lover Back
Verified Love Spells in Little Rock, AR (310) 882-6330 Get My Ex-Lover BackVerified Love Spells in Little Rock, AR (310) 882-6330 Get My Ex-Lover Back
Verified Love Spells in Little Rock, AR (310) 882-6330 Get My Ex-Lover Back
 
WhatsApp 📞 8448380779 ✅Call Girls In Chaura Sector 22 ( Noida)
WhatsApp 📞 8448380779 ✅Call Girls In Chaura Sector 22 ( Noida)WhatsApp 📞 8448380779 ✅Call Girls In Chaura Sector 22 ( Noida)
WhatsApp 📞 8448380779 ✅Call Girls In Chaura Sector 22 ( Noida)
 
America Is the Target; Israel Is the Front Line _ Andy Blumenthal _ The Blogs...
America Is the Target; Israel Is the Front Line _ Andy Blumenthal _ The Blogs...America Is the Target; Israel Is the Front Line _ Andy Blumenthal _ The Blogs...
America Is the Target; Israel Is the Front Line _ Andy Blumenthal _ The Blogs...
 
Embed-2 (1).pdfb[k[k[[k[kkkpkdpokkdpkopko
Embed-2 (1).pdfb[k[k[[k[kkkpkdpokkdpkopkoEmbed-2 (1).pdfb[k[k[[k[kkkpkdpokkdpkopko
Embed-2 (1).pdfb[k[k[[k[kkkpkdpokkdpkopko
 
Embed-4.pdf lkdiinlajeklhndklheduhuekjdh
Embed-4.pdf lkdiinlajeklhndklheduhuekjdhEmbed-4.pdf lkdiinlajeklhndklheduhuekjdh
Embed-4.pdf lkdiinlajeklhndklheduhuekjdh
 
02052024_First India Newspaper Jaipur.pdf
02052024_First India Newspaper Jaipur.pdf02052024_First India Newspaper Jaipur.pdf
02052024_First India Newspaper Jaipur.pdf
 
04052024_First India Newspaper Jaipur.pdf
04052024_First India Newspaper Jaipur.pdf04052024_First India Newspaper Jaipur.pdf
04052024_First India Newspaper Jaipur.pdf
 
Enjoy Night ≽ 8448380779 ≼ Call Girls In Gurgaon Sector 46 (Gurgaon)
Enjoy Night ≽ 8448380779 ≼ Call Girls In Gurgaon Sector 46 (Gurgaon)Enjoy Night ≽ 8448380779 ≼ Call Girls In Gurgaon Sector 46 (Gurgaon)
Enjoy Night ≽ 8448380779 ≼ Call Girls In Gurgaon Sector 46 (Gurgaon)
 
{Qatar{^🚀^(+971558539980**}})Abortion Pills for Sale in Dubai. .abu dhabi, sh...
{Qatar{^🚀^(+971558539980**}})Abortion Pills for Sale in Dubai. .abu dhabi, sh...{Qatar{^🚀^(+971558539980**}})Abortion Pills for Sale in Dubai. .abu dhabi, sh...
{Qatar{^🚀^(+971558539980**}})Abortion Pills for Sale in Dubai. .abu dhabi, sh...
 
Busty Desi⚡Call Girls in Vasundhara Ghaziabad >༒8448380779 Escort Service
Busty Desi⚡Call Girls in Vasundhara Ghaziabad >༒8448380779 Escort ServiceBusty Desi⚡Call Girls in Vasundhara Ghaziabad >༒8448380779 Escort Service
Busty Desi⚡Call Girls in Vasundhara Ghaziabad >༒8448380779 Escort Service
 
Transformative Leadership: N Chandrababu Naidu and TDP's Vision for Innovatio...
Transformative Leadership: N Chandrababu Naidu and TDP's Vision for Innovatio...Transformative Leadership: N Chandrababu Naidu and TDP's Vision for Innovatio...
Transformative Leadership: N Chandrababu Naidu and TDP's Vision for Innovatio...
 

Assessing the costs of public higher education in the commonwealth of virginia part 3

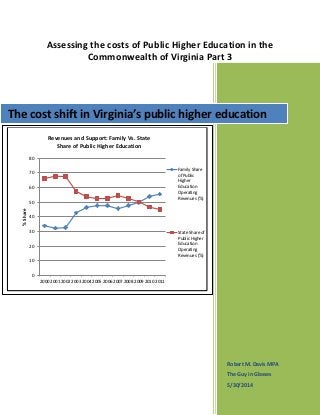
  • 1. Assessing the costs of Public Higher Education in the Commonwealth of Virginia Part 3 Robert M. Davis MPA The Guy in Glasses 5/30/2014 The cost shift in Virginia’s public higher education 0 10 20 30 40 50 60 70 80 2000 2001 2002 2003 2004 2005 2006 2007 2008 2009 2010 2011 %Share Revenues and Support: Family Vs. State Share of Public Higher Education Family Share of Public Higher Education Operating Revenues (%) State Share of Public Higher Education Operating Revenues (%)
  • 2. Assessing the costs of Public Higher Education in the Commonwealth of Virginia: Are costs going up? How much? And have incomes been able to meet those costs? To illustrate this cost shift, it is beneficial to examine what is called the state share and family share of public higher education. The state share consists of state tax appropriations that support or benefit higher education; Family Share is the gross amount of tuition and fees, less state and institutional financial aid, tuition waivers or discounts. This is a measure of the resources available through tuition and fees to support instruction and related operations at public higher education institutions (IPEDS, 2012). Figure 1: Family share vs. state share of public higher education. This figure illustrates the percentage share in which a student pays, and what the state pays. The state share is the proportion of cost which is subsidized through appropriations, whereas the student share (family share) is the proportion of cost paid through tuition and fees (IPEDS, 2012). The concerns of the public seem to mirror those concerns represented by politicians in regard to the rising costs of public higher education. The public perspective, according to the respondent result of the Pew research (2011) survey strengthens the identification of the cost shifting behaviors taking place in public higher education; cost shifting occurs when the cost burden (who pays) is shifted (parents and students are paying more to attend public higher education) as a result of the funding nature in the public higher education market. 0 10 20 30 40 50 60 70 80 200020012002200320042005200620072008200920102011 %Share Revenues and Support: Family Vs. State Share of Public Higher Education Family Share of Public Higher Education Operating Revenues (%) State Share of Public Higher Education Operating Revenues (%)
  • 3. The 2000-2011 year period data shows that a shift has occurred in the financing share of the operational cost of higher education, one in which families and students will have to foot a greater portion of the bill. This has become the new normal according to associated data collection compiled throughout the context of this research. How are parents and students managing cost increases? As cost have risen each year in tandem, so has the number of Virginia residents that are classified as “with need” for financial assistance to attend one of Virginia’s public four year institutions. The State Council of Higher Education for Virginia provides a look into the evolving trends in higher education at the Virginia level. There have been significant increases in the trend relating to the number of students classified as being “with need” (SCHEV, 2013c). With need classification entails that a student, based upon their reported income will need some form of financial support in order to afford the costs of attendance. The number of Virginia resident students classified as “with need” has grown by 253% or 76,535 from year 1992 to 2012. More Virginia residents are going to college, especially those students from lower income representative groups (SCHEV, 2013c). Low income classifications of individuals have increased in terms of enrollment and this data correlates with the presented data represented by figure 2 illustrates that the number of students classified as “with need” have increased as well. The majority of increases have occurred among those income classifications designated as falling below the reported median household income (SCHEV, 2013c).
  • 4. Figure 2: Illustrates the number of students designated as “with need” in meeting financial costs of attendance among Virginia’s colleges and universities (SCHEV, 2013c). Calculations performed by the author. The findings illustrate how the costs burden has shifted from the state (majority share of financing) to the individual and as a result individuals must pay more to attend public higher education in Virginia. Despite this cost shift, individuals from lower income classifications have increased in enrollment, during a period by which lower income classifications have seen their reported income earnings stagnate or decline1 . How are these individuals paying for attendance at public higher education institutions as costs to attend them are increasing? The solution appears to be loans. Borrowing to pay for college The type of financial aid that is available to students comes in the form of three main classifications: Loans (private and federal), scholarships (money provided by the institution directly to the student or some other organization) and other aid (grants, work study, and other 1 See Assessing the costs of Public Higher Education in the Commonwealth of Virginia Part 2 30,215 4,892 137 106,750 33,807 10,031 0 20,000 40,000 60,000 80,000 100,000 120,000 $0 to $50,000 $50,000 to $100,000 Greater than $100,000 Number of In-State students classified as "with need" Years 1992 to 2011 1992-1993 2011-2012
  • 5. forms of aid). However, loans make up the majority proportional share in meeting the costs of public higher education (SCHEV, 2013; SCHEV, 2013a). Figure 2: Illustrates the % share of financial aid in meeting financial costs of attendance among Virginia’s colleges and universities. Among public state supported four year institutions, Virginia graduates from the class of 2011 carried $22,655 in student loan debt (average) and from fiscal year 2006 (pre-recession) to fiscal year 2011, the average amount of debt held by graduates in Virginia increased by 30.5%. Debt held by students from Virginia public state supported four year institutions saw the amount of debt burden increase. Virginia’s percentage of graduates finishing with some form of debt obligation was 56% of total graduates from the class of 2011 among all public colleges and universities in Virginia; this includes both federal and private loan obligations (College Insight, 2013). The amount of loan borrowers has increased by 27.2% over the same six year period (SCHEV, 2013a). What this shows is more students attending public higher education institutions are borrowing loans each year to afford access to public higher education. The average amount of debt per student among Virginia’s institutions has increased 35% from year 2006 to2011. Not only has the number of in-state students whom rely on borrowing as 55% 55% 55% 54% 54% 55% 36% 35% 37% 39% 40% 38% 9% 10% 8% 7% 6% 7% 0% 20% 40% 60% 80% 100% 2006 2007 2008 2009 2010 2011 %ShareoftotalFin.Aid. % share of total Financial aid per source % Share that Loans make up as total of Fin. Aid (Average) % Share that Other Aid makes up as a total of Fin. Aid (Average) % Share that Scholarships make up as a total of Fin. Aid (Average)
  • 6. a need to cover the costs of attendance, but as well so has the amount borrowed per student increased (SCHEV, 2013a). A regression analysis of the data presented in this research shows that a strong positive linear relationship correlates between the two variables examined: the average amount of total costs to attend one of Virginia’s public higher education institutions and the amount of loans (on average) being borrowed per attending in-state student. Figure 3: Regression analysis between variables average costs of attendance and average loan amount borrowed. Figure 4: Regression statistics between variables average costs of attendance and average loan amount borrowed. The regression analysis and the accompanying statistics from the calculation illustrate that as the costs of attendance to attend Virginia’s public higher education institutions increases; there is a related change in the amount of loans being borrowed per enrolled in-state student. $- $5,000 $10,000 $15,000 $20,000 $- $2,000 $4,000 $6,000 $8,000 $10,000 AverageTotalCostsofAttendance Average Loan Amount Borrowed Cost of Attendance & Amount Borrowed Regression Analysis Regression Statistics Multiple R 0.984878697 R Square 0.969986048 Adjusted R Square 0.96248256 Standard Error 301.1559061 Observations 6
  • 7. This observational change between the variables (cost of attendance and loan amount borrowed) signifies the identification of correlation2 . The average loan amount borrowed accounted for 49% of the lowest quintile income in year 2006 and 65% in year 2011; for the second quintile group loan amounts accounted for 19% of household income in year 2006 and 24% in year 2011. Each quintile group experienced a larger share of their income being accounted for, but lower income quintile groups had a more significant impact (U.S. Census Bureau, 2013b; SCHEV, 2006-2012). In summary; the data represents that as loans comprise the majority share of total financial aid used by students to cover cost, increasing costs has pushed the borrowed loan amount per borrower higher. Enrollments of individuals from lower income quintile classification groups during a period of cost shifting is taking place as costs have gone up, income for lower income groups has remained stagnant or decreased, and individuals have turned to loans to finance the majority share of Virginia’s public higher education cost. *Continued in the next segment released3 2 Correlation does not imply causation. This merely identifies that a relationship may be culled from the changes between the two variables observed. 3 Full body of research can be read, reviewed and accessed here: http://vtechworks.lib.vt.edu/handle/10919/23281
  • 8. References Joint Legislative Audit And Review Commission (JLARC), (2012).Virginia compared to other states: National rankings on states, budgetary components, and other indicators (419). Retrieved from Commonwealth of Virginia website: http://jlarc.state.va.us/reports/Rpt419.pdf United States Census Bureau. (2013a). American community survey: Median income in the past 12 months virginia; years 2006-2011 [Data File]. Retrieved from http://factfinder2.census.gov United States Census Bureau. (2013b). American community survey: Mean household income of quintiles Virginia; years 2006-2011 [Data File]. Retrieved from http://factfinder2.census.gov State Council of Higher Education for Virginia (SCHEV), (1990-2012).Tuition and fees at virginia's state-supported colleges and universitiys. Richmond,VA: The Commonwealth of Virginia. http://www.schev.edu/reports/reportsindex.asp College Board Advocacy & Policy Center. (2012). Trends in College Pricing 2012. Retrieved 2012, from Collegeboard.org: https://trends.collegeboard.org/sites/default/files/college-pricing- 2012-full-report_0.pdf Integrated Postsecondary Education Data System (IPEDS). (2012). Compare individual institutions: Virginia public 4 year institutions; finance, tuition revenues, state appropriations [Data File]. Retrieved from http://nces.ed.gov/ipeds/datacenter/InstitutionList.aspx Pew Research Center. (2011, May 15). Is college worth it?:college presidents, public assess, value, quality and mission of higher education. Retrieved from http://www.pewsocialtrends.org/2011/05/15/is-college-worth-it/