SlideShare uma empresa Scribd logo
1 de 28
Applications of Resonance Enhanced Raman
           Spectroscopy: Electronic Structure Probe of
           Metal-Sulfur Interactions in Oxo-Molybdenum
                    Ene-1,2-Dithiolate Systems
                                          Frank E. Inscore
                                      The University of Arizona


                         C H3       (Tp*)MoO(bdt)
                                O
  H3C
                 N                   S
             N
      HB                      Mo
            N
H3C              N                   S


                                C H3 C H
                                        3
                          N

                     N


                 H3C                                      Active Site of Sulfite Oxidase
The Raman Spectroscopic Technique
                General Considerations

Research and Industrial Applications
    Structure/ Solid State/ Biological Chemistry


Utility of Raman Spectroscopy
    Problematic: Inherent Weak Effect

            Problematic: Fluorescence Complications

                      Problematic: Instrumental Limitations


Development of New Techniques

    FT-RS/ SERS/ RERS
Resonance Raman Spectroscopy
     Characterizing Structure/ Monitoring Reactivity in Catalytic Systems


Chemical and Petroleum/ Energy Production Industries


• Catalyst Structure and Reactivity: Surface and In Situ Studies
Heterogeneous processes: Supported metal oxides (MoO/ WO) used as catalyst.

Hydrodesulfurization catalyst: Removal of sulfur from petroleum feedstocks.


Biological Systems


• Structure/ Function In Situ Studies
Protonation in Biomolecules: S-H/ S-S conversion.

Mechanistic insight into Carcinogenesis: Blue/green particle in tumors; Cu-S bonding.

Structural Insight in Metalloproteins.
Overview of Presentation

•   Raman Applications                                     • What we are doing?
•   Background
•   Electronic Structure                                   • Why we are studying?
•   Raman Instrumentation
•   Resonance Raman Studies                                • How we will probe?
•   Implications for Mo Enzymes

                                        C H3
                                               O
                   H3C
                                N                   S
                            N
                       HB                    Mo
                            N
                 H3C            N                   S


                                               C H3 C H
                                                       3
                                         N

                                    N


                                H3C
The Importance of Metal 1,2-Dithiolene Complexes
                  General Considerations
Why the Interest in Transition Metal-Sulfur Complexes?
 Industrial Applications/ Commercial Uses:

  Vulcanization Accelerators for Rubber               Wear Additive Inhibitors in Lubricants
  Catalytic Inhibitors /Oxidation Catalyst            Mode-Locking Additives in Nd Lasers

 Potential Biological Activity:
                Correlations with Biological Systems containing Metal to Sulfur Bonds.


What Is an Ene-1,2-Dithiolate Ligand ?

 Four Prototypical Ene-1,2-Dithiolate Systems:

                                             -S   H    -S        -S N        -S    S
                          -S
        M
            S                            =   -S        -S        -S N        -S
            S              -S                     H                                S


Relevance to structure, bonding and function of Metalloenzyme active site centers
Pyranopterin Molybdenum and Tungsten Enzymes
           Background and Significance
3 Mo Families based on structure and reactivity
2 W Families similar to DMSO reductase family

                O                                    S                                   O
                                                                               S er -O
            S        O                                       O
                Mo                           S                                 S             S
                                                 Mo                                  Mo
        S            S - C ys            S                O H2             S                 S

    Sulfite Oxidase                   Xanthine Oxidase                     DMSO Reductase


                         # X-ray crystallography reveals
                            a common structural unit:
                               Pyranopterin cofactor
                                        O                S-
                                                 H
                                                 N               S-
                                  HN
                                H2N     N        N       O            OPO 2-
                                                 H                       3
The Resonance Raman Spectroscopic Probe
Structure/ Bonding in the Active Site of DMSO Reductase

      Single Metal Redox Center                       RO O
                                                           (VI)
  •    XAS [Mo(VI,V,IV)]                              S      S
                                                         M
  •    MCD/ EPR [Mo(V)]                               S      S
                                                                      (Mo-S)
  •    Electronic Absorption                         (Mo=O)      x
  •    Resonance Raman


  Observe enhanced isotopic sensitive Mo=O and Mo-S vibrations.

  Parallel model studies on both relevant and simpler systems needed.
Outstanding Issues in Pyranopterin Mo Enzyme Catalysis
                              Primary Issue
    What is Structural and Functional Role of the Pyranopterin Ene-1,2-
                Dithiolate Unit During Course of Catalysis?


 Research Goal
 Derive fundamental understanding at molecular level, into how the unique
 geometric and electronic structure of these enzyme active sites contribute
 to their reactivity.

Research Objectives
Utilize available physical characterization methods to determine the
geometric and electronic structure of small synthetic active site analogs.

Derive key factors that define geometric/electronic structure relationships
and correlate to the unique enzymatic spectroscopic features and their
electronic contributions to structure-bonding/ function.
Chemical Evolution of Mo and W Dithiolene Systems
                            The Reductionist Approach


            CH3
  H3C         O                          O        -1, -2        O       -1
        N          S                                          RO
   HB N                              S   S                    S   S
      N N     M                        M                        M
H3C                S                 S   S                    S   S
                 CH3                                                    -1
             N      CH3                                         OR
         N                                                    S   S
                                                  -1,0          M
         H3C                                                  S   S
                                     S       S
           CH3                           M
                                     S        S
  H3C        S                                                           -2
       N N Mo S                                                OO
   HB                                                         S   S
H3C   N N       S                                               M
                                                              S   S
             CH                                   0, +1
            N 3CH3
          N                                   S
                                         M
                                              S
                                                                         -2
        H3C                                                     OO
        CH3                                                   S    SR
              O                                                  M
  H3C                     0, -1                               S    Y
        N     N
                 S
  HB N        Mo                                                 O
H3C   N N        S                       SS       0, -1, -2              -1
                                                               S   SR
                                     S        S                  M
                 CH3                     M                     S   Y
             N      CH3              S        S
         N

        H3C
Minimal Structural Models/ Effective Spectroscopic Models

     Simple model; Mo coordinated by Ene-1,2-Dithiolate and terminal Oxo.

     Isolated Oxo-Mo-Dithiolate Center; Controlled six coordinate environment.

     Possess Mo(V) paramagnetic centers; Amenable to EPR/ MCD probes.

                         C H3
                            E
          H3C
                 N
                     N           S                      (S-S)
           HB                M
                N                S
       H3 C          N                                         Cl
                                       -S    -S     C H3 - S        -S   N
                             CH C H
                               3
                         N         3
                                       -S    -S          -S         -S   N
                     N
    (Tp*)ME(S-S)                                               Cl

                     H3C


Probe fundamental properties of Oxo-Mo mono-ene1,2-dithiolate complexes:
Metal (M = Mo, W), axial (E = O, S, NO) and dithiolate (S-S) coordination effects.
MCD and Electronic Absorption Spectroscopy
      Low Temperature Solid-State (PDMSO Mull) Studies
              0.8                                                                1000
                    Absorption (5K)           MCD (5K /7T)
              0.7

              0.6                                                                500


                                                                                         MCD Intensity (mdeg)
              0.5


Absorbance
              0.4                                                                0


              0.3

              0.2     1        2                                                 -500
                                     (3, 4)      5   6       7

              0.1

               0                                                                 -1000
                    8000     12000   16000    20000    24000     28000   32000
                                         Energy (wavenumbers)


                      Complimentary selection rules:
                          resolve electronic transitions in spectra
Band Assignments from Combined Spectroscopic Approach

  y a'z2


                                                                                                            Solution Electronic Absorption (DCE)
 y a''x2-y2
                                                4                                                 6400

y x'z y a'y'z
 a''
                                                                    7
                                           3                6                                                                                    7
                                                                                                  5600


                                                                                                  4800
 y a'xy
                            1       2                  5


                                                                                Epsilon (M cm )
                                                                                -1
                                                                                                  4000                                   6
 y a''op

  y a'op                                                                        -1                3200


                                                                                                  2400

  y a'ip                                                                                                                         5
                                                                                                  1600
  y a''ip
                                                                                                   800      1       2   (3, 4)
                    a'xy   +   a'ip   a'xy   +   a'op   a'yz   +   a'op
  O                                                                                                  0
  M        S
                                                                                                         8000   12000   16000    20000       24000   28000   32000
      = 90    0
                                                                                                                          Energy (wavenumbers)

  O
  M
            S
       > 90   0
Resonance Raman Scattering
                       Enhancement of the Raman signal

Sensitive and selective probe of structure/ bonding
 Vibrational frequencies: sensitive to inner coordination environment.
 Intensitiy: selective enhancement associated with absorbing metal center.

                             Resonance                     FC - A Term
  Normal Raman    Rayleigh
                             Raman                            O        HT - B Term
                                                                                     E’
                                          E1
                      o     o                                  M           S


                                                                 O       S
IR
                                     '                          M   S
                                     
                                          E0
                                                                     S


Selectivity based on resonant electronic transition and excited state distortion.
 Intensity depends on energy and intensity of electronic absorption band.

 Enhancement result of coupling with electronic excited state.
Raman Experimental Instrumentation and Techniques
                                  Design and Methodology

Goal: Obtain Low-frequency vibrational information regarding M-S bonding.

                                             Computer                System
                                             Controller              Interface


                Titanium Sapphire Laser                            Argon Ion Laser


                                                                                                CCD


                                                          Sample

         Krypton Ion Laser

                                                        Illumination/ Collection
                                      Pre Monochromator           Optics           SPEX 1877
                                        SPEX 1405                                  Triplemate
Collection Geometry
                                      Computer                 System
                                      Controller               Interface


                                                            Argon Ion Laser


           90 degree geometry
                                                                                           CCD


                                                   Sample


                                                   Illumination/ Collection
                                                             Optics           SPEX 1877
135 degree back scattering geometry                                           Triplemate
The Resonance Raman Experiment
Laser Enhanced Raman Spectroscopy
Sample Illumination and Collection Optics
Sample Handling, Detection and Dispersal System


Samples Problematic: Photo Decomposition/ Thermal Degradation?
Vibrational Raman Spectroscopy
                          C H3
                                                                               (Tp*)MoO(bdt) in NaCl/ Na2SO4
                                 O                                    8500
     H 3C                                                                          140K 528.7 nm ~40 mW
                  N                   S                               8000
              N
        HB                     Mo                                     7500                                               3
             N
  H3C             N                   S
                                                                      7000
                                                                                        1
                                 C H3 C H                             6500         6


                                              Raman Intensity (cps)
                           N             3
                                                                      6000
                      N
                                                                      5500
                                                                             300         400   500    600    700   800   900    1000   1100

                                                                                   (Tp*)MoO(bdt) in Benzene
                  H 3C                                                2000
                                                                                    293K 514.5 nm ~75 mW
                                                                      1900


 3 vibrational bands observed                                         1800

                                                                      1700

                                                                      1600


 6 = 362 cm-1 1 = 393 cm-1  3 = 932 cm-1                           1500
                                                                                                                           3
                                                                                   6 1
                                                                      1400

                                                                      1300
                                                                             300        400    500     600   700   800   900    1000    1100

                                                                                                     Raman-shift (wavenumbers)
Identify normal modes coupled to electronic transitions
Solution Raman Depolarization Studies
                                                                        2000

        Depolarization Ratio                                                               (Tp*)MoO(bdt) in Benzene
                                                                        1900
                                                                                              293K 496.5 nm ~75 mW
                                                                        1800

 = I/ I                                                            1700
                                                                                             Parallel polarization

    0   3/4                                                         1600                               I 
           ¾
                                                                        1500
                                                                                                                          3
                                                                        1400     6 1


                                                Raman Intensity (cps)
                                                                        1300
                                                                               300   400     500     600      700   800   900        1000   1100
           Totally symmetric (polarized)
        Non-totally symmetric (depolarized)                             2000

                                                                        1900

                                                                        1800
                                                                                           Perpendicular polarization
    Ratio indicates 3 modes are totally symmetric                       1700


  6(A = 362 cm-1
      ')                                                                1600
                                                                                                             I
                                                                        1500
                  1(A = 393 cm-1
                      ')
                                                                        1400     6 1                                          3
                                 3(A = 932 cm-1
                                     ')                                 1300
                                                                               300   400     500     600      700   800   900        1000   1100

                                                                                                   Raman-shift (wavenumbers)
Vibrational Analysis
                                           (Tp*)MoO(bdt) in Benzene
                        2000                                  CH3
                                                                                          O
                                         H3C                    O                                                                      z                                z
                                                                                                S
                                                 NN     S
                        1900
                                                                                          Mo
                                                 N N Mo S
                                           HB

                                                                                                S
Raman Intensity (cps)


                                     H3C
                        1800                                                                                                           O                                O
                                                                    CH3 CH
                                                       N                  3

                        1700                          N                                                                                M       y           (zy)        M                y
                                                                                                                   B N
                                                                                                                     N                     S                                    S
                        1600                                                                                                               S                        x           S
                                 362 cm-1 H C             3
                                                                                      932 cm-1
                                                                                                                       x               N
                                                 -1
                        1500      ( A' ) 393 cm                                           ( A' )
                                     6                                                     3
                                                ( A' )
                                                1
                        1400                                                                                                                             O
                                                                                                                             O                                                       O

                        1300
                               300         400      500              600      700   800   900        1000   1100             M                           M                           M
                                                                                          -1                       S                   S           S            S           S                S
                                                                       Raman-shift (cm )
                                                                                                                           1 ( A' )                   2 ( A'' )                   3 ( A' )
                Key Points:
                        3 bands observed – polarized (A’ symmetry)                                                           O                           O                           O

                                                                                                                             M                           M                           M
                         Intensity enhancement patterns consistent                                                 S                   S           S            S           S                S

                         With M-S/ M=O vibrational assignments                                                             4 ( A' )                   5 ( A'' )
                                                                                                                                                                                     ( A' )
                                                                                                                                                                                     6


            Resonance Raman spectroscopy probes:
                        Differences in bonding between ground and excited states via distortions along specific normal modes.
Solid-State Excitation Profiles
Key Points:
  Observe large differential enhancement of Mo=O
  Transitions probed are orthogonal (in-plane vs out-of-plane)
                                                                  O

        (Tp*)MoO(bdt): 8K PDMSO mull EA; 100K RR NaCl/ Na2SO4     M              S

                                                                             S
                                                                  3( A' )
                              Sop  Mo dxz,yz
                                                                   O
              Sip  Mo dxy                                                       S
                                                                   M

                                                                             S
                                                                 1( A' )

                                                                   O

                                                                   M             S

                                                                             S

                                                                  6( A' )
Conclusions:
Sip  Mo dxy CT probes covalent contributions to ground-state
 S Mo CT probes electronic contributions to redox potentials
Implications for Catalytic Reactivity in Enzymes
  Lowest energy (intense) CT must be Sip  Mo dxy
 This CT transition probes covalency contributions to ET pathway.
  M=O aligns redox orbital for facile ET via unique 3-center 2-electron bond.


                                                               O              SO32-    SO42-                O
                                                                    O                                            OH 2
                                                           S                                            S
                     yxya'                                     Mo (VI)                                      Mo (IV)
                                                           S             S cys                          S             S cys

        xya'                                                        H+, e-      H2O
                                    S-Moxy
                                    3-center                                               H+, e-
                              pseudo- antibonding


                                                                                       O       OH
     S-Moxy
    3-center                                                                      S
pseudo- bonding                                                                       Mo (V)
                                         a'
                                   ip                                            S             S cys


                                              Criteria for efficient ET
                      yipa'   Reason Nature has chosen ene-1,2-dithiolate and M=O groups
                                              Good M-L overlap/ Minimize ROE
Conclusions
Resonance Raman Important Probe of Ground and Excited State Structure


  State of the Art Equipment Necessary for probing M-S Bonding.


 Contributions of M-L Bonding to Electronic Structure Elucidated by RR
 Especially when Combined with other Spectroscopic Techniques.


  RR Spectroscopy Important Tool for Characterizing Enzyme Active Sites
  when Interpreted within Context of Well-Defined Small Molecular Models.


  Protocols Developed can be Applied to more Complicated Systems.
Acknowledgements and Funding

                                                                                                          *
                                                                                                                                                                                                                                         HeI
                                                                                                                                             Prof. John H. Enemark                                                                                                  HOMO
                                                          Pseudo anti-bonding


                                         Mo dxy
                                                                              h = 579 nm
                                                                                                                              Enemark Research Group                                                                                                              HOMO -1&-2
                                                                                                                                                                                                                                         HeII
                                                                                     Sip
                                                                                                                                University of Arizona
                                                                  Pseudo bonding
                                                                   *                                                                                                                                                                                              HOMO-3 &-4
                   *                                                                             *
                                                                                                                                                                                                           10.5 10   9.5   9   8.5   8   7.5   7   6.5   HOMO-5
                                                                                                                                                                                                                 Ionization Energy (eV)


                                                                                                                                              Prof. Martin L. Kirk
National Institutes of Health                                                                                                                                                                              National Science Foundation
                                                                                                                               Kirk Research Group
                                                                                                                              University of New Mexico
Petroleum Research Fund                                                                                                                                                                                    Sandia National Laboratories
                       C16
                                   O
           C14
                        C15               S2                 C4
                                                C2
          C13                      MO
    C17                                              C3

   C24                  C26         S1                         C5
                       N21                      C1   C6
                  B                N31
     C23         N32                    C36
                                                                                                                                                     (Tp*)M oO(qdt) in Benze ne at 514.5nm
   C27                       C33
           C37                      C34
                                                                                                                                      4000


                                                                               (Tp*)MoO(bdt)                                          3800
                                                                                                              Raman Intensity (cps)


                                                                                                                                      3600


                                                                                                                                      3400


                                                                                (Tp*)WO(bdt)
                                                                                                                                      3200


                                                                                                                                      3000


                                               10    9.5          9     8.5      8    7.5   7   6.5   6
                                                                                                                                               400    600           800               1000   1200   1400
                                                                  Ionization Energy (eV)                                                                                        -1
                                                                                                                                                                Ram an S h ift (cm)

Mais conteúdo relacionado

Destaque

Rasonance raman specroscopy
Rasonance  raman specroscopyRasonance  raman specroscopy
Rasonance raman specroscopytidke123
 
Raman spectroscopy by nitish kumar
Raman spectroscopy by nitish kumarRaman spectroscopy by nitish kumar
Raman spectroscopy by nitish kumarNITISH KUMAR
 
Raman Spectroscopy
Raman SpectroscopyRaman Spectroscopy
Raman Spectroscopyyomology
 
Introduction to raman spectroscopy
Introduction to raman spectroscopyIntroduction to raman spectroscopy
Introduction to raman spectroscopyamirhosein66
 
Raman Spectroscopy
Raman SpectroscopyRaman Spectroscopy
Raman Spectroscopykrishslide
 
Raman spectroscopy
Raman spectroscopy Raman spectroscopy
Raman spectroscopy Aravind AB
 
Raman spectroscopy
Raman spectroscopyRaman spectroscopy
Raman spectroscopyajamilan12
 

Destaque (8)

Rasonance raman specroscopy
Rasonance  raman specroscopyRasonance  raman specroscopy
Rasonance raman specroscopy
 
Raman spectroscopy
Raman spectroscopyRaman spectroscopy
Raman spectroscopy
 
Raman spectroscopy by nitish kumar
Raman spectroscopy by nitish kumarRaman spectroscopy by nitish kumar
Raman spectroscopy by nitish kumar
 
Raman Spectroscopy
Raman SpectroscopyRaman Spectroscopy
Raman Spectroscopy
 
Introduction to raman spectroscopy
Introduction to raman spectroscopyIntroduction to raman spectroscopy
Introduction to raman spectroscopy
 
Raman Spectroscopy
Raman SpectroscopyRaman Spectroscopy
Raman Spectroscopy
 
Raman spectroscopy
Raman spectroscopy Raman spectroscopy
Raman spectroscopy
 
Raman spectroscopy
Raman spectroscopyRaman spectroscopy
Raman spectroscopy
 

Semelhante a Postdoc Ph D Research Fei 2002

Large-scale computational design and selection of polymers for solar cells
Large-scale computational design and selection of polymers for solar cellsLarge-scale computational design and selection of polymers for solar cells
Large-scale computational design and selection of polymers for solar cellsbaoilleach
 
Transition Metals As Spectroscopic Probes for Structure and Reactivity
Transition Metals As Spectroscopic Probes for Structure and ReactivityTransition Metals As Spectroscopic Probes for Structure and Reactivity
Transition Metals As Spectroscopic Probes for Structure and ReactivityBrandon Alexander
 
160_P16CH21_2020051802575864.pdf
160_P16CH21_2020051802575864.pdf160_P16CH21_2020051802575864.pdf
160_P16CH21_2020051802575864.pdframagoudahinglaje2
 
160_P16CH21_2020051802575864.pdf
160_P16CH21_2020051802575864.pdf160_P16CH21_2020051802575864.pdf
160_P16CH21_2020051802575864.pdframagoudahinglaje2
 
Lanthanide shift reagents in nmr
Lanthanide shift reagents in nmrLanthanide shift reagents in nmr
Lanthanide shift reagents in nmrDongguk University
 
Synthesis, Spectroscopic Studies and Antibacterial Activity of Novel Schiff B...
Synthesis, Spectroscopic Studies and Antibacterial Activity of Novel Schiff B...Synthesis, Spectroscopic Studies and Antibacterial Activity of Novel Schiff B...
Synthesis, Spectroscopic Studies and Antibacterial Activity of Novel Schiff B...IRJET Journal
 
Mossbauer Spectroscopy Applications - detection of oxidation state by Himansh...
Mossbauer Spectroscopy Applications - detection of oxidation state by Himansh...Mossbauer Spectroscopy Applications - detection of oxidation state by Himansh...
Mossbauer Spectroscopy Applications - detection of oxidation state by Himansh...Himanshu Asati
 
Inhibition, kinetic and thermodynamic effects of new Azo derivatives on iron ...
Inhibition, kinetic and thermodynamic effects of new Azo derivatives on iron ...Inhibition, kinetic and thermodynamic effects of new Azo derivatives on iron ...
Inhibition, kinetic and thermodynamic effects of new Azo derivatives on iron ...Al Baha University
 
Coordination modes of a new ligand derived from pyrazoline with cr(iii), mn(i...
Coordination modes of a new ligand derived from pyrazoline with cr(iii), mn(i...Coordination modes of a new ligand derived from pyrazoline with cr(iii), mn(i...
Coordination modes of a new ligand derived from pyrazoline with cr(iii), mn(i...Alexander Decker
 
Sigma xishowcase
Sigma xishowcaseSigma xishowcase
Sigma xishowcasejyoung11509
 
Inorganic materials 2019
Inorganic materials 2019Inorganic materials 2019
Inorganic materials 2019Chris Sonntag
 

Semelhante a Postdoc Ph D Research Fei 2002 (20)

Large-scale computational design and selection of polymers for solar cells
Large-scale computational design and selection of polymers for solar cellsLarge-scale computational design and selection of polymers for solar cells
Large-scale computational design and selection of polymers for solar cells
 
Alpha phase andy and maya
Alpha phase andy and mayaAlpha phase andy and maya
Alpha phase andy and maya
 
Transition Metals As Spectroscopic Probes for Structure and Reactivity
Transition Metals As Spectroscopic Probes for Structure and ReactivityTransition Metals As Spectroscopic Probes for Structure and Reactivity
Transition Metals As Spectroscopic Probes for Structure and Reactivity
 
160_P16CH21_2020051802575864.pdf
160_P16CH21_2020051802575864.pdf160_P16CH21_2020051802575864.pdf
160_P16CH21_2020051802575864.pdf
 
160_P16CH21_2020051802575864.pdf
160_P16CH21_2020051802575864.pdf160_P16CH21_2020051802575864.pdf
160_P16CH21_2020051802575864.pdf
 
Lanthanide shift reagents in nmr
Lanthanide shift reagents in nmrLanthanide shift reagents in nmr
Lanthanide shift reagents in nmr
 
Synthesis, Spectroscopic Studies and Antibacterial Activity of Novel Schiff B...
Synthesis, Spectroscopic Studies and Antibacterial Activity of Novel Schiff B...Synthesis, Spectroscopic Studies and Antibacterial Activity of Novel Schiff B...
Synthesis, Spectroscopic Studies and Antibacterial Activity of Novel Schiff B...
 
Mossbauer Spectroscopy Applications - detection of oxidation state by Himansh...
Mossbauer Spectroscopy Applications - detection of oxidation state by Himansh...Mossbauer Spectroscopy Applications - detection of oxidation state by Himansh...
Mossbauer Spectroscopy Applications - detection of oxidation state by Himansh...
 
Inhibition, kinetic and thermodynamic effects of new Azo derivatives on iron ...
Inhibition, kinetic and thermodynamic effects of new Azo derivatives on iron ...Inhibition, kinetic and thermodynamic effects of new Azo derivatives on iron ...
Inhibition, kinetic and thermodynamic effects of new Azo derivatives on iron ...
 
Madkour and zinhome
Madkour and zinhomeMadkour and zinhome
Madkour and zinhome
 
NMR ppt.pptx
NMR ppt.pptxNMR ppt.pptx
NMR ppt.pptx
 
V17preprint4
V17preprint4V17preprint4
V17preprint4
 
v17preprint4
v17preprint4v17preprint4
v17preprint4
 
Coordination modes of a new ligand derived from pyrazoline with cr(iii), mn(i...
Coordination modes of a new ligand derived from pyrazoline with cr(iii), mn(i...Coordination modes of a new ligand derived from pyrazoline with cr(iii), mn(i...
Coordination modes of a new ligand derived from pyrazoline with cr(iii), mn(i...
 
Sigma xishowcase
Sigma xishowcaseSigma xishowcase
Sigma xishowcase
 
Inorganic materials 2019
Inorganic materials 2019Inorganic materials 2019
Inorganic materials 2019
 
v15preprint44(1)
v15preprint44(1)v15preprint44(1)
v15preprint44(1)
 
V15preprint44(1)
V15preprint44(1)V15preprint44(1)
V15preprint44(1)
 
10.1007_s40090-015-0039-7 (1)
10.1007_s40090-015-0039-7 (1)10.1007_s40090-015-0039-7 (1)
10.1007_s40090-015-0039-7 (1)
 
10.1007_s40090-015-0039-7 (1)
10.1007_s40090-015-0039-7 (1)10.1007_s40090-015-0039-7 (1)
10.1007_s40090-015-0039-7 (1)
 

Mais de inscore

1b fe inscore sr research scientist resume 2019
1b fe inscore sr research scientist resume 20191b fe inscore sr research scientist resume 2019
1b fe inscore sr research scientist resume 2019inscore
 
Fei sun chemical presentation 070114 2c [compatibility mode]
Fei sun chemical presentation 070114 2c [compatibility mode]Fei sun chemical presentation 070114 2c [compatibility mode]
Fei sun chemical presentation 070114 2c [compatibility mode]inscore
 
Ijs bas published version
Ijs bas published versionIjs bas published version
Ijs bas published versioninscore
 
Pharmaceutics 03-00425
Pharmaceutics 03-00425Pharmaceutics 03-00425
Pharmaceutics 03-00425inscore
 
2 fei portfolio r&d cv 2a and support3a3b4a2 2015
2 fei portfolio r&d cv 2a and support3a3b4a2 20152 fei portfolio r&d cv 2a and support3a3b4a2 2015
2 fei portfolio r&d cv 2a and support3a3b4a2 2015inscore
 
1 z fei portfolio r&d short resume cv and short support 2015
1 z fei portfolio r&d short resume cv and short support 20151 z fei portfolio r&d short resume cv and short support 2015
1 z fei portfolio r&d short resume cv and short support 2015inscore
 
1 fei portfolio r&d resumes and appendix 2015
1 fei portfolio r&d resumes and appendix 20151 fei portfolio r&d resumes and appendix 2015
1 fei portfolio r&d resumes and appendix 2015inscore
 
1e fei short support appendix 2015
1e fei short support appendix 20151e fei short support appendix 2015
1e fei short support appendix 2015inscore
 
1d1 fei resume r&d sr chemist 2015
1d1 fei resume r&d sr chemist 20151d1 fei resume r&d sr chemist 2015
1d1 fei resume r&d sr chemist 2015inscore
 
1c1 fei resume r&d sr scientist 2015
1c1 fei resume r&d sr scientist 20151c1 fei resume r&d sr scientist 2015
1c1 fei resume r&d sr scientist 2015inscore
 
1b1 fei resume r&d sr manager 2015
1b1 fei resume r&d sr  manager 20151b1 fei resume r&d sr  manager 2015
1b1 fei resume r&d sr manager 2015inscore
 
1a1 fei resume r&d sr director 2015
1a1 fei resume r&d sr director 20151a1 fei resume r&d sr director 2015
1a1 fei resume r&d sr director 2015inscore
 
Nasa Nnc05 Ca90 C Final Report
Nasa Nnc05 Ca90 C Final ReportNasa Nnc05 Ca90 C Final Report
Nasa Nnc05 Ca90 C Final Reportinscore
 
Final Report Daad13 02 C 0015 Part5 App L P
Final Report Daad13 02 C 0015 Part5 App L PFinal Report Daad13 02 C 0015 Part5 App L P
Final Report Daad13 02 C 0015 Part5 App L Pinscore
 
Final Report Daad13 02 C 0015 Part5 App A F
Final Report Daad13 02 C 0015 Part5 App A FFinal Report Daad13 02 C 0015 Part5 App A F
Final Report Daad13 02 C 0015 Part5 App A Finscore
 
Final Report Daad13 02 C 0015 Part5 App G K
Final Report Daad13 02 C 0015 Part5 App G KFinal Report Daad13 02 C 0015 Part5 App G K
Final Report Daad13 02 C 0015 Part5 App G Kinscore
 
Epa Epd06084 Final Report
Epa Epd06084 Final ReportEpa Epd06084 Final Report
Epa Epd06084 Final Reportinscore
 
Pittcon 2012 Cs Fi Invited Sers Talks Drugs In Saliva
Pittcon 2012 Cs Fi Invited Sers Talks Drugs In SalivaPittcon 2012 Cs Fi Invited Sers Talks Drugs In Saliva
Pittcon 2012 Cs Fi Invited Sers Talks Drugs In Salivainscore
 
Pitt Conn 2012 Fi Cs As Invited Sers Talks Ba Assay
Pitt Conn 2012 Fi Cs As Invited Sers Talks Ba AssayPitt Conn 2012 Fi Cs As Invited Sers Talks Ba Assay
Pitt Conn 2012 Fi Cs As Invited Sers Talks Ba Assayinscore
 

Mais de inscore (20)

1b fe inscore sr research scientist resume 2019
1b fe inscore sr research scientist resume 20191b fe inscore sr research scientist resume 2019
1b fe inscore sr research scientist resume 2019
 
Fei sun chemical presentation 070114 2c [compatibility mode]
Fei sun chemical presentation 070114 2c [compatibility mode]Fei sun chemical presentation 070114 2c [compatibility mode]
Fei sun chemical presentation 070114 2c [compatibility mode]
 
Ijs bas published version
Ijs bas published versionIjs bas published version
Ijs bas published version
 
Pharmaceutics 03-00425
Pharmaceutics 03-00425Pharmaceutics 03-00425
Pharmaceutics 03-00425
 
2 fei portfolio r&d cv 2a and support3a3b4a2 2015
2 fei portfolio r&d cv 2a and support3a3b4a2 20152 fei portfolio r&d cv 2a and support3a3b4a2 2015
2 fei portfolio r&d cv 2a and support3a3b4a2 2015
 
1 z fei portfolio r&d short resume cv and short support 2015
1 z fei portfolio r&d short resume cv and short support 20151 z fei portfolio r&d short resume cv and short support 2015
1 z fei portfolio r&d short resume cv and short support 2015
 
1 fei portfolio r&d resumes and appendix 2015
1 fei portfolio r&d resumes and appendix 20151 fei portfolio r&d resumes and appendix 2015
1 fei portfolio r&d resumes and appendix 2015
 
1e fei short support appendix 2015
1e fei short support appendix 20151e fei short support appendix 2015
1e fei short support appendix 2015
 
1d1 fei resume r&d sr chemist 2015
1d1 fei resume r&d sr chemist 20151d1 fei resume r&d sr chemist 2015
1d1 fei resume r&d sr chemist 2015
 
1c1 fei resume r&d sr scientist 2015
1c1 fei resume r&d sr scientist 20151c1 fei resume r&d sr scientist 2015
1c1 fei resume r&d sr scientist 2015
 
1b1 fei resume r&d sr manager 2015
1b1 fei resume r&d sr  manager 20151b1 fei resume r&d sr  manager 2015
1b1 fei resume r&d sr manager 2015
 
1a1 fei resume r&d sr director 2015
1a1 fei resume r&d sr director 20151a1 fei resume r&d sr director 2015
1a1 fei resume r&d sr director 2015
 
Nasa Nnc05 Ca90 C Final Report
Nasa Nnc05 Ca90 C Final ReportNasa Nnc05 Ca90 C Final Report
Nasa Nnc05 Ca90 C Final Report
 
Final Report Daad13 02 C 0015 Part5 App L P
Final Report Daad13 02 C 0015 Part5 App L PFinal Report Daad13 02 C 0015 Part5 App L P
Final Report Daad13 02 C 0015 Part5 App L P
 
Final Report Daad13 02 C 0015 Part5 App A F
Final Report Daad13 02 C 0015 Part5 App A FFinal Report Daad13 02 C 0015 Part5 App A F
Final Report Daad13 02 C 0015 Part5 App A F
 
Final Report Daad13 02 C 0015 Part5 App G K
Final Report Daad13 02 C 0015 Part5 App G KFinal Report Daad13 02 C 0015 Part5 App G K
Final Report Daad13 02 C 0015 Part5 App G K
 
Epa Epd06084 Final Report
Epa Epd06084 Final ReportEpa Epd06084 Final Report
Epa Epd06084 Final Report
 
Pittcon 2012 Cs Fi Invited Sers Talks Drugs In Saliva
Pittcon 2012 Cs Fi Invited Sers Talks Drugs In SalivaPittcon 2012 Cs Fi Invited Sers Talks Drugs In Saliva
Pittcon 2012 Cs Fi Invited Sers Talks Drugs In Saliva
 
Pitt Conn 2012 Fi Cs As Invited Sers Talks Ba Assay
Pitt Conn 2012 Fi Cs As Invited Sers Talks Ba AssayPitt Conn 2012 Fi Cs As Invited Sers Talks Ba Assay
Pitt Conn 2012 Fi Cs As Invited Sers Talks Ba Assay
 
Feipnas
FeipnasFeipnas
Feipnas
 

Postdoc Ph D Research Fei 2002

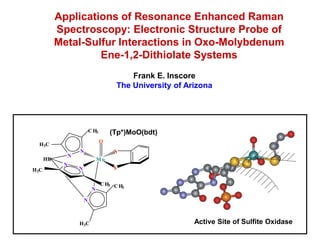
  • 1. Applications of Resonance Enhanced Raman Spectroscopy: Electronic Structure Probe of Metal-Sulfur Interactions in Oxo-Molybdenum Ene-1,2-Dithiolate Systems Frank E. Inscore The University of Arizona C H3 (Tp*)MoO(bdt) O H3C N S N HB Mo N H3C N S C H3 C H 3 N N H3C Active Site of Sulfite Oxidase
  • 2. The Raman Spectroscopic Technique General Considerations Research and Industrial Applications Structure/ Solid State/ Biological Chemistry Utility of Raman Spectroscopy Problematic: Inherent Weak Effect Problematic: Fluorescence Complications Problematic: Instrumental Limitations Development of New Techniques FT-RS/ SERS/ RERS
  • 3. Resonance Raman Spectroscopy Characterizing Structure/ Monitoring Reactivity in Catalytic Systems Chemical and Petroleum/ Energy Production Industries • Catalyst Structure and Reactivity: Surface and In Situ Studies Heterogeneous processes: Supported metal oxides (MoO/ WO) used as catalyst. Hydrodesulfurization catalyst: Removal of sulfur from petroleum feedstocks. Biological Systems • Structure/ Function In Situ Studies Protonation in Biomolecules: S-H/ S-S conversion. Mechanistic insight into Carcinogenesis: Blue/green particle in tumors; Cu-S bonding. Structural Insight in Metalloproteins.
  • 4. Overview of Presentation • Raman Applications • What we are doing? • Background • Electronic Structure • Why we are studying? • Raman Instrumentation • Resonance Raman Studies • How we will probe? • Implications for Mo Enzymes C H3 O H3C N S N HB Mo N H3C N S C H3 C H 3 N N H3C
  • 5. The Importance of Metal 1,2-Dithiolene Complexes General Considerations Why the Interest in Transition Metal-Sulfur Complexes? Industrial Applications/ Commercial Uses: Vulcanization Accelerators for Rubber Wear Additive Inhibitors in Lubricants Catalytic Inhibitors /Oxidation Catalyst Mode-Locking Additives in Nd Lasers Potential Biological Activity: Correlations with Biological Systems containing Metal to Sulfur Bonds. What Is an Ene-1,2-Dithiolate Ligand ? Four Prototypical Ene-1,2-Dithiolate Systems: -S H -S -S N -S S -S M S = -S -S -S N -S S -S H S Relevance to structure, bonding and function of Metalloenzyme active site centers
  • 6. Pyranopterin Molybdenum and Tungsten Enzymes Background and Significance 3 Mo Families based on structure and reactivity 2 W Families similar to DMSO reductase family O S O S er -O S O O Mo S S S Mo Mo S S - C ys S O H2 S S Sulfite Oxidase Xanthine Oxidase DMSO Reductase # X-ray crystallography reveals a common structural unit: Pyranopterin cofactor O S- H N S- HN H2N N N O OPO 2- H 3
  • 7. The Resonance Raman Spectroscopic Probe Structure/ Bonding in the Active Site of DMSO Reductase Single Metal Redox Center RO O (VI) • XAS [Mo(VI,V,IV)] S S M • MCD/ EPR [Mo(V)] S S (Mo-S) • Electronic Absorption (Mo=O) x • Resonance Raman Observe enhanced isotopic sensitive Mo=O and Mo-S vibrations. Parallel model studies on both relevant and simpler systems needed.
  • 8. Outstanding Issues in Pyranopterin Mo Enzyme Catalysis Primary Issue What is Structural and Functional Role of the Pyranopterin Ene-1,2- Dithiolate Unit During Course of Catalysis? Research Goal Derive fundamental understanding at molecular level, into how the unique geometric and electronic structure of these enzyme active sites contribute to their reactivity. Research Objectives Utilize available physical characterization methods to determine the geometric and electronic structure of small synthetic active site analogs. Derive key factors that define geometric/electronic structure relationships and correlate to the unique enzymatic spectroscopic features and their electronic contributions to structure-bonding/ function.
  • 9. Chemical Evolution of Mo and W Dithiolene Systems The Reductionist Approach CH3 H3C O O -1, -2 O -1 N S RO HB N S S S S N N M M M H3C S S S S S CH3 -1 N CH3 OR N S S -1,0 M H3C S S S S CH3 M S S H3C S -2 N N Mo S OO HB S S H3C N N S M S S CH 0, +1 N 3CH3 N S M S -2 H3C OO CH3 S SR O M H3C 0, -1 S Y N N S HB N Mo O H3C N N S SS 0, -1, -2 -1 S SR S S M CH3 M S Y N CH3 S S N H3C
  • 10. Minimal Structural Models/ Effective Spectroscopic Models Simple model; Mo coordinated by Ene-1,2-Dithiolate and terminal Oxo. Isolated Oxo-Mo-Dithiolate Center; Controlled six coordinate environment. Possess Mo(V) paramagnetic centers; Amenable to EPR/ MCD probes. C H3 E H3C N N S (S-S) HB M N S H3 C N Cl -S -S C H3 - S -S N CH C H 3 N 3 -S -S -S -S N N (Tp*)ME(S-S) Cl H3C Probe fundamental properties of Oxo-Mo mono-ene1,2-dithiolate complexes: Metal (M = Mo, W), axial (E = O, S, NO) and dithiolate (S-S) coordination effects.
  • 11.
  • 12. MCD and Electronic Absorption Spectroscopy Low Temperature Solid-State (PDMSO Mull) Studies 0.8 1000 Absorption (5K) MCD (5K /7T) 0.7 0.6 500 MCD Intensity (mdeg) 0.5 Absorbance 0.4 0 0.3 0.2 1 2 -500 (3, 4) 5 6 7 0.1 0 -1000 8000 12000 16000 20000 24000 28000 32000 Energy (wavenumbers) Complimentary selection rules: resolve electronic transitions in spectra
  • 13. Band Assignments from Combined Spectroscopic Approach y a'z2 Solution Electronic Absorption (DCE) y a''x2-y2 4 6400 y x'z y a'y'z a'' 7 3 6 7 5600 4800 y a'xy 1 2 5 Epsilon (M cm ) -1 4000 6 y a''op y a'op -1 3200 2400 y a'ip 5 1600 y a''ip 800 1 2 (3, 4) a'xy + a'ip a'xy + a'op a'yz + a'op O 0 M S 8000 12000 16000 20000 24000 28000 32000 = 90 0 Energy (wavenumbers) O M S > 90 0
  • 14. Resonance Raman Scattering Enhancement of the Raman signal Sensitive and selective probe of structure/ bonding Vibrational frequencies: sensitive to inner coordination environment. Intensitiy: selective enhancement associated with absorbing metal center. Resonance FC - A Term Normal Raman Rayleigh Raman O HT - B Term E’ E1 o o M S O S IR ' M S  E0 S Selectivity based on resonant electronic transition and excited state distortion. Intensity depends on energy and intensity of electronic absorption band. Enhancement result of coupling with electronic excited state.
  • 15. Raman Experimental Instrumentation and Techniques Design and Methodology Goal: Obtain Low-frequency vibrational information regarding M-S bonding. Computer System Controller Interface Titanium Sapphire Laser Argon Ion Laser CCD Sample Krypton Ion Laser Illumination/ Collection Pre Monochromator Optics SPEX 1877 SPEX 1405 Triplemate
  • 16. Collection Geometry Computer System Controller Interface Argon Ion Laser 90 degree geometry CCD Sample Illumination/ Collection Optics SPEX 1877 135 degree back scattering geometry Triplemate
  • 17. The Resonance Raman Experiment
  • 18. Laser Enhanced Raman Spectroscopy
  • 19.
  • 20. Sample Illumination and Collection Optics
  • 21. Sample Handling, Detection and Dispersal System Samples Problematic: Photo Decomposition/ Thermal Degradation?
  • 22. Vibrational Raman Spectroscopy C H3 (Tp*)MoO(bdt) in NaCl/ Na2SO4 O 8500 H 3C 140K 528.7 nm ~40 mW N S 8000 N HB Mo 7500 3 N H3C N S 7000 1 C H3 C H 6500 6 Raman Intensity (cps) N 3 6000 N 5500 300 400 500 600 700 800 900 1000 1100 (Tp*)MoO(bdt) in Benzene H 3C 2000 293K 514.5 nm ~75 mW 1900 3 vibrational bands observed 1800 1700 1600  6 = 362 cm-1 1 = 393 cm-1  3 = 932 cm-1 1500 3 6 1 1400 1300 300 400 500 600 700 800 900 1000 1100 Raman-shift (wavenumbers) Identify normal modes coupled to electronic transitions
  • 23. Solution Raman Depolarization Studies 2000 Depolarization Ratio (Tp*)MoO(bdt) in Benzene 1900 293K 496.5 nm ~75 mW 1800  = I/ I  1700 Parallel polarization 0   3/4 1600 I    ¾ 1500 3 1400 6 1 Raman Intensity (cps) 1300 300 400 500 600 700 800 900 1000 1100 Totally symmetric (polarized) Non-totally symmetric (depolarized) 2000 1900 1800 Perpendicular polarization Ratio indicates 3 modes are totally symmetric 1700 6(A = 362 cm-1 ') 1600 I 1500 1(A = 393 cm-1 ') 1400 6 1 3 3(A = 932 cm-1 ') 1300 300 400 500 600 700 800 900 1000 1100 Raman-shift (wavenumbers)
  • 24. Vibrational Analysis (Tp*)MoO(bdt) in Benzene 2000 CH3 O H3C O z z S NN S 1900 Mo N N Mo S HB S Raman Intensity (cps) H3C 1800 O O CH3 CH N 3 1700 N M y  (zy) M y B N N S S 1600 S x S 362 cm-1 H C 3 932 cm-1 x N -1 1500  ( A' ) 393 cm  ( A' ) 6 3  ( A' ) 1 1400 O O O 1300 300 400 500 600 700 800 900 1000 1100 M M M -1 S S S S S S Raman-shift (cm ) 1 ( A' ) 2 ( A'' ) 3 ( A' ) Key Points: 3 bands observed – polarized (A’ symmetry) O O O M M M Intensity enhancement patterns consistent S S S S S S With M-S/ M=O vibrational assignments 4 ( A' ) 5 ( A'' )  ( A' ) 6 Resonance Raman spectroscopy probes: Differences in bonding between ground and excited states via distortions along specific normal modes.
  • 25. Solid-State Excitation Profiles Key Points: Observe large differential enhancement of Mo=O Transitions probed are orthogonal (in-plane vs out-of-plane) O (Tp*)MoO(bdt): 8K PDMSO mull EA; 100K RR NaCl/ Na2SO4 M S S 3( A' ) Sop  Mo dxz,yz O Sip  Mo dxy S M S 1( A' ) O M S S 6( A' ) Conclusions: Sip  Mo dxy CT probes covalent contributions to ground-state S Mo CT probes electronic contributions to redox potentials
  • 26. Implications for Catalytic Reactivity in Enzymes Lowest energy (intense) CT must be Sip  Mo dxy This CT transition probes covalency contributions to ET pathway. M=O aligns redox orbital for facile ET via unique 3-center 2-electron bond. O SO32- SO42- O O OH 2 S S yxya' Mo (VI) Mo (IV) S S cys S S cys xya' H+, e- H2O S-Moxy 3-center H+, e- pseudo- antibonding O OH S-Moxy 3-center S pseudo- bonding Mo (V) a' ip S S cys Criteria for efficient ET yipa' Reason Nature has chosen ene-1,2-dithiolate and M=O groups Good M-L overlap/ Minimize ROE
  • 27. Conclusions Resonance Raman Important Probe of Ground and Excited State Structure State of the Art Equipment Necessary for probing M-S Bonding. Contributions of M-L Bonding to Electronic Structure Elucidated by RR Especially when Combined with other Spectroscopic Techniques. RR Spectroscopy Important Tool for Characterizing Enzyme Active Sites when Interpreted within Context of Well-Defined Small Molecular Models. Protocols Developed can be Applied to more Complicated Systems.
  • 28. Acknowledgements and Funding * HeI Prof. John H. Enemark HOMO Pseudo anti-bonding Mo dxy h = 579 nm Enemark Research Group HOMO -1&-2 HeII Sip University of Arizona Pseudo bonding * HOMO-3 &-4 * * 10.5 10 9.5 9 8.5 8 7.5 7 6.5 HOMO-5 Ionization Energy (eV) Prof. Martin L. Kirk National Institutes of Health National Science Foundation Kirk Research Group University of New Mexico Petroleum Research Fund Sandia National Laboratories C16 O C14 C15 S2 C4 C2 C13 MO C17 C3 C24 C26 S1 C5 N21 C1 C6 B N31 C23 N32 C36 (Tp*)M oO(qdt) in Benze ne at 514.5nm C27 C33 C37 C34 4000 (Tp*)MoO(bdt) 3800 Raman Intensity (cps) 3600 3400 (Tp*)WO(bdt) 3200 3000 10 9.5 9 8.5 8 7.5 7 6.5 6 400 600 800 1000 1200 1400 Ionization Energy (eV) -1 Ram an S h ift (cm)