
Recomendados
Recomendados
Mais conteúdo relacionado
Semelhante a 2017 San Jose, CA Zero-Based Budgeting Results
Semelhante a 2017 San Jose, CA Zero-Based Budgeting Results (20)
Mais de Luke Hohmann
Mais de Luke Hohmann (20)
Último
Último (20)
2017 San Jose, CA Zero-Based Budgeting Results
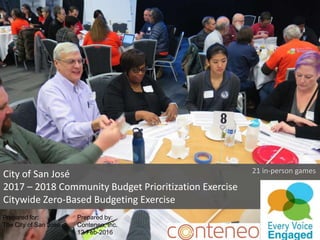
- 1. City of San José 2017 – 2018 Community Budget Prioritization Exercise Citywide Zero-Based Budgeting Exercise Prepared for: The City of San José Prepared by: Conteneo, Inc. 12-Feb-2017 21 in-person games
- 2. Event Overview • 28-Jan-2017 – San José Convention Center • 83 residents organized into 15 forums • San José provided subject matter experts • Conteneo provided volunteer Certified Collaboration Architects Facilitators and Observers • Two engagements: • Zero-Based Budgeting • Grow Our Community
- 3. Engagements 3 Zero-Based Budgeting • 32 Neighborhood Service programs representing $42,050,000 in spending from 2016-2017 • Residents collaborate to determine funding for 2017-2018 • Residents allowed to introduce new programs Grow Our Community • Residents were given trees representing their districts and asked to identify “What would make your community great”?
- 5. 32 Programs Were Tested 5 Item # Service/ Program 2016-2017 Budget 1 Illegal Dumping $900,000 2 Free Junk Pick-Up $2,500,000 3 Homeless Response Team / Encampment Abatement $2,000,000 4 Business District Beautification $50,000 5 San Jose Creates and Connects $250,000 6 Plaza Activation and Maintenance $150,000 7 Code Enforcement: Abatement Officers (General Code Enforcement) $2,300,000 8 Code Enforcement: Civil Action Attorneys $800,000 9 Neighborhood Clean Ups - City Sponsored $850,000 10 Community Action & Pride grants $100,000 11 Anti-Graffiti $1,500,000 12 Anti-Litter $300,000 13 Park Volunteer Program (Adopt-A-Park/Adopt-A-Trail) $400,000 14 Park Activation $750,000 15 Neighborhood Park Maintenance $10,300,000 16 Regional Park Maintenance $3,350,000 Item # Service/ Program 2016-2017 Budget 17 Sports Field Program $250,000 18 Parks Water $4,900,000 19 Parks Restroom / Custodial Services $850,000 20 "Pocket Park" Maintenance $600,000 21 Tree Maintenance $400,000 22 Adopt-A-Median $0 23 Adopt-A-Street $0 24 Sidewalk Repairs $450,000 25 Streetlight Installation/ Additions $0 26 Streetlight Replacement $2,200,000 27 LED Streetlight Conversions $1,050,000 28 San Jose Gateways $0 29 Weed Abatement $400,000 30 Streetscapes/Right-of-Way and Median Maintenance $2,900,000 31 Urban Forest $400,000 32 Urban Forest: Tree Trimming $1,150,000
- 6. Each table was given the chance to add two ideas to the list of projects. Write-In candidates do NOT increase the total budget. Instead, residents must fund a write-in candidate like any other project from the existing budget. Optional Write-In Candidates Name Description Measure of Success Required Resources Additional Information Investment
- 7. Counting Decreased/Increased Programs The final funding of each program was grouped and counted based on the following buckets: Nearly all programs had some increases and some decreases. We used the total number of increases or decreases in funding to determine our final sorting of items. 7 Significant Decrease 0% to 74% Decrease 75% to 98% Fund As-Is 98% to 1.02% Increase 1.02% to 30% Significant Increase >30%
- 8. Programs Decreased/Increased 8 Decrease More tables voted to decrease these programs Fund As-Is Tables roughly equally increased/decreased these programs Increase More tables voted to increase these programs Programs are listed in decreasing order in each group Green items were zero. 29 Weed Abatement 18 Parks Water 30 Streetscapes/Right-of-Way and Median Maintenance 32 Urban Forest: Tree Trimming 26 Streetlight Replacement 15 Neighborhood Park Maintenance 16 Regional Park Maintenance 28 San Jose Gateways 23 Adopt-A-Street 22 Adopt-A-Median 25 Streetlight Installation/ Additions 3 Homeless Response Team / Encampment Abatement 1 Illegal Dumping 12 Anti-Litter 7 Code Enforcement: Abatement Officers (General Code Enforcement) 4 Business District Beautification 27 LED Streetlight Conversions 8 Code Enforcement: Civil Action Attorneys 10 Community Action & Pride grants 21 Tree Maintenance 20 "Pocket Park" Maintenance 2 Free Junk Pick-Up 13 Park Volunteer Program (Adopt-A-Park/Adopt-A-Trail) 14 Park Activation 6 Plaza Activation and Maintenance 17 Sports Field Program 5 San Jose Creates and Connects 24 Sidewalk Repairs 11 Anti-Graffiti 9 Neighborhood Clean Ups - City Sponsored
- 9. Resident Proposed Programs 9 Homeless: 1 program, $3M. Most programs were associated with trash/beautificatio n. One program for increasing allocation to police. 1-1: Job Placement and Assistance for Homeless $3,000,000 2-1: Creative “Open Space” for Graffiti $150,000 2-2: Small Biz Dump Credits $300,000 2-3: Small business Junk/Trash Credits $500,000 3-1: Increase Fire & Police Dispatcher $1,000,000 3-2: Landscape Neglected Properties $5,000,000 5-1: Historic Prevention $250,000 5-1: Pilot Streetlights $500,000 6-1: Community Center $200,000 6-2: Sanctuary City $0 7-1: Sidewalk repair $1,000,000 7-2: Streamline Trash/Blight Programs (#1, #2, #12) $0 10-1: <Name of program is unreadable> $1,250,000 11-1: Educate Safety for Pedestrians/Bicycle $0 14-1: Rain Day Fund $800,000 Note: Not every program was funded!
- 10. Grow Our Community 352 Unique Ideas
- 11. Count of Results by District 11 1 2 3 4 5 7 8 9 106a 6b Grand Total Animals 2 2 Beautification 1 1 1 1 4 Clean Up 1 5 3 3 3 1 1 3 3 2 25 Code Enforcement 1 1 1 1 3 2 10 3 22 Community Action 2 2 5 14 15 25 12 6 10 91 Custodial Services 1 1 Diversity 2 2 Education 3 1 1 2 2 2 11 Homeless Response Team 2 4 2 1 3 12 Housing 6 6 Other 3 6 7 6 2 2 4 2 32 Parking 5 1 1 1 8 Parks 4 1 3 2 3 1 1 2 9 2 28 Plaza Activation & Maintenance 2 1 4 7 Public Action 3 3 Public Safety 1 1 1 1 5 1 1 4 15 Public Transportation 1 1 2 San Jose Creates & Connects 3 2 1 6 4 16 Sidewalk 1 3 4 Sports Field Programs 2 1 3 Street 2 2 Street Lights 1 2 1 4 Streetlight Installation 1 1 Streets 3 3 3 4 4 1 7 25 Traffic 1 1 2 4 Transportation 1 3 1 5 10 Tree Maintenance 1 1 3 1 1 4 11 Urban Forest 1 1 Grand Total 25 26 34 23 33 25 48 31 27 46 34 352
- 13. Litter / Dumping / Junk Are Top Concerns Facilitators reported the most active conversations concerned litter, dumping and junk. Residents suggested program consolidation and streamlining among (potentially disparate) departments. 13
- 14. Safety is a Significant Concern Residents tended to invest in programs perceived to address safety directly (such as improved sidewalk repairs) or indirectly (such as the keeping parks healthy). Notably, street lighting funding was significantly reduced and the excess funds were used to increase funding in several other areas. 14
- 15. Homelessness Was Uneven In prior years homelessness was perceived as a broad issue across many tables. In this session only a few tables had passionate or significant discussions regarding homelessness. One table funded a significant homeless write-in candidate. 15
- 16. Key Results • There is insufficient data to recommend the elimination of any program. • All three programs with $0 in funding experienced broadly supported significant funding recommendations. • All three “small programs” ($100K) experienced an average increase in funding. 16
- 17. Event Team Retrospective & Resident Suggestions for Improving the Process
- 18. What Worked Well: Location & Diversity 18 Diversity Residents were diverse, representing different parts of the city and different experiences. Location The Convention Center was excellent! It was the best space yet for the event.
- 19. What Worked Well • The City provided content several days in advance of the event! • Subject Matter Experts continue to provide valuable insight. • Online spreadsheets for tracking bids • Physical tracking boards and trees 19
- 20. Residents Suggestions for Improvement • Reminders of the event via email & text messages • Reduce the number of projects 20
- 22. On behalf of our global team of Certified Collaboration Architects, Thank You. Luke Hohmann Founder and CEO Conteneo, Inc. www.conteneo.co www.everyvoiceengaged.org