Economic Case for Smaller States

As forces favouring a larger number of smaller states gather momentum, the question of whether they indeed perform better needs to be answered empirically. We focus on economic growth, and find that there is some evidence that growth, post reorganisation into smaller states, is higher. However, in each of the cases of past reorganisations exogenous factors have played an important role in enabling (or disabling) higher growth. At the time of independence in 1947, India chose to be a federal state, with significant power to the state governments in response to the diversity in socio-economic conditions across the country. Over the last 60 years, the number of states and their boundaries has changed frequently and India now has 35 states and union territories, with strident demands for more still coming in. While the first major reorganisation of states was done in 1956 on linguistic lines, the economic rationale for the existence of a state was extensively debated then. However, in recent times, this strand of thought has had little analysis, despite the creation of new states since the sixties. This paper therefore looks at the following issues: is there an economic case for smaller states? Or alternatively, would the states perform better after they break up from into smaller states? The motivation for this paper comes from the new states of this decade, which have left their parent states behind in growth rates and governance initiatives. This paper does not aim to find the ‘correct’ size of a state, however it makes the point that there are two countervailing forces – one, smaller states may do better as administration can be more responsive to local needs and regional differences combined with greater homogeneity. And two, smaller states have access to lesser human capital and civil society institutions and therefore might be susceptible to the problem of poorer institutions and susceptible to ‘take-over’ by non-desirable forces. This paper also focuses only on economic growth, not on other socio-economic parameters. However, since most socio-economic factors that are used to measure progress are highly correlated with economic growth, arguably, economic growth should be one of the most important parameters to look at. That admittedly does not imply that growth is the only parameter to study. Section II: Rationale behind reorganisation of states At the time of independence, India had more than 500 states, most of which were extremely small, unviable to function as independent economic entities. By 1950, these states were organised into 28 units, by merging tiny states into larger entities. For instance, in 1948, 30 princely states occupying a combined territory of 27,000 sq km came together to form Himachal Pradesh. States were multi-lingual, raising severe administrative and social issues. The initial demarcation of state boundaries was therefore contested, with demands for reorganisation on linguistic grounds. There was intense debate and though the State Reorganisation Commission set up in 1953 accepted the rationale of language as a basis of state composition, it also went into the criterion of size and resources in different regions while forming the states. The case of Telangana and Andhra illustrates these issues best (see Box).

Recomendados
Mais conteúdo relacionado
Semelhante a Economic Case for Smaller States
Semelhante a Economic Case for Smaller States (20)
Mais de Indicus Analytics Private Limited
Mais de Indicus Analytics Private Limited (20)
Último
Último (20)
Economic Case for Smaller States
- 1. Small States - Large States♣ Sumita Kale Laveesh Bhandari Indicus Analytics Version: 17 December 2009 Section I: Introduction As forces favouring a larger number of smaller states gather momentum, the question of whether they indeed perform better needs to be answered empirically. We focus on economic growth, and find that there is some evidence that growth, post reorganisation into smaller states, is higher. However, in each of the cases of past reorganisations exogenous factors have played an important role in enabling (or disabling) higher growth. At the time of independence in 1947, India chose to be a federal state, with significant power to the state governments in response to the diversity in socio-economic conditions across the country. Over the last 60 years, the number of states and their boundaries has changed frequently and India now has 35 states and union territories, with strident demands for more still coming in. While the first major reorganisation of states was done in 1956 on linguistic lines, the economic rationale for the existence of a state was extensively debated then. However, in recent times, this strand of thought has had little analysis, despite the creation of new states since the sixties. This paper therefore looks at the following issues: is there an economic case for smaller states? Or alternatively, would the states perform better after they break up from into smaller states? The motivation for this paper comes from the new states of this decade, which have left their parent states behind in growth rates and governance initiatives. This paper does not aim to find the ‘correct’ size of a state, however it makes the point that there are two countervailing forces – one, smaller states may do better as administration can be more responsive to local needs and regional differences combined with greater homogeneity. And two, smaller states have access to lesser human capital and civil society institutions and therefore might be susceptible to the problem of poorer institutions and susceptible to ‘take- over’ by non-desirable forces. This paper also focuses only on economic growth, not on other socio-economic parameters. However, since most socio-economic factors that are used to measure progress are highly correlated with economic growth, arguably, economic growth should be one of the most important parameters to look at. That admittedly does not imply that growth is the only parameter to study. . Both authors work with Indicus Analytics and can be contacted at sumita@indicus.net and laveesh@indicus.net. This was initially a part of a larger piece of work that has been cannibalized in view of the recent political developments. We accept all errors and would welcome comments. The underlying data sheets used for the analysis can be accessed by those who are interested. We would like to thank Meenakshi Chakraborty for her research assistance. Kale and Bhandari, mimeo. Indicus Analytics, December 2009 1
- 2. Section II: Rationale behind reorganisation of states At the time of independence, India had more than 500 states, most of which were extremely small, unviable to function as independent economic entities. By 1950, these states were organised into 28 units, by merging tiny states into larger entities. For instance, in 1948, 30 princely states occupying a combined territory of 27,000 sq km came together to form Himachal Pradesh. States were multi-lingual, raising severe administrative and social issues. The initial demarcation of state boundaries was therefore contested, with demands for reorganisation on linguistic grounds. There was intense debate and though the State Reorganisation Commission set up in 1953 accepted the rationale of language as a basis of state composition, it also went into the criterion of size and resources in different regions while forming the states. The case of Telangana and Andhra illustrates these issues best (see Box). Box 1: History of Telangana and Andhra Andhra was the first state to be delineated on a purely linguistic basis in 1953 when the 16 northern Telugu speaking districts were separated from Tamil-speaking parts of Madras State. With the formation of the State Reorganisation Commission the same year, the question arose whether to merge Telangana, the Telugu speaking districts of Hyderabad state, with this state of Andhra to form a new state on purely linguistic grounds. Interestingly, the Commission merged the two entities giving the following reasoning on economic, and not linguistic, grounds: The advantages of a larger Andhra State were that it would bring into existence a State of about 32 million population, with a considerable hinterland, with large water and power resources, adequate mineral wealth and valuable raw materials. The ‘vexing problem’ of finding a permanent capital for Andhra would be resolved by the twin cities of Hyderabad and Secunderabad, which lay in Hyderabad state. River resources would be better managed, as the development of the Krishna and Godavari rivers would be brought under unified control. Telangana usually had sizeable food supply deficit during drought years, while Andhra normally had surplus. Similarly, the existing State of Andhra had no coal, but would be able to get its supplies from Singareni in Telangana. Human capital was greater in Andhra state, while Telangana was revenue rich; there was therefore complementarity of resources. Though Telangana pressed for a separate existence, arguing that it formed a stable and viable unit by itself, the Commission recommended a merger, with a caveat. “Andhra and Telangana have common interests and we hope these interests will tend to bring the people closer to each other. If, however, our hopes for the development of the environment and conditions congenial to the unification of the two areas do not materialise and if public sentiment in Telangana crystallises itself against the unification of the two states, Telangana will have to continue as a separate unit.” The Commission therefore tried to balance the more compelling need for economically disadvantaged Andhra to merge with Telangana with the desire of the Telangana people to maintain separate states despite a common language. Kale and Bhandari, mimeo. Indicus Analytics, December 2009 2
- 3. With the State Reorganisation Act 1956, linguistic basis became the benchmark for state creation. But not without severe criticism. Dr. Ambedkar’s note ‘Thoughts on Linguistic States’ begins by pointing out “The Commission evidently thinks that the size of a state is a matter of no consequence and that the equality in the size of the status constituting a federation is a matter of no moment. This is the first and the most terrible error cost which the commission has committed. If not rectified in time, it will Indeed be a great deal.’ The disparity in population sizes was a ‘fantastic’ result, bound to create huge costs for the nation. Ambedkar’s opposition to the Commission’s recommendations stemmed from the imbalance of political power in the country - the large states in the north and balkanisation of the south would pit the two regions of the country against each other. The solution he offered used the size of the state and administrative effectiveness for making smaller states in the north: dividing the three large states – Uttar Pradesh, Bihar and Madhya Pradesh and using the rule that ‘a population of approximately two crores which should be regarded as the standard size of population for a State to administer effectively.’ As Ambedkar clarified, one language one state should be the rule, but people with the same language can divide themselves into many states – this promotes more uniform balance of power within the country, satisfies social needs and most importantly, creates units that can be administered with ease, leading to better growth performance for the nation. Figure 1: Proposed New States under the States Reorganisation Act 1956 Name of the State Area (Sq. Miles) Population (Crores) Language Uttar Pradesh 113,410 6.32 Hindi Bombay 151,360 4.02 Mixed Bihar 66,520 3.82 Hindi Madras 50,170 3.00 Tamil West Bengal 34,590 2.65 Bengali Madhya Pradesh 171,200 2.61 Hindi Andhra 64,950 2.09 Telugu Karnatak 72,730 1.90 Kanarese Punjab 58,140 1.72 Punjabi Rajasthan 132,300 1.60 Rajasthani Orissa 60,140 1.46 Oria Kerala 14,980 1.36 Malyalam Hyderabad 45,300 1.13 Telugu Assam 89,040 0.97 Assamese Vidarbha 36,880 0.76 Marathi Jammu and Kashmir 92,780 0.14 Kashmiri Source: BR Ambedkar ‘Thoughts on Linguistic States’, 1956 Kale and Bhandari, mimeo. Indicus Analytics, December 2009 3
- 4. While he used this rule to call for the division of Uttar Pradesh, Bihar and Madhya Pradesh, he went into greater detail analysing his home state Maharashtra with 3.3 crore Marathi- speaking population and an area spanning 1.74 lakh square miles – it ‘ is a vast area and it is impossible to have efficient administration by a single State.’ According to his analysis, economic, industrial, educational and social inequalities in the regions of Maharashtra make for a clear division of the state into four parts – Bombay, Western (Konkan), Central (Marathwada) and Eastern (Vidarbha). Ambedkar’s recommendations with respect to these four larger states of course did not materialise in the early years, though the number of states and their boundaries changed through the sixties and seventies. While the creation of Jharkhand, Chhattisgarh and Uttarakhand in 2000 showed that the rationale for smaller states could not be suppressed, there are still, and growing, demands to break up Uttar Pradesh and Maharashtra.1 ‘Small’ and ‘big’ are relative terms and while Ambedkar put two crores as a viable population size for administration, with India’s current population, this would now translate into more than fifty states for the Indian Union, a political impossibility. Is there a viable middle path? One suggestion is to use some combination of the 77 agro-climatic regions as an administrative unit within the state, which could prove more efficient than the current system. Another could be to ensure that a combination of criteria - minimum population of (say 5 crores) and with some economic-cultural-social homegeniety (as reflected in agro- climatic regions) – be used. Indeed there can be many different criteria that can be evolved, each leading to a different set of new states with differing sizes. But what has been the empirical evidence on the states that have been divided in the past? The next section briefly reviews that element. Section III: Economic Growth and State Formation Empiricism demands the following (a) a sufficiently long enough time should have elapsed after the reorganisation, (b) a number of cases of such reorganisation should have occurred, (c) measures across a range of economic, socio-economic and governance parameters need to be available, and (d) such measures need to be available both before and after the reorganisation at the sub-state level. Indeed, none of these conditions are fully met in the case of India. However, all of these conditions are met partially to facilitate some indicative analysis. First, consider the criteria of major cases of state reorganisation. Post independence, the organization of states between the period 1947 and 1950 occurred under Sardar Patel. At the time hundreds of small princely states were very rapidly integrated into 28 units. The 1 Mayawati’s support for the dismemberment of UP into Poorvanchal (Eastern UP), Harit Pradesh or Pashchimanchal (Western UP), and Bundelkhand (Southern UP) can be traced to Ambedkar’s strong views on the matter. Kale and Bhandari, mimeo. Indicus Analytics, December 2009 4
- 5. objective, at the time, was to ensure rapid integration of otherwise diverse states into the Indian Union. It was well recognized that this was not a long term solution and a more sustainable solution was essential. This resulted in the formation of the State Reorganisation Commission in 1953, which gave its well known language based states’ recommendations in 1956.2 Since the mid-sixties,3 three cases of major state reorganisations have occurred. 1966: Haryana was carved out of Punjab and some districts went to Himachal Pradesh 1971: Arunachal Pradesh, Meghalaya and Mizoram were separated from the state of Assam 2000: Uttaranchal (re-named Uttarakhand in 2007) created from Uttar Pradesh, Jharkhand from Bihar and Chhattisgarh from Madhya Pradesh There was also the separation of the UT – Goa, Daman and Diu into the state of Goa and the UT of Daman and Diu. Thus we can at-best have three years or five cases of reorganisations. The first criterion of a significant number of cases is therefore met only partially. Second, consider the time period. Apart from the cases of Punjab and Assam, less than a decade has elapsed after the reorganisation of UP, MP and Bihar into six smaller units. But the full benefits and costs of state-level reorganisations are likely to take many years to play out. Economic policies, administrative systems, human capital creation etc., take many years to re-orient and another few years to have a significant impact. Moreover, data is also available with some gap. Having said, that ten years is not entirely an insignificant time period, and some insights can be obtained about the performance of these states as well. Third and fourth, consider the availability of the relevant measures at the sub-state level for the period before and after the reorganisation. And here as well the picture is not entirely sparse. The various surveys of the NSSO have identifiers that enable the researcher if she so desires to estimate a range of socio-economic conditions over time. For the Punjab and Assam cases, this may be difficult as the older years data do not have large enough sample sizes. But post 1980s the data are of decent enough depth and quality to enable measuring socio-economic performance of various regions or sub-states. Moreover, the CSO has also released some data on state level NDP for the six new states created in 2000. It is not clear how, but state level NDP has been estimated for all the six entities (spanning the older UP, MP and Bihar) from 1993-94 onwards - about 6 years before these states came into existence. Overall, therefore, we have some evidence that can better help understand the performance of these states, pre- and post-reorganisation. We focus on only one parameter, economic growth as measured by the NSDP or net state domestic product. We seek, as much as data permits, to answer four questions: 2 Language was the predominant criteria for the State Reorganisation Commission, but not the only one – economy, population, synergies between different regions, all played some role. 3 The 1960 Bombay Reorganisation Act that created the states of Maharashtra and Gujarat have not been included in our analysis due to paucity of data from the pre-reorganisation period. Our analysis therefore begins from the mid-sixties. Kale and Bhandari, mimeo. Indicus Analytics, December 2009 5
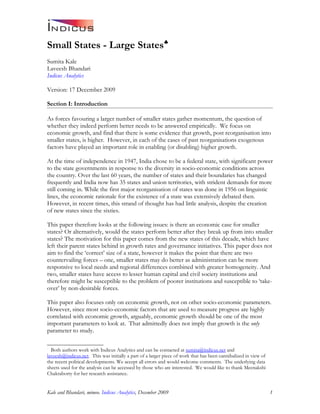
- 6. • Do states grow faster after they break away from larger states? • Do the erstwhile larger states grow faster after the smaller unit has broken off? • Does the overall entity grow faster after the reorganisation? • How does this state-level growth compare with the rest of the country pre- and post- reorganisation? Data: A brief Ideally, all instances of major reorganisation should be examined. However, there are severe data limitations; state income series published by the CSO begin only from 1960-61 and have missing values for new states in early years. For instance, Meghalaya and Mizoram series begin in 1980-81, while constant prices are not available for Mizoram till 1999-00. Himachal’s reorganisation occurred at the district level, and district level series are not available, Haryana’s data before the reorganisation is also not available, etc. Analysis is therefore conducted on a case by case basis with the most appropriate data points available, and there are important qualifiers in each of these.4 Punjab, Haryana and Himachal Pradesh5 Since separate estimates of the constituent states are not available for the period prior to reorganisation, the available state incomes of Himachal, Haryana and Punjab (before and after its reorganisation) were combined to create a single entity named Greater Punjab that could be comparable across time. Trend growth ten years, before and after 1966, was estimated using the GSDP series created for the larger state (named as mentioned, Greater Punjab and comprising of Punjab, Haryana and Himachal).6 The table and graph below show that indeed, the Greater Punjab region saw much more rapid growth after the reorganisation than before. Moreover, though the available data do not allow for a state-wise comparison we can comfortably argue that all three states of Himachal, Punjab and Haryana have not performed worse than the national average in terms of economic growth after their reorganisation into smaller independent entities. 4 Our data-set can be accessed as a separate MS Excel file. 5 For Punjab, Haryana and Himachal Pradesh, data is available to some extent from the Punjab and Himachal Pradesh Statistical Abstracts from 1950-51. However, there are missing values in the series, which were intrapolated using other sources e.g Himachal Pradesh series for 1960s was created using the 3% growth rate for the period 1961-1974 given by the Planning Department, Government of Himachal Pradesh. 6 Trend growth is less susceptible to the end-point problem, and is estimated using the logest command in MS Excel. Kale and Bhandari, mimeo. Indicus Analytics, December 2009 6
- 7. 6 Figure 2: Growth performance prior and post reorganisation 5 4 Percent 3 2 1 0 Trend grow th in 10 years period prior to Trend grow th in 10 years post reorganisation reorganisation Source: CSO Punjab, Haryana and Himachal Pradesh India Figure 2b: Growth after Reorganisation 60,000,000 Punjab, Haryana and Himachal 4,500,000 4,000,000 50,000,000 3,500,000 40,000,000 3,000,000 2,500,000 30,000,000 2,000,000 20,000,000 1,500,000 1,000,000 10,000,000 500,000 0 0 4 5 5 6 8 9 3 4 7 8 8 9 9 0 1- 2 2 3 3 4 7 8 9 0 1- 2 2 3 4 5 5 6 6 7 6 7 0 1 0 1 195 - 5 196 - 6 196 - 6 196 - 6 195 - 5 195 - 5 195 - 6 196 - 6 196 6 196 - 6 196 - 6 196 - 6 196 - 6 197 7 197 - 7 196 - 7 197 - 7 197 - 7 197 - 7 197 - 7 India NDP (1999-00 prices) Greater Punjab NSDP (1999-00 prices) Source: Author estiates using CSO data Since the reorganisation also broadly coincided with the Green Revolution in the states of Punjab and Haryana, it could be argued that the single example of the success of Punjab should be ascribed to the Green Revolution and not to the reorganisation into smaller states. Kale and Bhandari, mimeo. Indicus Analytics, December 2009 7
- 8. But that would be fallacious. The success of the Green Revolution cannot be treated as an exogenous shock. Rather it could be quite convincingly argued that a smaller, more homogenous Punjab, could better work with the central government in ensuring the success of the Green Revolution – something that a state like UP could not manage.7 In other words, the smaller state of Punjab was better able to focus its efforts towards a single objective of ensuring rapid increase in agriculture productivity. We do however admit that there is a counter-argument - a Greater Punjab may have been better able to spread the benefits of the Green Revolution. That is, the time taken for the Green Revolution to spread through Haryana could have been lower had it remained a part of the Greater Punjab. It would generally be very difficult to obtain unambiguous empirical evidence supporting or opposing the creation of smaller states because of such counterfactuals. But Punjab’s story is not the only one. Assam What we call ‘Greater’ Assam was reorganized into Assam, Arunachal Pradesh, Meghalaya and Mizoram in 1971. For most of the smaller states, data are not available for the years pre, or immediately post, reorganisation – Meghalaya and Mizoram data begin in 1980-81, Mizoram income series at constant prices begins only from 1999-00. We therefore are constrained to use only the state that we call new Assam for the analysis.8 Figure 3: Comparison of economic growth – Assam and India Time Period Assam India Pre-reorganisation trend growth 1961-62 to 1970-71 3.8% 3.4% Post Reorganisation trend growth 1971-72 to 1980-81 2.7% 3.5% Post Reorganisation trend growth 1971-72 to 1985-86 4.0% 3.8% Source: Author estimates of annualized growth rates using CSO data As the figures show, there is some cause to believe that though Assam may not have gained post its reorganisation, it was not inordinately harmed from the perspective of economic growth. Note that Assam has suffered inordinately due to various law and order problems throughout the seventies, eighties and even later. These have affected its growth 7 The Green Revolution in Uttar Pradesh was and has remained restricted to the western districts and is not sufficient to yield higher growth rates for the state as a whole. Again, if details of the district incomes of the state had been available for these years, it would have made for more illuminating analysis. 8 And here as well there is some amount of ambiguity of what the data covers. Assam NSDP series is generally available only from 1971 onwards. However we found one table in www.indiastat.com that shows the NSDP for Assam for the years 1961, 1965 and 1971 but it was not clear which Planning Commission document it was sourced from. More importantly, it was not clear whether the NSDP figure was only for the state of new Assam or for greater Assam. We however utilize the growth figures and would welcome corrections and additions to the data. Kale and Bhandari, mimeo. Indicus Analytics, December 2009 8
- 9. significantly in the post-reorganisation years. It would be difficult to correct for the impact of these elements. Figure 4: NSDP Growth Pre and Post Reorganization of Assam 2,000,000 70,000,000 1,800,000 60,000,000 1,600,000 1,400,000 50,000,000 1,200,000 40,000,000 1,000,000 30,000,000 800,000 600,000 20,000,000 400,000 10,000,000 200,000 0 0 1964-65 1972-73 1960-61 1961-62 1962-63 1963-64 1965-66 1966-67 1967-68 1968-69 1969-70 1970-71 1971-72 1973-74 1974-75 1975-76 1976-77 1977-78 1978-79 1979-80 1980-81 Assam GSDP (1999-00 Prices) India GDP (1999-00 Prices) It could be argued that the smaller size of the state made it more difficult for the state to garner enough resources and expertise to be able to put together a more robust opposition to the various militant elements. Hence, like the Green Revolution should not be treated as exogenous to the reorganisation of Punjab, the persistence (if not the emergence) of militant elements, it can be argued, should not be treated as independent of the state’s reorganisation in 1971. However, in later sections we argue that the presence and persistence of militancy in larger states, strongly indicates that greater size is not a good enough criteria to judge a states’ ability to counter militancy. This admittedly is incomplete analysis, as we are unable to estimate growth for the smaller states that constituted Greater Assam, pre and post reoragization. The available evidence for Assam therefore seems to indicate that though reorganisation may not have boosted economic growth, it did not harm it either on a long term basis. Other factors were more important. The Reorganisation of 2000 - Uttar Pradesh and Uttarakhand, MP and Chhattisgarh, and Bihar and Jharkhand The CSO has been able to estimate and put in the public domain NSDP data on the new states formed in 2000 for the period 1993-94 onwards. Separate state incomes have been provided by the CSO from 1993-94 and these have been used to compare the states for a Kale and Bhandari, mimeo. Indicus Analytics, December 2009 9
- 10. seven year period prior and post reorganisation. Hence the numbers are largely comparable, and though the time periods are not really adequate enough to capture the pre- and post- trends, this is the best that is possible. India has shifted on a higher growth path around 2001 and consequently the growth trends are about a couple of percentage points higher. Moreover most evidence around 2000 pointed towards relatively lower growth persisting in the northern states – and UP, MP and Bihar were at the bottom of that list. The figures show quite interesting results in the annualised growth trends: 1. Of the six new states formed out of the three older states, five have grown at a rate greater than the national average – MP being the only exception. 2. All the smaller states (Jharkhand, Uttarakhand, and Chhattisgarh) growth rates increased by a range of 4 to 6 percentage points post reorganisation, far higher than the 2 percentage point for India as a whole. 3. UP and Bihar have also had significant increases in growth rates (about 3 and 3.7 percentage points respectively). We address Bihar’s ramped up growth first. Unlike in the other two cases of MP and UP, Jharkhand was a very large part of the original Bihar, and its separation would have had a significant impact not only on itself, but also on the new smaller Bihar. The last few years have seen a significant increase in Bihar’s growth. Can Bihar’s reorganisation be given some credit to this? We would argue that it should. It is generally argued that Bihar’s improved performance in recent years can be ascribed to the better governance levels of the new administration. Given that many institutions as well as the administration were not functioning as desired, a smaller state, with a narrower ambit, would have made it easier for the new administration. In other words, Bihar is a good case for the argument, that smaller states make it easier to govern well. The increase in growth rates of Uttarakhand, Jharkhand and Chhattisgarh can all be, to some extent due to the fact that the new administrations in these states could better focus on the issues of relevance for them. Moreover, in the case of both Uttarakhand and Chhattisgarh, the region under consideration accounted for a very small proportion of the larger states of UP and MP – in terms of population, land areas, as well as economy. In the case of Jharkhand this was less so, as it was always a significant part of the larger Bihar. Hence post reorganisation, greater focus on the issues at hand would enable much greater improvements in these states of Chhattisgarh and Uttarakhand, than would be expected in Jharkhand. The data reflect the same. In the case of Uttarakhand and Chhattisgarh the annualized growth rates increased by about 6 percentage points in both these states in the post reorganisation years. In Jharkhand as well there was an improvement, about 4 percentage points, significant but not as large as the other cases. Next consider the argument, on how much the larger state gains. In the case of MP and UP, as mentioned earlier, the broken off states were a small proportion of the total. The benefits would therefore be limited. Not surprisingly, UP’s increase in growth was by a magnitude of 1.9 percentage points – about similar to that observed nationally. In the case of MP Kale and Bhandari, mimeo. Indicus Analytics, December 2009 10
- 11. however, the growth rates have further fallen – a result that is likely due to other factors, and not so much the break-up. Figure 5: Annualized Trend Growth pre and post Reorganisation of 2000 Percent Point 1993-94 to 2001-02 to Change post re- 2000-01 2008-09 organisation India 6.2% 8.1% +2.0% UP 3.9% 5.8% +1.9% Uttarakhand 3.1% 9.0% +5.9% UP + Uttarakhand 3.8% 6.1% +2.2% MP 5.1% 4.7% - 0.4% Chhattisgarh 1.6% 7.9% +6.3% MP + Chhattisgarh 4.1% 5.6% +1.5% Bihar 4.8% 8.5% +3.7% Jharkhand 4.6% 8.7% +4.1% Bihar + Jharkhand 4.8% 8.6% +3.8% From the limited data that is available, therefore we can postulate that when states break up, the smaller regions have the capability to work on their strengths and correct their weaknesses in a more efficient and cohesive manner towards higher growth. At the same time smaller states may also be more susceptible to other forces that can cause systemic disruptions. We find that among all the cases studied, there is no evidence to suggest that breaking a state into smaller states has a directly harmful impact on the economy. The exception being the possibility of MP. We pursue the matter further by studying the experiences of the districts that form the border between Chhattisgarh and the new MP in the next section. Section IV: The Case of MP - District Analysis Most states in India do not provide district level income data. Indicus has been estimating district wise GDP using a method quite similar to that recommended by the CSO to the states. Broadly this requires us to estimate output and/or value added at the district level using a range of public data sources and then calibrating the result with the state level GSDP published and updated by the CSO.9 The same methodology and data sources are used every year to ensure comparability of results across time. We begin by examining the per capita income levels at two points in time - 2001-02, the year following the state reorganisation, and at 2007-08, the latest year for which estimates are 9 See www.indicus.net for details on the methodology. Kale and Bhandari, mimeo. Indicus Analytics, December 2009 11
- 12. available. Districts that lie on the border of the parent and new states are compared with each other – this is to analyse whether the governance has made any difference in districts that are adjacent to each other and are likely to have some similarities. The hypothesis to be checked is whether districts across the borders started out with similar levels of development and took different growth trajectories due to different governance modes. Figure 6: District-level growth in border states of MP and Chhattisgarh 2001-02 to 2001-02 2007-08 2007-08 Annualised growth in per Per capita DDP Per capita DDP capita DDP over (1999-00 prices) (1999-00 prices) the period Madhya Pradesh Border Districts: Balaghat Dindori Shahdol Sidhi 10,322 10,721 0.6% Chhattisgarh Border Districts: Bilaspur Kawardha Koriya Rajnandgaon 10,541 17,145 8.4% Source: District Domestic Product of India, 2007-08. Figures are provisional. At a preliminary level, looking at per capita income, we find a clear case supporting our hypothesis in Chattisgarh- Madhya Pradesh, where bordering districts began with similar levels of per capita income, but the districts in Chhattisgarh soared way ahead of those across the border in Madhya Pradesh. Why might this have occurred? Chhattisgarh immediately in its post creation years went in for significant reforms. Privatization of poorly-functional PSEs, closing down of non- functional entities within the government, an emphasis on public-private partnerships, and perhaps the most important, significant road building activity are some examples. This contributed in part to the initial surge of investments and resultant economic growth. In other words, the problem of MP is a larger problem of poor governance and not so much due to its reorganisation. Section V: Conclusion We find evidence that the reorganisation of states in the past has been followed by higher economic growth. Moreover we find that states that have been a small part or on the periphery of a larger entity gain much more, than states that were significant parts of the Kale and Bhandari, mimeo. Indicus Analytics, December 2009 12
- 13. larger states. We also argue that exogenous shocks (whether positive – like the Green Revolution, or negative – such as militancy), have a differential impact on smaller states than larger ones. However, whether all of India’s large states should be broken into smaller entities requires much more analysis – on socio-economic performance, on governance, on the ability of the new states to access relevant human capital, on their ability to ensure that democratic and governance institutions can withstand forces that would like to take-over the functioning of the states. But provided these issues are addressed, purely economic considerations would favour the creation of smaller entities. Increasingly it is being argued that smaller states are less likely to be able to deal with the ever-growing threat of militancy. The examples of Punjab, Assam and north-east, Jharkhand and Chhattisgarh provide some evidence supporting this argument. However, there have been significant and sustained militancy movements in other larger states as well – J&K, West Bengal, Andhra are some, but not the only examples. Hence we do not see the threat of militancy as a convincing enough reason to oppose the creation of smaller states. Overall therefore, the case for smaller states is building up, both empirically and politically. This however is not sufficient to break-up large states into an ever-growing number of smaller states. The way forward therefore needs to be on two fronts. First, on a long term basis, we need to strengthen democratic institutions and other governance mechanisms at the regional level. Deepening of civil society in various parts of India (and not just at the state level) needs to be a policy objective. Second, a smoother system that is more responsive to the demands of sub-state ambitions needs to be built. This system needs to take into consideration a certain minimum and maximum population size, the issue of resource availability and resource sharing, agro-climatic homogeneity and most important the wishes of the people within the region for achieving state-hood. This need not be considered as a one time action, rather, as and if demands for statehood grow a set of factors should be studied, before state-hood is granted. Overall, the one major consistent result we obtain, whether on a short or long term basis, is that no new state has seen a complete unravelling of institutions or growth post re- organization. That should be sufficient enough evidence to not blindly oppose the formation of smaller states, but to promote them on a case by case basis. *** Kale and Bhandari, mimeo. Indicus Analytics, December 2009 13
- 14. Appendix: States Reorganisation since 1950 The Constitution of India, which went into effect on January 26, 1950, made India a sovereign, democratic republic, and a union of states (replacing provinces) and territories. The states would have extensive autonomy and complete democracy in the Union, while the Union territories would be administered by the Government of India. The constitution of 1950 distinguished between three types of states. Part A states, which were the former governors' provinces of British India, were ruled by an elected governor and state legislature. The nine Part A states were Assam, West Bengal, Bihar, Bombay, Madhya Pradesh (formerly Central Provinces and Berar), Madras, Orissa, Punjab, and Uttar Pradesh (formerly United Provinces). The eight Part B states were former princely states or groups of princely states, governed by a rajpramukh, who was often a former prince, along with an elected legislature. The rajpramukh was appointed by the President of India. The Part B states were Hyderabad, Saurashtra, Mysore, Travancore-Cochin, Madhya Bharat, Vindhya Pradesh, Patiala and East Punjab States Union (PEPSU), and Rajasthan. The ten (nine according to ambedkar.org) Part C states included both the former chief commissioners' provinces and princely states, and were governed by a chief commissioner. The chief commissioner was appointed by the President of India. The Part C states included Delhi, Kutch, Himachal Pradesh, Bilaspur, Coorg, Bhopal, Manipur, Ajmer-Merwara, and Tripura. Jammu and Kashmir had special status until 1957. The Andaman and Nicobar Islands was established as a union territory, ruled by a lieutenant governor appointed by the central government. Source: http://en.wikipedia.org/wiki/States_Reorganisation_Act (CHECK ANOTHER SOURCE FOR VERACITY) On November 1, 1956, India was divided into the following states and union territories: States: • Andhra Pradesh: Andhra was renamed Andhra Pradesh, and enlarged by the addition of the Telangana region of erstwhile Hyderabad State. • Assam • Bihar • Bombay State: the state was enlarged by the addition of Saurashtra and Kutch, the Marathi-speaking districts of Nagpur Division of Madhya Pradesh, and the Marathwada region of Hyderabad. The southernmost districts of Bombay were transferred to Mysore State. (In 1960, the state was split into the modern states of Maharashtra and Gujarat.) • Jammu and Kashmir • Kerala: formed by the merger of Travancore-Cochin state with the Malabar District of Madras State. Kale and Bhandari, mimeo. Indicus Analytics, December 2009 14
- 15. • Madhya Pradesh: Madhya Bharat, Vindhya Pradesh, and Bhopal were merged into Madhya Pradesh, and the Marathi-speaking districts of Nagpur Division were transferred to Bombay State. • Madras State: the state was reduced to its present boundaries by the transfer of Malabar District to the new state of Kerala. (The state was renamed Tamil Nadu in 1969.) • Mysore State: enlarged by the addition of Coorg state and the Kannada speaking districts from southern Bombay state and western Hyderabad state. (The state was renamed Karnataka in 1973.) • Orissa: enlarged by the addition of 28 princely states including two princely states of Saraikela and Kharsawan, but later these two states merged with Bihar. • Punjab: the Patiala and East Punjab States Union (PEPSU) was merged into Punjab. • Rajasthan: Rajputana was renamed Rajasthan, and enlarged by the addition of Ajmer- Merwara state. • Uttar Pradesh • West Bengal • Union territories • Andaman and Nicobar Islands • Delhi • Himachal Pradesh • Lakshadweep • Pondicherry • Tripura • Manipur Source: http://en.wikipedia.org/wiki/States_Reorganisation_Act Date of Changes in Boundaries in State Creation the following years Andhra Pradesh 1953 1956 1959 Arunachal Pradesh 1971 Assam 1951 1962 1971 Bihar 1950 1956 1968 2000 Chhattisgarh 2000 Goa 1987 Gujarat 1960 Haryana 1966 1979 Himachal Pradesh 1966 Jammu and Kashmir 1950 Jharkhand 2000 Karnataka 1950 1956 1968 Kerala 1956 Madhya Pradesh 1950 1956 2000 Maharashtra 1950 1960 Kale and Bhandari, mimeo. Indicus Analytics, December 2009 15
- 16. Date of Changes in Boundaries in State Creation the following years Manipur 1971 Meghalaya 1971 Mizoram 1971 Nagaland 1962 Orissa 1950 1960 Punjab 1950 1956 1960 1966 Rajasthan 1950 1956 1959 Sikkim 1975 Tamil Nadu 1950 1953 1959 Uttar Pradesh 1950 1968 1979 2000 Uttarakhand 2000 West Bengal 1950 1954 1956 Delhi 1950 1956 Andaman and Nicobar 1950 1956 Chandigarh 1966 Dadra and Nagar Haveli1961 Daman and Diu 1987 Lakshadweep 1956 Pondicherry 1962 Source: ‘Reorganisation of states in India’, Mahendra Prasad Singh, EPW, March 15 2008, pp 70-75’ Kale and Bhandari, mimeo. Indicus Analytics, December 2009 16