International Capital Flows and Inclusive Growth in Nigeria

The study is on the effect of Net capital inflow on inclusive growth in Nigeria. This study seeks to deepen the understanding on how capital inflow creates opportunity for inclusive growth in Nigeria through increase in GDP per capita. The objective of the study were to : determine the effect of Net capital inflow , Net foreign direct investment and trade openness on inclusive growth in Nigeria. The study employed the time series data in its analysis. The period of analysis spanned through 1980-2015 and the dataset required for the analysis were sourced from the Central Bank of Nigeria (CBN) Statistical Bulletin and National bureau of statistics publications. The study conducted trend analysis, descriptive analysis. The data were also tested for stationarity using the Augmented Dickey Fuller (ADF) unit root test and Ordinary Least Square (OLS) analytical techniques, cointegration test and error correction mechanism. It was evident from the unit root test that the variables were fractionally integrated while the cointegration test reveals that long run relationship exists among the variables. The findings equally reveal that capital inflow exerts significant negative influence on GDP per capita. This could be attributed to the problem of managing external capital flows which has been sub-optimal in most developing economies including Nigeria. The implication of this finding is that the perceived benefits that are associated with capital inflows tend not to hold sway in Nigeria over the sampled period which may be attributed to institutional and governance failure. Owing to the findings, this study recommends for the adoption of investment friendly policies and ensure transparency and good governance, appropriate economic management practices capable of supporting reforms in the Nigerian financial system and guide international capital inflows to ensure that the associated economic turnarounds are people-centered.

Recomendados
Recomendados
Mais conteúdo relacionado
Mais procurados
Mais procurados (18)
Semelhante a International Capital Flows and Inclusive Growth in Nigeria
Semelhante a International Capital Flows and Inclusive Growth in Nigeria (20)
Mais de International Journal of Economics and Financial Research
Mais de International Journal of Economics and Financial Research (20)
Último
Último (20)
International Capital Flows and Inclusive Growth in Nigeria
- 1. International Journal of Economics and Financial Research ISSN(e): 2411-9407, ISSN(p): 2413-8533 Vol. 3, No. 9, pp: 182-196, 2017 URL: http://arpgweb.com/?ic=journal&journal=5&info=aims *Corresponding Author 182 Academic Research Publishing Group International Capital Flows and Inclusive Growth in Nigeria Ewubare, Dennis Brown* Department of Agricultural and Applied Economics, Rivers State University, Port Harcourt, Rivers State, Nigeria Ozigbu, chukwuma Johnbosco Department of Agric. And Applied Economics. Rivers State University, Port Harcourt Rivers State, Nigeria 1. Background to the Study Over the last two decades, the world has witnessed widespread removal of capital controls in both developed and developing countries. Consequently, countries have become more financially integrated over time. Conventional wisdom predicts that countries can better insure macroeconomic risk when they are more financially integrated. With the recent shift in policy towards a market based system of resource allocation, increasing attention has been switched to the development of efficient financial systems in both developing and transitional socialist countries. According to Levine (2001), financial integration strengthens domestic financial sector, making way for more efficient capital allocation and higher investment and growth opportunities. In the presence of financial integration, efficiency gains are generated among domestics firms because they have to compete directly with foreign rivals (Kose et al., 2006). Since it is believed that having access to a broader base of capital is a key requirement for economic growth, then financial integration is necessary because it expedites flows of capital from developed economies with rich capital to developing economies like Nigeria with limited capital. Such capital inflows can significantly reduce the cost of capital in capital-poor Nigeria leading to higher investment. Nigeria requires foreign investment to develop its economy that is deficient in financial and managerial capital. Internally available resources are grossly inadequate to meet the needs of economic development and poverty reduction, even in the unlikely absence of corruption and resource management. Through interaction with advanced wealth creating nations, Nigeria may pull itself out of its vicious circle of poverty. With the development of financial market and increased degree of international financial integration around the world, many countries especially developing countries are now trying to remove cross-border barrier and capital control, relaxing the policy on capital restrictions and deregulating domestic financial system. The increasing level of financial globalization and incidence of financial crises in recent times has drawn the attention of economists and policymakers to the macroeconomic implications of unrestricted capital flows to developing countries. Capital flows Abstract: The study is on the effect of Net capital inflow on inclusive growth in Nigeria. This study seeks to deepen the understanding on how capital inflow creates opportunity for inclusive growth in Nigeria through increase in GDP per capita. The objective of the study were to : determine the effect of Net capital inflow , Net foreign direct investment and trade openness on inclusive growth in Nigeria. The study employed the time series data in its analysis. The period of analysis spanned through 1980-2015 and the dataset required for the analysis were sourced from the Central Bank of Nigeria (CBN) Statistical Bulletin and National bureau of statistics publications. The study conducted trend analysis, descriptive analysis. The data were also tested for stationarity using the Augmented Dickey Fuller (ADF) unit root test and Ordinary Least Square (OLS) analytical techniques, cointegration test and error correction mechanism. It was evident from the unit root test that the variables were fractionally integrated while the cointegration test reveals that long run relationship exists among the variables. The findings equally reveal that capital inflow exerts significant negative influence on GDP per capita. This could be attributed to the problem of managing external capital flows which has been sub-optimal in most developing economies including Nigeria. The implication of this finding is that the perceived benefits that are associated with capital inflows tend not to hold sway in Nigeria over the sampled period which may be attributed to institutional and governance failure. Owing to the findings, this study recommends for the adoption of investment friendly policies and ensure transparency and good governance, appropriate economic management practices capable of supporting reforms in the Nigerian financial system and guide international capital inflows to ensure that the associated economic turnarounds are people-centered. Keywords: Inclusive growth; Integration; Openness; GDP Per capita; Inflows.
- 2. International Journal of Economics and Financial Research, 2017, 3(9): 182-196 183 may be beneficial to receiving countries as they gain access to cheaper sources of financing. At the same time, they increase a country’s vulnerability to international financial crises which occurs during spontaneous reversals in international capital flows. The financial crisis of the 1980s, Latin America and East Asia in the 1990s and Argentina in 2001-02, are examples of the disruptive effects of fluctuations in international capital flows (Chen and Quang, 2012). Although the financial turmoil in the United States of America (U.S.A.) and some parts of the Euro Zone may have been triggered by various issues such as bank failures, property bubbles and government fiscal deficit, the crises have been transmitted to other countries through financial channels. The crises in these supposed- resilient advanced economies have exposed the vulnerability of emerging economies that depend on foreign inflows and the global financial system as a whole. Portfolio equity inflows to the Sub-Saharan African region have improved significantly over the last decade, which is an indication of the sub-region’s gradual integration into the global financial market. Net capital flows comprise the sum of this monetary, financial, real property, and equity claims. International capital flows, move in the opposite direction to the goods and services trade claims that give rise to them. Thus, a country with a current account deficit necessarily has a capital account surplus. Oyejide (2005) noted that capital flows carry mixed blessing depending on the “initial conditions” of a developing economy. The flows can have positive effects on the key real sector variables and contribute to the promotion of economic growth and development. The risk is evident in macroeconomic shocks that could undermine the stability of the real sector and impose high adjustment cost on the economy. Also the instability of capital flows may retard economic growth and structural developments. Private capital usually flows to countries where the business environment and investment climate are perceived as attractive in terms of macroeconomic and political stability, infrastructure and availability of factors of production and access to markets. Summers (2000) maintain that “enormous social benefits” are made possible by the efficiency gains from the reallocation of capital from industrial to developing countries. The reallocation can improve living standards by mobilizing global savings to finance investments in countries where the marginal productivity of investment is relatively high. Inclusive Growth is a concept that is often used interchangeably with other terms, including; broad-based growth, shared growth, and pro-poor growth (World Bank, 2009). Therefore inclusive growth is refereed to both the pace and pattern of growth, which is considered interlinked. This is because both pace and pattern of growth is necessary for achieving a high sustainable growth record as well as poverty reduction, (Commission on Growth and Development, 2008). The concept encompasses equity, equality of opportunity and protection in market and employment transition, all these are necessary and crucial for poverty reduction. 2. Literature Review 2.1. Theoretical Framework - Capital Flow The Eclectic Theory John Dunning has attempted to formulate a general theory of international production by combining the postulates of some of the theories. According to Dunning foreign investment by MNCs result from three comparative advantages which they enjoy, these include; the firm specific advantage; internalisation advantage and location specific advantages. The internalisation advantage results from the ability of the firm to internalise its specific resources. One important deficiency of the Eclectic theory is its inability to explain the foreign investment for acquisitions which have become a very important route to internalisation. The Neoclassical Growth Model The Neoclassical Growth Model was developed by Solo and Swan (1956). It is built upon an aggregate, constant- returns- to- scale production function that combines labour and capital (with diminishing marginal returns) in the production of a composite good. Savings are assumed to be a fixed fraction of output, and technology improves at an exogenous rate. Suppose the production function is Cobb- Douglas, so that Where Y denotes total output, L the number of workers employed in the production process, K the capital stock Where, A measures the level of technology. Output per worker, y=Y/L, is thus given by Where, k denotes the capital- labour ratio. Capital accumulation is given by -( - ) Where, s denotes the propensity to save, n> 0 the exogenous rate of population growth, and δ the rate of depreciation of physical capital.
- 3. International Journal of Economics and Financial Research, 2017, 3(9): 182-196 184 2.2. Empirical Literature Bailliu (2000) adopted the method of Caselli et al. (1996), using panel-data methodology that controls for country-specific effects and accounts for the potential endogeneity of the explanatory variables on a panel data over period of 20 years to test the relation between private capital flows; financial development and economic growth for 40 developing countries. The study found that for the countries with developed functional banking system, capital inflows foster higher economic growth, above and beyond any effects on the investment rate, the result suggests that the domestic financial sector plays a pivotal role in ensuring that international capital flows indeed promote economic growth in developing countries. Prasad et al. (2002) employ cross sectional data and panel data analysed the uphill flows of capital from non-industrial to industrial countries. And to check whether the patterns of capital flow have hurt non-industrial countries, the result shows a positive correlation between current account balance and growth among non-industrial countries implying that foreign capital is associated with higher growth and the result is weaker when used panel data. In East Asian, Baharumshah and Thanoon (2008) using dynamic panel data on Asian countries to access the effect of various types of capital flow on the growth process. They discovered that domestic savings, long-term debt has positive effect on the long-term as well as in the short term growth. The contribution of FDI is positive and robust to the growth process of the East Asian countries. Obstfeld (2007) argues that despite meager evidence that developing countries gain from financial globalization, they should proceed cautiously, in an incremental manner. He maintains that there is strong evidence that domestic financial development spurs growth under the right conditions, and the conditions – plus domestic financial development itself are likely to make capital inflows from abroad more productive. While Azienman et al. (2011) investigate the relationship between economic growth and lagged international capital flows, disaggregated into FDI, portfolio investment, equity investment, and short-term debt using 100 countries as case study during 1990-2010 both before and after the global crisis. The study reveals a complex and mixed result. The relationship between growth and lagged capital flows depends on the type of flows, economic structure, and global growth patterns. There exists a robust relationship between FDI- inflows and outflows and growth, finally, the correlation between growth and equity flows is smaller and less stable. Finally, the relationship between growth and short-term debt is nil before the crisis, and negative during the crisis. Contrary to the above result Ogbuagu and Ifionu (2015) explore the impact of capital flow, human capital development on economic growth using pairwise granger causality and dynamic autoregressive. And we found no causality between capital flow human capital development and economic growth. Another strand of literature centres on the strong presumption that FDI should yield productivity gains for domestic firms through several channels including imitation (adoption of new production methods), skill acquisition (education / training of labour force) and competition (efficient use of existing resources by domestic firms). Borensztein et al. (1998) using cross – country data, conclude that FDI increases an economy’s productive efficiency and economic growth. Soto (2000) finds that there are large positive benefits from FD1 and portfolio equity flows, while debt flows have damaging effect on countries with fragile financial systems. But, Carkovic and Levine (2001) disagree with this result and find no important effect of FDI on growth, Agloyor et al. (2014) examines the relationship between private capital flows and economic growth in Africa using a panel generalized method of moments estimator on a decomposed private capital flows into foreign direct investment, foreign equity portfolio investment and private debt flow found that all have a negative impact on economic growth. Gheeraert et al. (2013) employ structural econometric model and simple correlation analysis to test link between international capital flows and economic growth and whether there is a relationship between international capital flows with development, first he found positive significant and robust relationship between capital flow and growth and insignificant negative correlation between capital flow and development. Obiechina and Ukeje (2013) using Engel – Granger 2 step procedure, examine the impact of capital flow (FDI), export, and trade openness on economic growth in Nigeria. The result indicates that all the varaiable except FDI are statistically significant and impacted in economic growth in the short-run, dynamic equilibrium model, the pairwise granger causality revealed the existence of unidirectional causality between economic growth and FDI. Alley (2015) estimated annual data on 14 Sub- Saharan Africa using neoclassical growth model to evaluate the effect private capital flow shocks on SSA countries economic output and growth. He finds that private capital flows positively affects economic output and growth and the effect of the private capital flow is negative. In Pakistan, Ali (2014), uses Johansen Cointegration and Granger Causality test the effect of foreign inflow and found negative impact on the long-run and unidirectional causality from debt service, inflation and literacy rate to growth. In Ghana, Kwame et al. (2016) utilize auto- regressive distributed lag (ARDL) to examine the differential effects of capital flows on economic growth. The finding indicates that in both short run and long run (FDI, Financial Aid, and external debt) has negative effect on growth. Remittances exhibit positive insignificant elasticity in all the regression, the impact trade and gross capital formation and mixed. Can volatility hamper capital inflow impact on economic growth; Mody and Murshid (2012) shows evidence of negative impact of openness to capital flow by highlighting on the negative correlation between capital inflows and long-run growth with volatility below a threshold, an inflow of foreign capital has promoted growth but during periods of volatility growth, more flow promote slower growth.
- 4. International Journal of Economics and Financial Research, 2017, 3(9): 182-196 185 3. Methodology This paper adopted a quasi-experimental research design in examining the relationship between financial integration and inclusive growth in Nigeria over the period, 1980-2015. The rationale for this approach is based on its flexibility in using two or more exogenous variables in a model 3.1 Based on the above research problems and objectives, the study answered the following research questions. What is the effect of Net capital inflow, Net foreign direct investment and trade openness on inclusive growth in Nigeria? 3.4 Model Specification and Data Analysis Techniques The framework for the analysis involves a multiple regression model with GDPPC as the dependent variable while net capital inflows, proportion of FDI to GDP and trade openness are the underlying regressors. The general form of the model is formalized as follows: GDPPC = f (NCIG, NFDIG, TD) (3. 1) The implicit form of equation (1) is expressed in a log-linear format as: Log(GDP) = λ0 + ψ1NCIG + ψ2NFDIG + ψ3TD + µt (3 .2) Where: GDPPC = Gross domestic product per capita, proxy for inclusive growth NCIG = Net capital inflow NFDIG = Net foreign direct investment TD = Trade openness λ0 = constant term ψ1 - ψ3 = coefficients of the explanatory variables log = Natural log operator µt = white noise Based on a priori grounds, the expected signs of the coefficient of the explanatory variables are expressed as: ψ1 >0, ψ2 >0 and ψ3 >0. Unit Root Test Specifically, this paper relied on Augmented Dickey-Fuller approach to unit root test proposed by Dickey and Fuller (1981). The ADF model with drift and trend is specified as: ∑ Where ut is a pure white noise error term and ΔHt=(Ht-1 –Ht-2. m is the lag order to be automatically decided based on Schwarz information criterion (SIC). Notably, if the computed ADF value is less than its associated critical value, it implies that the underlying series is non-stationary. Contrarily, if the calculated ADF value exceeds its critical value, it indicates that the underlying series is stationary. Johansen Co-integration Analysis Test The presence of co-integration suggests that variables have long-run relationship. Thus, a lack of co-integration suggests that such variables have no long-run relationship. Co-integration is conducted based on the test proposed by Johansen (1998). Johansen’s methodology takes its starting point in the vector auto regression (VAR) of order P given by Q t = ϸ + Δ 1 Q t-1 + - - - + ΔP Q t-p + e t (3.4) Where: Qt is an nx1 vector of variables that are integrated of order commonly denoted (1) and e t is an nx1 vector of innovations. This VAR can be rewritten as ΔQ t = ϸ +ƞ Qt-1 + Σπ i ΔQ t-1 + e t (3.5) To determine the number of co-integration vectors, Johansen (1988) and Johansen and Juselius (1990) suggested two statistic tests, which are the trace test and the Max-Eigen test. It tests the null hypothesis that the number of distinct co-integrating vector is less than or equal to q against a general unrestricted alternatives π = q. The test calculated as follows: π trace (q) = -T Σ In (1- πt ) (3.6) π Max-Eigen (q) = -T Σ In (1- πt ) (3.7) Where: T is the number of usable observations, and the π1,s are the estimated eigenvalue. If cointegration is proven to exist, then the third step requires the construction of Error Correction Mechanism (ECM) to model dynamic relationship. Error Correction Model Additionally, this study adopted a multivariate approach to cointegration credited to Soren Johansen (1988). The trace (λtrace) and maximum eigenvalue (λmax) tests statistics are utilized to estimate the cointegration rank (number of independent cointegrating vector). The null hypothesis of no cointegrating equation is tested against the alternative hypothesis of cointegrating equation. Evidence of at least one cointegrating equation indicates that long run relationship exists among the underlying variables (Emeka Nkoro and Aham Kelvin Uko, 2016). The purpose of the ECM is to indicate the speed of adjustment from the short-run equilibrium to the long-run equilibrium state. The greater the co-efficient of the parameter, the higher the speed of adjustment of the model from the short-run to the long-run.
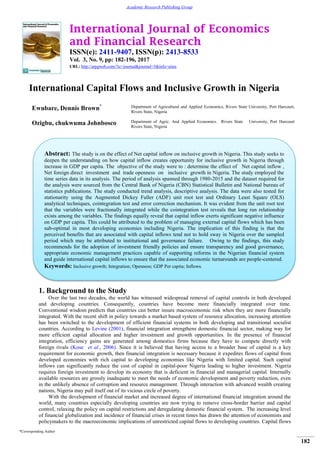
- 5. International Journal of Economics and Financial Research, 2017, 3(9): 182-196 186 The error correction model (ECM) of equation (3.2) is utilized to reconcile the short-run dynamics with long-run equilibrium. The error correction model is formalized as: m i t m i t m i t m i tt TDNFDIGNCIGInGDPInGDP 1 14 1 13 1 12 1 110 tt vECM 1 (1.8) Where: GDP, NCIG, NFDIG, TD and In are as described in equation (1.1) = Constant parameter, = dynamic coefficients of the regressors m = lag length, ф = Coefficient of ECM lagged for one period, which captures the speed of adjustment and vt= Random variable. 3.1. Data collection Methods and Sources The datasets utilized for the analysis were obtained from the Central Bank of Nigeria Statistical and National bureau of statistics. Bulletin. Specifically, Gross domestic product per capita (GDPPC) is used as a measure of inclusive growth while net capital inflow (NCIG), net FDI flow (NFDI) and trade openness (TD) are included as the explanatory variables. 4. Results and Discussion 4.1. Trend Analysis The graphical illustrations of the trends of the variables based on the underlying data adapted from the Central Bank of Nigeria Statistical Bulletin are presented in Figures 1 to 4 as follows. Figure-1. GDP per capita in Nigeria, 1980-2015 Source: Estimated by the Author based on underlying data adapted from CBN Statistical Bulletin. Figure-2. Net capital inflow to Nigeria, 1980-2015 Source: Estimated by the Author based on underlying data adapted from CBN Statistical Bulletin. 0 100000 200000 300000 400000 500000 600000 1970 1980 1990 2000 2010 2020 GDPpercapita YEAR GDPPC 0 10 20 30 40 50 1970 1980 1990 2000 2010 2020 Netcapitalinflow YEAR NCIG
- 6. International Journal of Economics and Financial Research, 2017, 3(9): 182-196 187 Figure-3. Net FDI in Nigeria, 1980-2015 Source: Estimated by the Author based on underlying data adapted from CBN Statistical Bulletin. Figure-4. Trends of trade openness in Nigeria, 1980-2015. Source: Estimated by the Author based on underlying data adapted from CBN Statistical Bulletin. The graphical illustrations of the series as evidenced in figures 1 to 4 indicate that GDP per capita followed a positive path as increased gradually during the period of the analysis and attained a maximum of 507,882 in 2014. This is suggestive that its mean increases over time. As indicated in figure 2, the plot of net capital inflow remained relatively stable from 1980 to 1990. The remaining part of the period shows increasing values of net capital inflow, indicating that its mean varied over the period. It attained an all-time high in 2007. The plot of net FDI displayed in figure 3 indicates that it is mean reversal. Thus, its mean tends to be constant over the period sample. Finally, the plot of trade openness (TD) depicted in figure 4 shows that it is downward trending in the first three periods (1980- 1983). It witnessed an upward trend between 1985 and 1993, but became mean reversal in the remaining period of the analysis. 4.2 Descriptive Statistics The characteristics of each of the series based on their mean values, standard deviation and other key descriptive statistics are summarized as follows: -2 0 2 4 6 8 10 1970 1980 1990 2000 2010 2020 NetFDI YEAR NFDIG 0 20 40 60 80 100 120 1970 1980 1990 2000 2010 2020 Tradeopenness YEAR TD
- 7. International Journal of Economics and Financial Research, 2017, 3(9): 182-196 188 Table-1. Basic descriptive statistics for the series Source: Estimated by the Author Table 1 shows the descriptive statistics for GDP per capita (GDPPC), net capital inflow (NCIG) , proportion of net FDI to GDP (NFDIG) and trade openness (TD). The average values of the series are 104546.0 for GDPPC, 15.09586 for NCIG, 3.146393 for NFDIG and 66.22285 for TD. The range of the series captured by the minimum and maximum values indicate that GDPPC ranged from 682.1000 to 507882.0, NCIG ranged from 0.634750 to 43.53930, NFDIG ranged from -1.150900 to 8.279540 and TD ranged from 27.80370 to 97.32120. The convergence of the series around their mean values as captured by the standard deviation indicates that all the variables except GDPPC cluster around their average values. The skewness shows the direction of the tail of each series. It was found that aside NCIG, all the series are tailed to the right. Further information on the tail of the series was gathered from the kurtosis as it reveals that only NCIG is thin tailed while the other series have large tails. The Jarque-Bera statistics indicate that that the hypothesis that the errors are normally distributed is only rejected for GDPPC while the other variables are not normally distributed at 5 percent level. 4.3. Estimation of Static Regression Model The estimation of the static regression model basically relied on the Ordinary Least Squares (OLS) method. The result is reported as follows in table 2. Table-2. Summary of static regression Dependent variable: InGDPPC Regressor Coefficient T-Statistic P-value NCIG 0.1337*** 8.201 0.0000 NFDIG 0.0338 0.2934 0.7711 TD 0.0352*** 2.659 0.0121 CONST 5.355*** 7.748 0.0000 R-square =0.814, Durbin Watson Stat.= 0.382 Prob (F-sat.)=0.0000 Source: Estimated by the Author NB: *** denotes significant at 1 percent level Table 2 presents the empirical result for the static regression model. The result indicates that net capital inflow and trade openness are positively related to GDP per capita. This finding conforms to the a priori and statistical criteria given that the estimated parameters appeared with the hypothesized positive sign and it is significant at 5 percent level. Although the coefficient of net FDI appeared with the hypothesized positive sign, it is statistically insignificant at 5 percent level. This is indicative that GDP per capita is not actually influenced by the proportion of FDI to GDP. More importantly, the explanatory power of the regressors as evidenced in the coefficient of determination is 81 percent. It therefore follows that 81 percent variations in GDP per capita are jointly explained by net capital inflow, proportion of FDI to GDP and trade openness. This is a pointer that the model is nicely fitted. The probability of the f-statistics (0.0000) indicates that the regressors are jointly significant in explaining changes in GDP per capita. 4.4. Unit Root Test The unit root test has been advocated in economic literature for examining whether an economic time series is stationary. Focusing on Augmented Dickey-Fuller approach to unit root test, this paper test the null hypothesis of a unit root (non-stationary) against the alternative hypothesis of no unit root (stationary) at both levels and upon differencing the underlying series. The test results of the ADF unit root test are reported in table 3. GDPPC NCIG NFDIG TD Mean 104546.0 15.09586 3.146393 66.22285 Median 25340.06 16.98175 3.067085 72.27500 Maximum 507882.0 43.53930 8.279540 97.32120 Minimum 682.1000 0.634750 -1.150900 27.80370 Std. Dev. 159172.6 12.38899 1.879628 17.87615 Skewness 1.555732 0.443441 0.627371 -0.779589 Kurtosis 3.909153 2.347478 4.270176 2.645695 Jarque-Bera 15.76166 1.818519 4.781584 3.834851 Probability 0.000378 0.402822 0.091557 0.146985 Observations 36 36 36 36
- 8. International Journal of Economics and Financial Research, 2017, 3(9): 182-196 189 Table-3. Outcomes of ADF unit root on the underlying series Variable ADF Statistic Lag length Critical values (5 percent) Order of integration InGDPPC -2.061 0 -3.544 1 (1)∆InGDPPC -5.1579 0 -3.548 NFDIG -4.467 0 -3.548 1 (0)∆NFDIG -9.365 0 -3.548 NCIG -3.364 3 -3.557 1 (2)∆NCIG -2.422 2 -3.557 ∆NCIG,2 -10.5121 1 -3.557 TD -1.768 0 -3.544 I(1)∆TD -6.661 0 -3.548 Source: Estimated by the Author NB: 1(0), 1(1) and 1(2) denote integrated of order zero, one and two respectively. The results of the ADF unit root test on the series as presented in table 3 above. The decision on the lag length followed the Schwarz information criterion (SIC). It was uncovered from the results that net FDI to GDP is stationary at levels. However, net capital inflow, trade openness and GDP per capita were found to be stationary upon differencing. The order of integration for NFDIG is zero while NCIG and TD are integrated of order one. The net capital inflow is found to be integrated of order two. With the establishment of stationarity for the series from the unit root test, cointegration test is considered appropriate to validate the results. 4.5. Cointegration Test This paper considered the multivariate approach to cointergation credited to Soren Johansen (1988) in investigating whether the series have long run relationship. The result is summarized below with focus on the trace and Max-Eigen statistics: Table-4. Outcomes of trace and Max-Eigen tests Series: InGDPPC NFDIG NCIG TD Ho Trace statistic Max-Eigen statistic r<o 73.078 (47.856) 39.647 (27.584) r<1 33.430 (29.797) 18.434( 21.131) r<2 14.996(15.494) 14.043 (14.264) r<3 0.9526 ( 3.841) 0.9526(3.8414) Source: Estimate by the Author NB: r indicates number of cointegrating vectors. Figures in parenthesis are critical values at 5 percent level. Table 4 above displays the trace and Max-Eigen statistics utilized in examining whether the series are cointegrated. It was observed from the trace test that two cointegrating equations exist in the model. The Max-Eigen test on the other hand shows evidence of one cointegating equation. Thus, the conclusion drawn from the result of cointegration test is that the long run relationship exists among the series. 4.6. Estimation of Error Correction Model The error correction model (ECM) is utilized in this paper to examine if short run deviations from equilibrium are corrected over time. The estimated ECM is gradually transformed to parsimonious ECM and the result is presented in table 5 as follows. Table-5. Outcome of Parsimonious ECM. Dependent variable: ∆InGDPPC Variable Coefficient T-statistic P-Value ΔInGDPPCt-1 -0.3125 ** -2.189 0.0406 ΔNCIP t 0.0106 1.856 0.0781 ΔNCIG t-1 -0.0129** -2.072 0.0513 ΔNCIG t-2 -0.0160*** -2.685 0.0142 ΔNFDIGt-2 0.0182 1.217 0.2376 ΔNFDIGt-3 0.0285 1.831 0.0820 ΔTDt 0.0050 1.582 0.1292 ΔTDt-1 -0.0038 -1.250 0.2254 ΔTDt-2 0.006054 1.991 0.0603 ΔTDt-3 0.0097*** 3.147 0.0051 ECMt-1 -0.109*** -3.204 0.0044 Const. 0.255**** 6.408 0.0000 R-square=0.691, Prob (F-stat.) = 0.0031 Source: Estimated by the Author. NB: *** and ** respectively indicate significant at 1 and 5 percent levels.
- 9. International Journal of Economics and Financial Research, 2017, 3(9): 182-196 190 Table 5 reports the parsimonious ECM. The result reveals that the first lag of per capita GDP negatively influence current level of GDP per capita. Similarly, the first and second lags of net capital inflow have significant negative effects on GDP per capita. This finding deviated from the theoretical expectations, but provides explanation for the contribution of net capital inflow to the growth of per capita GDP in Nigeria. The implication of this finding is that perceived benefits that are associated with capital inflows tend not to hold sway in Nigeria over thesampled periodgiven that it has not been people-oriented. Additionally, the parsimonious ECM indicates that the lagged values of net FDI flow is positively related to GDP per capita. However, their coefficients are not significantly different from zero. This finding is equally consistent with the effects of third lag of trade openness as it contracts GDP per capita. The parameter estimates of the ECM appeared with the hypothesized negative, sign indicating that it is not explosive, but converges to equilibrium in the long run at a speed of 10 percent. This implies that in the event of temporary deviation, restoration of equilibrium in the system will take a long period. The computed f-ratio indicates the explanatory variables jointly and significantly influence GDP per capita. 4.7. Diagnostics Tests This paper employed diagnostics tests to check the reliability and efficiency of the parsimonious ECM. The outcomes of these tests are displayed below. Table-6. Diagnostics tests results Test type Test statistic P-value Breash-Godfrey LM test X2 - statistic 0.6687 Breash-Pagen-Godfredheteroskedasticity test X2 - statistic 0.1654 Normality test Jarque-Bera statistic 0.6449 Source: Estimated by the Author Table 6 reports the diagnostics tests for the parsimonious ECM. The Breusch-Godfrey serial correlation LM test reveals that the model is free from autocorrelation at 5 percent level.Also, the Breush-Pagan-Godfrey heteroskedasticity test shows that the variance of the random variable is homoscedastic the study period while the Jarque-Bera statistics attests to the normal distribution of the series at 5 percent level. 4.8. Stability Test The stability of the estimated parameters is examined using cumulative sum plot. The graphical illustration of this test is depicted in figure 5 below. Figure-5. CUSUM plot for stability test -15 -10 -5 0 5 10 15 1996 1998 2000 2002 2004 2006 2008 2010 2012 2014 CUSUM 5% Significance Source: Estimated by the Author As depicted in figure 5, the cumulative sum plot lies within the 5 percent critical bounds. This is a pointer that the estimated parameters are stable over the years of the analysis. 5. Conclusion and Recommendations The thrust of this paper is to examine the link between financial integration and inclusive growth in Nigeria. The effects of trade openness and net FDI flow on GDP per capita, proxy for inclusive growth are also examined by this paper. From the result, net capital net capital inflow is found to exert significant negative influence on GDP per capita. This could be attributed to the barriers that characterize capital account transactions in Nigeria. Another
- 10. International Journal of Economics and Financial Research, 2017, 3(9): 182-196 191 explanation for the negative effect of financial integration on GDP per capita is the problem of managing openness policy which has been sub-optimal in most developing economies including Nigeria. This is because the rush for financial integration is not adequate to guarantee its effectiveness in driving inclusive growth when there are little or no strategic arrangements for the management of the openness. This tends to increase the uncertainties that are associated with capital account transactions and limit the competitiveness of Nigeria in terms of mobilizing capital inflow. Additionally, the results shows that long run relationship exists among GDP per capita, net capital inflow, net FDI flow and trade openness. Owing to the findings, regulatory institutions should put in place proactive measures that promote gradual elimination of the barriers that impair net capital inflows to the Nigerian economy. This paper also recommends for the adoption appropriate economic management practices that will support the reforms in the Nigerian financial system and guide international capital inflows to ensure that the associated economic turnarounds are people-centered. References Agloyor, K., Abor, Y., Adjas, D. and Yawson, A. (2014). Private capital flows and economic growth in Africa. The Role of Domestic Financial Markets, 30(3): 137–52. Ali, S. (2014). Foreign capital flows and economic growth in pakistan an empirical ananlysis. World Applied Science Journal, 29(2): 193-201. Alley, I. (2015). Private capital flows and economic growth of sub-saharan african countries. African Development Review, 27(4): 469-83. Azienman, J., Jinjarak, U. and Park, D. (2011). Capital flows and economic growth in the era of financial integration and crisis. National Bureau of Economic Research, 24(3): 371–96. Baharumshah, A. Z. and Thanoon, M. A. (2008). Foreign capital flows and economic growth in East Asia countries. China Economic Review, 17(1): 70-83. Bailliu, N. (2000). Private capital Flows, Financial Development, and Economic Growth in Developing Countries” Bank of Canada, working paper No. 15 July. Borensztein, E., De Gregorio, J. and Lee (1998). How does foreign direct investment affect economic growth. Journal of International Economics, 45(1): 115–35. Caselli, F., G., Esquivel and Fernado, L. (1996). Reopening the convergence debate: A new look at cross-country growth empirics. Journal of Economic Growth, 1(3): 363-89. Chen and Quang, T. (2012). International Financial Integration and Economic Growth New Evidence on Threshold Effects, Paris School of Economics Commission on Growth and Development (2008). The Growth Report: Strategies for Sustained Growth and Inclusive Development. Washington DC: World Bank. Available: https://openknowledge.worldbank.org/handle/1098616507.Licenseccby3.01G0 Emeka Nkoro and Aham Kelvin Uko (2016). Exchange rate and inflation volatility stock pirces volatility: Evidence from Nigeria, 1986-2012. Journal of Applied Finance Banking, 6(6): 4. Gheeraert, L., Malek, H. and Mansour, J. (2013). On the impact of private capital flows on economic growth and development. Avaliable: http://dipot.ulb.ac.be/dispace/bitstream/2013/14597/1/rou-0207.pdf Kose, M., Ayhan, Eswar Prasad, Kenneth Rogoff and Shang-Jin Wei (2006). Financial Globalization: A Reappraisal". IMF Working Paper. Levine, Ross (1997). "Financial Development and Economic Growth: Views and Agenda. Journal of Economic Literature, 35(2): 688–725. Kwame, E., Klobodu, M. and Adam, S. (2016). The impact of capitall flow on economic growth. Journal of African Business, 17(3): Levine, R. (2001). International financial liberalization and economic growth. Review of International Economics, 9(4): 688-702. Mody, A. and Murshid, A. (2012). Growth from international capital flows: The role of volatility regime. International Monetary Fund Research Department: 1-50. Available: http://www.Acd.ie/economic/assets/pdf/growth-from Obiechina, M. and Ukeje, E. (2013). Economic growth capital flow, foreign exchange rate, export and trade openness in Nigeria. International Journal of Economics and Management Science, 2(9): 1-13. Obstfeld, M. (2007). International Finance and Growth in Developin Countries: What Have We learned? : Berkeley: University of California. Ogbuagu, A. and Ifionu, E. (2015). Causality between capital flow, Human capital development and economic growth; A Case of Nigeria. International Journal of Financial Research, 6(3): 116–34. Oyejide, T. (2005). Capital Flows and Economic Transformation: A Conceptual Framework.” A Paper Prepared for the 5th CBN Annual Monetary Policy Conference, Abuja; Nov.10-11. Prasad, E., Rajan, R. and Subramannan, A. (2002). Foreign capital and economic growth. Available on: Prasad.aem.cornell.edu/doc/journal-article//wpversion.pdf Solo and Swan (1956). Economic growth and capital accumulation. Economic Record (John Wiley & Sons), 32(2): 334–61. Soren Johansen (1988). Statistical analysis of cointegration vectors. Journal of Economic Dynamics & Control, 2(2): 231-54.
- 11. International Journal of Economics and Financial Research, 2017, 3(9): 182-196 192 Soto, M. (2000). Capital Flows and Growth in developingCountries: Recent Empirica Evidence”, OECD Development Centre, Technical Papers No. 160, (July). Summers, H. (2000). International financial crises: Causes, Prevention and Cures. American Economic Review, 90(2): 1-16. World Bank (2009). International capital flows and economic growth. Global Development Finance: Washington, D. C. Appendix Static Regression Results Dependent Variable: GDPPC Method: Least Squares Date: 02/22/17 Time: 02:31 Sample: 1980 2015 Included observations: 36 Variable Coefficient Std. Error t-Statistic Prob. NCIG 6765.334 2225.224 3.040293 0.0047 NFDIG 2510.408 15727.44 0.159620 0.8742 TD -146.6429 1808.201 -0.081099 0.9359 C 4229.882 94291.71 0.044860 0.9645 R-squared 0.279137 Mean dependent var 104546.0 Adjusted R-squared 0.211556 S.D. dependent var 159172.6 S.E. of regression 141336.3 Akaike info criterion 26.66011 Sum squared resid 6.39E+11 Schwarz criterion 26.83606 Log likelihood -475.8820 Hannan-Quinn criter. 26.72152 F-statistic 4.130409 Durbin-Watson stat 0.119039 Prob(F-statistic) 0.013899 Dependent Variable: LOG(GDPPC) Method: Least Squares Date: 02/22/17 Time: 02:35 Sample: 1980 2015 Included observations: 36 Variable Coefficient Std. Error t-Statistic Prob. NCIG 0.133788 0.016312 8.201876 0.0000 NFDIG 0.033835 0.115289 0.293479 0.7711 TD 0.035256 0.013255 2.659809 0.0121 C 5.355895 0.691201 7.748684 0.0000 R-squared 0.814294 Mean dependent var 9.816723 Adjusted R-squared 0.796884 S.D. dependent var 2.298856 S.E. of regression 1.036059 Akaike info criterion 3.013164 Sum squared resid 34.34936 Schwarz criterion 3.189110 Log likelihood -50.23695 Hannan-Quinn criter. 3.074574 F-statistic 46.77165 Durbin-Watson stat 0.382542 Prob(F-statistic) 0.000000
- 12. International Journal of Economics and Financial Research, 2017, 3(9): 182-196 193 Johansen Cointegration Result Date: 02/22/17 Time: 02:59 Sample (adjusted): 1985 2015 Included observations: 31 after adjustments Trend assumption: Linear deterministic trend Series: LOG(GDPPC) NCIG NFDIG TD Lags interval (in first differences): 1 to 4 Unrestricted Cointegration Rank Test (Trace) Hypothesized Trace 0.05 No. of CE(s) Eigenvalue Statistic Critical Value Prob.** None * 0.721673 73.07875 47.85613 0.0000 At most 1 * 0.448258 33.43099 29.79707 0.0183 At most 2 0.364292 14.99609 15.49471 0.0593 At most 3 0.030262 0.952622 3.841466 0.3291 Trace test indicates 2 cointegratingeqn(s) at the 0.05 level * denotes rejection of the hypothesis at the 0.05 level **MacKinnon-Haug-Michelis (1999) p-values Unrestricted Cointegration Rank Test (Maximum Eigenvalue) Hypothesized Max-Eigen 0.05 No. of CE(s) Eigenvalue Statistic Critical Value Prob.** None * 0.721673 39.64776 27.58434 0.0009 At most 1 0.448258 18.43490 21.13162 0.1144 At most 2 0.364292 14.04347 14.26460 0.0541 At most 3 0.030262 0.952622 3.841466 0.3291 Max-eigenvalue test indicates 1 cointegratingeqn(s) at the 0.05 level * denotes rejection of the hypothesis at the 0.05 level **MacKinnon-Haug-Michelis (1999) p-values Over-Parameterized Ecm Dependent Variable: DLOG(GDPPC) Method: Least Squares Date: 02/22/17 Time: 03:13 Sample (adjusted): 1984 2015 Included observations: 32 after adjustments Variable Coefficient Std. Error t-Statistic Prob. DLOG(GDPPC(-1)) -0.059174 0.169025 -0.350092 0.7311 DLOG(GDPPC(-2)) 0.175087 0.171208 1.022654 0.3227 DLOG(GDPPC(-3)) -0.330623 0.233857 -1.413782 0.1778 D(NCIG) 0.010311 0.008082 1.275772 0.2214 D(NCIG(-1)) -0.013905 0.011716 -1.186840 0.2537 D(NCIG(-2)) -0.018925 0.007349 -2.575102 0.0211 D(NCIG(-3)) -0.003753 0.012750 -0.294326 0.7725 D(NFDIG) -0.007801 0.022111 -0.352806 0.7291 D(NFDIG(-1)) 0.001151 0.020980 0.054879 0.9570 D(NFDIG(-2)) 0.020894 0.021731 0.961486 0.3516 D(NFDIG(-3)) 0.025666 0.022057 1.163634 0.2627 D(TD) 0.005701 0.003794 1.502549 0.1537 D(TD(-1)) -0.004413 0.003716 -1.187577 0.2535 D(TD(-2)) 0.004874 0.004364 1.116883 0.2816 D(TD(-3)) 0.010112 0.003947 2.562168 0.0217
- 13. International Journal of Economics and Financial Research, 2017, 3(9): 182-196 194 ECM(-1) -0.124825 0.063243 -1.973730 0.0671 C 0.241472 0.062110 3.887832 0.0015 R-squared 0.721261 Mean dependent var 0.202218 Adjusted R-squared 0.423939 S.D. dependent var 0.197491 S.E. of regression 0.149893 Akaike info criterion -0.652979 Sum squared resid 0.337018 Schwarz criterion 0.125693 Log likelihood 27.44766 Hannan-Quinn criter. -0.394871 F-statistic 2.425856 Durbin-Watson stat 1.974609 Prob(F-statistic) 0.046858 Parsimonious Ecm Dependent Variable: DLOG(GDPPC) Method: Least Squares Date: 02/22/17 Time: 03:29 Sample (adjusted): 1984 2015 Included observations: 32 after adjustments Variable Coefficient Std. Error t-Statistic Prob. DLOG(GDPPC(-3)) -0.312598 0.142776 -2.189432 0.0406 D(NCIG) 0.010698 0.005761 1.856882 0.0781 D(NCIG(-1)) -0.012945 0.006245 -2.072771 0.0513 D(NCIG(-2)) -0.016086 0.005990 -2.685686 0.0142 D(NFDIG(-2)) 0.018277 0.015013 1.217443 0.2376 D(NFDIG(-3)) 0.028536 0.015580 1.831554 0.0820 D(TD) 0.005059 0.003197 1.582534 0.1292 D(TD(-1)) -0.003895 0.003114 -1.250926 0.2254 D(TD(-2)) 0.006054 0.003041 1.991004 0.0603 D(TD(-3)) 0.009797 0.003113 3.147102 0.0051 ECM(-1) -0.109364 0.034126 -3.204722 0.0044 C 0.255518 0.039874 6.408190 0.0000 R-squared 0.691624 Mean dependent var 0.202218 Adjusted R-squared 0.522017 S.D. dependent var 0.197491 S.E. of regression 0.136538 Akaike info criterion -0.864437 Sum squared resid 0.372850 Schwarz criterion -0.314786 Log likelihood 25.83099 Hannan-Quinn criter. -0.682243 F-statistic 4.077810 Durbin-Watson stat 2.155363 Prob(F-statistic) 0.003152 Normality Test 0 2 4 6 8 10 12 -0.2 -0.1 0.0 0.1 0.2 0.3 Series: Residuals Sample 1984 2015 Observations 32 Mean -6.29e-18 Median -0.015169 Maximum 0.252550 Minimum -0.190356 Std. Dev. 0.109670 Skewness 0.402769 Kurtosis 2.905780 Jarque-Bera 0.877024 Probability 0.644995
- 14. International Journal of Economics and Financial Research, 2017, 3(9): 182-196 195 Breusch-Godfrey Serial Correlation Lm Test Breusch-Godfrey Serial Correlation LM Test: F-statistic 0.411583 Prob. F(2,18) 0.6687 Obs*R-squared 1.399408 Prob. Chi-Square(2) 0.4967 Test Equation: Dependent Variable: RESID Method: Least Squares Date: 02/22/17 Time: 03:34 Sample: 1984 2015 Included observations: 32 Presample missing value lagged residuals set to zero. Variable Coefficient Std. Error t-Statistic Prob. DLOG(GDPPC(-3)) 0.033718 0.152866 0.220574 0.8279 D(NCIG) -0.001687 0.006226 -0.270985 0.7895 D(NCIG(-1)) 0.000256 0.006453 0.039665 0.9688 D(NCIG(-2)) -0.000327 0.006275 -0.052097 0.9590 D(NFDIG(-2)) 0.001674 0.015585 0.107427 0.9156 D(NFDIG(-3)) -0.000543 0.016120 -0.033700 0.9735 D(TD) 0.000623 0.003582 0.174046 0.8638 D(TD(-1)) 0.000491 0.003272 0.149889 0.8825 D(TD(-2)) 9.84E-05 0.003138 0.031370 0.9753 D(TD(-3)) -0.000284 0.003227 -0.087882 0.9309 ECM(-1) -0.003225 0.037105 -0.086928 0.9317 C -0.007201 0.041964 -0.171599 0.8657 RESID(-1) -0.119934 0.249535 -0.480630 0.6366 RESID(-2) 0.190848 0.277818 0.686952 0.5009 R-squared 0.043731 Mean dependent var -6.29E-18 Adjusted R-squared -0.646907 S.D. dependent var 0.109670 S.E. of regression 0.140741 Akaike info criterion -0.784153 Sum squared resid 0.356545 Schwarz criterion -0.142894 Log likelihood 26.54645 Hannan-Quinn criter. -0.571594 F-statistic 0.063320 Durbin-Watson stat 1.816619 Prob(F-statistic) 0.999995
- 15. International Journal of Economics and Financial Research, 2017, 3(9): 182-196 196 Heteroskedasticity Test: Breusch-Pagan-Godfrey Heteroskedasticity Test: Breusch-Pagan-Godfrey F-statistic 1.628631 Prob. F(11,20) 0.1654 Obs*R-squared 15.12011 Prob. Chi-Square(11) 0.1771 Scaled explained SS 5.628049 Prob. Chi-Square(11) 0.8970 Test Equation: Dependent Variable: RESID^2 Method: Least Squares Date: 02/22/17 Time: 03:38 Sample: 1984 2015 Included observations: 32 Variable Coefficient Std. Error t-Statistic Prob. C 0.015035 0.004315 3.484077 0.0023 DLOG(GDPPC(-3)) -0.017474 0.015452 -1.130817 0.2715 D(NCIG) 0.001276 0.000624 2.046903 0.0540 D(NCIG(-1)) -0.001382 0.000676 -2.044194 0.0543 D(NCIG(-2)) -0.000624 0.000648 -0.961915 0.3476 D(NFDIG(-2)) 0.004541 0.001625 2.794787 0.0112 D(NFDIG(-3)) 0.003349 0.001686 1.986175 0.0609 D(TD) 0.000239 0.000346 0.690947 0.4975 D(TD(-1)) 1.31E-05 0.000337 0.038734 0.9695 D(TD(-2)) -0.000420 0.000329 -1.274788 0.2170 D(TD(-3)) -0.000391 0.000337 -1.159359 0.2600 ECM(-1) -0.003883 0.003693 -1.051228 0.3057 R-squared 0.472504 Mean dependent var 0.011652 Adjusted R-squared 0.182380 S.D. dependent var 0.016342 S.E. of regression 0.014777 Akaike info criterion -5.311472 Sum squared resid 0.004367 Schwarz criterion -4.761821 Log likelihood 96.98356 Hannan-Quinn criter. -5.129278 F-statistic 1.628631 Durbin-Watson stat 2.750136 Prob(F-statistic) 0.165356