SlideShare uma empresa Scribd logo
1 de 21
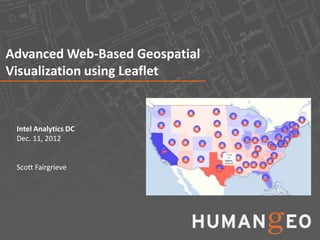
Advanced Web-Based Geospatial
Visualization using Leaflet


 Intel Analytics DC
 Dec. 11, 2012


 Scott Fairgrieve
Agenda


• Web mapping challenges
• Leaflet Overview
• Overview of HumanGeo’s Leaflet Data Visualization
  Framework
• Examples
• Next Steps


                                                      2
Challenges


• Deciding what mapping framework to use
    – There are lots of options (Google
      Maps, Bing, Yahoo, OpenLayers, etc.), each with its own API
    – This presentation focuses on Leaflet
• Understanding the structure/format of the data that’s going to be
  visualized
    –   Is it web map/JavaScript friendly?
    –   Does it work well with the mapping framework you’ve chosen?
    –   Will you always be dealing with the same format?
    –   Integrating data from a variety of sources typically requires custom code
        or code to standardize formats
• Lots of different ways of specifying location: lat/lon, grid
  formats, addresses, country/state codes, city names, etc.
    – Handling location formats other than lat/lon can be difficult and often
      requires additional web services


                                                                                    3
Visualizing Data on a 2D (Web) Map


• Want to highlight variations in data
• Typical approach: Vary the styling of
  points, lines, and polygons based on one
  or more values of the data
• Primary options
   – Marker Size/Radius
   – Color/Fill Color
• Other options
   – Line weight – useful when illustrating
     variation between line features
   – Opacity – useful for illustrating
     time, counts, etc.
   – Polygons – filled vs. empty, border vs. no
     border
   – Line style – dashed vs. solid


                                                         4
Examples – USGS Earthquakes Map


http://earthquake.usgs.gov/earthquakes/map/
Examples – Choropleth/Infographics


                                                 Bill and Melinda Gates Foundation


Bureau of Education and Cultural Affairs


                                                                 EngineYard.com


                                                                                     6
Leaflet Overview


• Developed by CloudMade
• Relatively new (first released in 2011)
• Simple compared to other JavaScript web mapping
  frameworks  a pro and a con
• Smooth animation and works well on mobile devices
• Pretty good documentation/examples
• http://leafletjs.com/index.html


                                                      7
Leaflet Basic Options


• Displaying point, line, and
  polygon features
   – L.Marker and L.Marker w/
     L.DivIcon
   – L.CircleMarker
   – L.Polyline
   – L.Polygon
• Loading data
   – L.GeoJSON
                                      Images from the Leaflet website


                                                                        8
Leaflet Vector Layers


• Leaflet is Scalable Vector Graphics (SVG) based
• Behind the scenes, non-image based markers are
  drawn using an SVG path element
  <path [path attributes] d=”[path data (e.g. M548 254L548 49L676
  49L676 254L548 254z)]"></path>
• Leaflet style options are mapped to path attributes
• Style options include:
  color, fillColor, opacity, fillOpacity, weight, dashArray,
   stroke, fill, radius
• We can create custom markers dynamically by
  inheriting from the L.Path class
                                                                    9
HumanGeo’s Leaflet Data Visualization Framework


• Started as a side project (a few hours per week)
• A work in progress (still in the alpha phase)
• Goals:
   – Enable cool, interactive, infographic style visualizations
   – Support displaying data in any JSON-based data format
   – Eliminate redundant code/tasks related to displaying data
   – Standardize the way in which data are loaded/displayed
   – Minimize dependency on server-side components for
     typical use cases (e.g. visualizing data by state or country)
   – Remain consistent with Leaflet’s coding style


                                                                      10
Color – RGB


• Most of us are familiar with RGB color, but it’s not
  always the best approach
• What color is this? rgb(213,154,10) or #D59A0A
        Gold

• Hue, Saturation, Luminosity/Lightness or HSL color
  provides a more intuitive color definition than RGB
  and is great for scientific visualizations/geo analytics


                                                             11
Color - HSL


• Hue represents a degree                                  <L   H     >L   R     G     B
  value on the color wheel                                      0          255   0     0

    – Varies according to the colors                            30         255   127   0

      of the visible spectrum – the                             60         255   255   0
      rainbow ROYGBIV pattern that
      is familiar to most people                                90         127   255   0


• Saturation represents the                                     120        45    255   0


  percentage of the given hue                                   150        45    255   84


  that is present in a color:                                   180        43    255   255


    – 0% = gray                                                 210        13    95    255

    – 100% = full hue                                           240        0     0     255


• Luminosity represents the                                     270        99    0     255

  percentage of lightness in a                                  300        249   0     255

  color:                                                        330        249   0     112

    – 0% = black                                                360        255   0     0

    – 50% = hue
    – 100% = white

                                       Source: Wikipedia
                                                                                       12
Framework Basics – Linear Functions for Dynamic Styling


• y = mx + b
• Useful for varying one property
  linearly with respect to another
  property (e.g. mapping temperature
  to marker radius)
   – x = data property
   – y = style property
• Numeric properties (radius, weight,
  opacity, fillOpacity) 
  L.LinearFunction                                     Image Source: Wikipedia

• color, fillColor  L.HSLHueFunction,
  L.HSLLuminosityFunction,
  L.HSLSaturationFunction, other color
  function classes

                                                                                 13
Framework Basics – New Marker Types


• L.RegularPolygonMarker
• Charts:
   – L.PieChartMarker

   – L.BarChartMarker

   – L.RadialBarChartMarker

   – L.CoxcombChartMarker

   – L.RadialMeterMarker


                                                    14
Framework Basics – Data Layers


• L.DataLayer
   – Automates the work of displaying data
      regardless of the structure of the data
   – Handles country codes, state codes, and
      custom location formats in addition to
      lat/lon
   – Provides a legend for free
• L.MarkerDataLayer
• L.ChoroplethDataLayer
• Charts
   – L.PieChartDataLayer
   – L.BarChartDataLayer
   – L.RadialBarChartDataLayer
   – L.CoxcombChartDataLayer
                                                          15
Examples


• USGS Earthquakes
• Meetup Finder
• Election Maps


                           16
USGS Earthquakes


              17
Meetup Finder


           18
Election Maps


           19
Next Steps


• Clean up, simplify, test, and document code
• Write tutorials/blog posts (in the works)
• Consider additional marker and data layer types and
  additional classes/functions for making things easier
• Release code on GitHub


                                                          20
Interested in Using the Framework?


• Look for code to be released on HumanGeo’s GitHub
  site: https://github.com/humangeo
• Watch for updates/tutorials on HumanGeo’s blog:
  http://blog.thehumangeo.com
• Send me an e-mail if you’re interested or want to
  contribute: scott@thehumangeo.com


                                                      21

Mais conteúdo relacionado

Destaque

Big Data and the Social Sciences
Big Data and the Social SciencesBig Data and the Social Sciences
Big Data and the Social SciencesAbe Usher
 
Up and Running with Leaflet.js
Up and Running with Leaflet.jsUp and Running with Leaflet.js
Up and Running with Leaflet.jsPatrick McKinney
 
Data capture with Leaflet and OpenStreetMap
Data capture with Leaflet and OpenStreetMapData capture with Leaflet and OpenStreetMap
Data capture with Leaflet and OpenStreetMapRoss McDonald
 
Of Nodes and Maps (Web Mapping with Drupal - Part II)
Of Nodes and Maps (Web Mapping with Drupal - Part II)Of Nodes and Maps (Web Mapping with Drupal - Part II)
Of Nodes and Maps (Web Mapping with Drupal - Part II)Ranel Padon
 
cf. city flows - A comparative visualization of bike sharing systems
cf. city flows - A comparative visualization of bike sharing systemscf. city flows - A comparative visualization of bike sharing systems
cf. city flows - A comparative visualization of bike sharing systemsTill Nagel
 
BigData Meets the Federal Data Center
BigData Meets the Federal Data CenterBigData Meets the Federal Data Center
BigData Meets the Federal Data CenterAbe Usher
 

Destaque (7)

Big Data and the Social Sciences
Big Data and the Social SciencesBig Data and the Social Sciences
Big Data and the Social Sciences
 
Up and Running with Leaflet.js
Up and Running with Leaflet.jsUp and Running with Leaflet.js
Up and Running with Leaflet.js
 
Data capture with Leaflet and OpenStreetMap
Data capture with Leaflet and OpenStreetMapData capture with Leaflet and OpenStreetMap
Data capture with Leaflet and OpenStreetMap
 
Of Nodes and Maps (Web Mapping with Drupal - Part II)
Of Nodes and Maps (Web Mapping with Drupal - Part II)Of Nodes and Maps (Web Mapping with Drupal - Part II)
Of Nodes and Maps (Web Mapping with Drupal - Part II)
 
cf. city flows - A comparative visualization of bike sharing systems
cf. city flows - A comparative visualization of bike sharing systemscf. city flows - A comparative visualization of bike sharing systems
cf. city flows - A comparative visualization of bike sharing systems
 
BigData Meets the Federal Data Center
BigData Meets the Federal Data CenterBigData Meets the Federal Data Center
BigData Meets the Federal Data Center
 
ATM Locator
ATM LocatorATM Locator
ATM Locator
 

Semelhante a Advanced Web-Based Geospatial Visualization using Leaflet

Introduction to Graph Databases
Introduction to Graph DatabasesIntroduction to Graph Databases
Introduction to Graph DatabasesMax De Marzi
 
Map box styles in GeoServer and OpenLayers
Map box styles in GeoServer and OpenLayersMap box styles in GeoServer and OpenLayers
Map box styles in GeoServer and OpenLayersJody Garnett
 
Using R to Visualize Spatial Data: R as GIS - Guy Lansley
Using R to Visualize Spatial Data: R as GIS - Guy LansleyUsing R to Visualize Spatial Data: R as GIS - Guy Lansley
Using R to Visualize Spatial Data: R as GIS - Guy LansleyGuy Lansley
 
Introduction to graph databases in term of neo4j
Introduction to graph databases in term of neo4jIntroduction to graph databases in term of neo4j
Introduction to graph databases in term of neo4jAbdullah Hamidi
 
8th TUC Meeting - Peter Boncz (CWI). Query Language Task Force status
8th TUC Meeting - Peter Boncz (CWI). Query Language Task Force status8th TUC Meeting - Peter Boncz (CWI). Query Language Task Force status
8th TUC Meeting - Peter Boncz (CWI). Query Language Task Force statusLDBC council
 
Apdm 101 Arc Gis Pipeline Data Model (1)
Apdm 101 Arc Gis Pipeline Data Model  (1)Apdm 101 Arc Gis Pipeline Data Model  (1)
Apdm 101 Arc Gis Pipeline Data Model (1)David Nichter, GISP
 
Data Processing over very Large Relational Databases
Data Processing over very Large Relational DatabasesData Processing over very Large Relational Databases
Data Processing over very Large Relational Databaseskvaderlipa
 
Graph Databases
Graph DatabasesGraph Databases
Graph Databasesthai
 
Building a Flexible UI with Oracle ApEx
Building a Flexible UI with Oracle ApExBuilding a Flexible UI with Oracle ApEx
Building a Flexible UI with Oracle ApExBradley Brown
 
CSC 8101 Non Relational Databases
CSC 8101 Non Relational DatabasesCSC 8101 Non Relational Databases
CSC 8101 Non Relational Databasessjwoodman
 
Graph Abstractions Matter by Ora Lassila
Graph Abstractions Matter by Ora LassilaGraph Abstractions Matter by Ora Lassila
Graph Abstractions Matter by Ora LassilaConnected Data World
 
1st UIM-GDB - Connections to the Real World
1st UIM-GDB - Connections to the Real World1st UIM-GDB - Connections to the Real World
1st UIM-GDB - Connections to the Real WorldAchim Friedland
 
LoCloud Geolocation enrichment tools, Siri Slettvag, Asplan Viak Internet (Av...
LoCloud Geolocation enrichment tools, Siri Slettvag, Asplan Viak Internet (Av...LoCloud Geolocation enrichment tools, Siri Slettvag, Asplan Viak Internet (Av...
LoCloud Geolocation enrichment tools, Siri Slettvag, Asplan Viak Internet (Av...locloud
 
Geolocation: Improving our BI solutions with SharePoint
Geolocation: Improving our BI solutions with SharePointGeolocation: Improving our BI solutions with SharePoint
Geolocation: Improving our BI solutions with SharePointRuben Pertusa Lopez
 
FOSDEM 2014: Social Network Benchmark (SNB) Graph Generator
FOSDEM 2014:  Social Network Benchmark (SNB) Graph GeneratorFOSDEM 2014:  Social Network Benchmark (SNB) Graph Generator
FOSDEM 2014: Social Network Benchmark (SNB) Graph GeneratorLDBC council
 

Semelhante a Advanced Web-Based Geospatial Visualization using Leaflet (20)

Introduction to Graph Databases
Introduction to Graph DatabasesIntroduction to Graph Databases
Introduction to Graph Databases
 
Map box styles in GeoServer and OpenLayers
Map box styles in GeoServer and OpenLayersMap box styles in GeoServer and OpenLayers
Map box styles in GeoServer and OpenLayers
 
Using R to Visualize Spatial Data: R as GIS - Guy Lansley
Using R to Visualize Spatial Data: R as GIS - Guy LansleyUsing R to Visualize Spatial Data: R as GIS - Guy Lansley
Using R to Visualize Spatial Data: R as GIS - Guy Lansley
 
UNit4.pdf
UNit4.pdfUNit4.pdf
UNit4.pdf
 
Introduction to graph databases in term of neo4j
Introduction to graph databases in term of neo4jIntroduction to graph databases in term of neo4j
Introduction to graph databases in term of neo4j
 
8th TUC Meeting - Peter Boncz (CWI). Query Language Task Force status
8th TUC Meeting - Peter Boncz (CWI). Query Language Task Force status8th TUC Meeting - Peter Boncz (CWI). Query Language Task Force status
8th TUC Meeting - Peter Boncz (CWI). Query Language Task Force status
 
Apdm 101 Arc Gis Pipeline Data Model (1)
Apdm 101 Arc Gis Pipeline Data Model  (1)Apdm 101 Arc Gis Pipeline Data Model  (1)
Apdm 101 Arc Gis Pipeline Data Model (1)
 
Lecture3
Lecture3Lecture3
Lecture3
 
Data Processing over very Large Relational Databases
Data Processing over very Large Relational DatabasesData Processing over very Large Relational Databases
Data Processing over very Large Relational Databases
 
Graph Databases
Graph DatabasesGraph Databases
Graph Databases
 
Building a Flexible UI with Oracle ApEx
Building a Flexible UI with Oracle ApExBuilding a Flexible UI with Oracle ApEx
Building a Flexible UI with Oracle ApEx
 
Graph Databases
Graph DatabasesGraph Databases
Graph Databases
 
CSC 8101 Non Relational Databases
CSC 8101 Non Relational DatabasesCSC 8101 Non Relational Databases
CSC 8101 Non Relational Databases
 
Graph Abstractions Matter by Ora Lassila
Graph Abstractions Matter by Ora LassilaGraph Abstractions Matter by Ora Lassila
Graph Abstractions Matter by Ora Lassila
 
Grails goes Graph
Grails goes GraphGrails goes Graph
Grails goes Graph
 
1st UIM-GDB - Connections to the Real World
1st UIM-GDB - Connections to the Real World1st UIM-GDB - Connections to the Real World
1st UIM-GDB - Connections to the Real World
 
LoCloud Geolocation enrichment tools, Siri Slettvag, Asplan Viak Internet (Av...
LoCloud Geolocation enrichment tools, Siri Slettvag, Asplan Viak Internet (Av...LoCloud Geolocation enrichment tools, Siri Slettvag, Asplan Viak Internet (Av...
LoCloud Geolocation enrichment tools, Siri Slettvag, Asplan Viak Internet (Av...
 
Geolocation: Improving our BI solutions with SharePoint
Geolocation: Improving our BI solutions with SharePointGeolocation: Improving our BI solutions with SharePoint
Geolocation: Improving our BI solutions with SharePoint
 
FOSDEM 2014: Social Network Benchmark (SNB) Graph Generator
FOSDEM 2014:  Social Network Benchmark (SNB) Graph GeneratorFOSDEM 2014:  Social Network Benchmark (SNB) Graph Generator
FOSDEM 2014: Social Network Benchmark (SNB) Graph Generator
 
GraphDatabases
GraphDatabasesGraphDatabases
GraphDatabases
 

Último

Strategies for Landing an Oracle DBA Job as a Fresher
Strategies for Landing an Oracle DBA Job as a FresherStrategies for Landing an Oracle DBA Job as a Fresher
Strategies for Landing an Oracle DBA Job as a FresherRemote DBA Services
 
Apidays New York 2024 - Accelerating FinTech Innovation by Vasa Krishnan, Fin...
Apidays New York 2024 - Accelerating FinTech Innovation by Vasa Krishnan, Fin...Apidays New York 2024 - Accelerating FinTech Innovation by Vasa Krishnan, Fin...
Apidays New York 2024 - Accelerating FinTech Innovation by Vasa Krishnan, Fin...apidays
 
A Year of the Servo Reboot: Where Are We Now?
A Year of the Servo Reboot: Where Are We Now?A Year of the Servo Reboot: Where Are We Now?
A Year of the Servo Reboot: Where Are We Now?Igalia
 
Apidays New York 2024 - The value of a flexible API Management solution for O...
Apidays New York 2024 - The value of a flexible API Management solution for O...Apidays New York 2024 - The value of a flexible API Management solution for O...
Apidays New York 2024 - The value of a flexible API Management solution for O...apidays
 
"I see eyes in my soup": How Delivery Hero implemented the safety system for ...
"I see eyes in my soup": How Delivery Hero implemented the safety system for ..."I see eyes in my soup": How Delivery Hero implemented the safety system for ...
"I see eyes in my soup": How Delivery Hero implemented the safety system for ...Zilliz
 
Web Form Automation for Bonterra Impact Management (fka Social Solutions Apri...
Web Form Automation for Bonterra Impact Management (fka Social Solutions Apri...Web Form Automation for Bonterra Impact Management (fka Social Solutions Apri...
Web Form Automation for Bonterra Impact Management (fka Social Solutions Apri...Jeffrey Haguewood
 
Strategize a Smooth Tenant-to-tenant Migration and Copilot Takeoff
Strategize a Smooth Tenant-to-tenant Migration and Copilot TakeoffStrategize a Smooth Tenant-to-tenant Migration and Copilot Takeoff
Strategize a Smooth Tenant-to-tenant Migration and Copilot Takeoffsammart93
 
Connector Corner: Accelerate revenue generation using UiPath API-centric busi...
Connector Corner: Accelerate revenue generation using UiPath API-centric busi...Connector Corner: Accelerate revenue generation using UiPath API-centric busi...
Connector Corner: Accelerate revenue generation using UiPath API-centric busi...DianaGray10
 
EMPOWERMENT TECHNOLOGY GRADE 11 QUARTER 2 REVIEWER
EMPOWERMENT TECHNOLOGY GRADE 11 QUARTER 2 REVIEWEREMPOWERMENT TECHNOLOGY GRADE 11 QUARTER 2 REVIEWER
EMPOWERMENT TECHNOLOGY GRADE 11 QUARTER 2 REVIEWERMadyBayot
 
GenAI Risks & Security Meetup 01052024.pdf
GenAI Risks & Security Meetup 01052024.pdfGenAI Risks & Security Meetup 01052024.pdf
GenAI Risks & Security Meetup 01052024.pdflior mazor
 
Apidays Singapore 2024 - Modernizing Securities Finance by Madhu Subbu
Apidays Singapore 2024 - Modernizing Securities Finance by Madhu SubbuApidays Singapore 2024 - Modernizing Securities Finance by Madhu Subbu
Apidays Singapore 2024 - Modernizing Securities Finance by Madhu Subbuapidays
 
Apidays New York 2024 - The Good, the Bad and the Governed by David O'Neill, ...
Apidays New York 2024 - The Good, the Bad and the Governed by David O'Neill, ...Apidays New York 2024 - The Good, the Bad and the Governed by David O'Neill, ...
Apidays New York 2024 - The Good, the Bad and the Governed by David O'Neill, ...apidays
 
Data Cloud, More than a CDP by Matt Robison
Data Cloud, More than a CDP by Matt RobisonData Cloud, More than a CDP by Matt Robison
Data Cloud, More than a CDP by Matt RobisonAnna Loughnan Colquhoun
 
DBX First Quarter 2024 Investor Presentation
DBX First Quarter 2024 Investor PresentationDBX First Quarter 2024 Investor Presentation
DBX First Quarter 2024 Investor PresentationDropbox
 
Boost Fertility New Invention Ups Success Rates.pdf
Boost Fertility New Invention Ups Success Rates.pdfBoost Fertility New Invention Ups Success Rates.pdf
Boost Fertility New Invention Ups Success Rates.pdfsudhanshuwaghmare1
 
Exploring the Future Potential of AI-Enabled Smartphone Processors
Exploring the Future Potential of AI-Enabled Smartphone ProcessorsExploring the Future Potential of AI-Enabled Smartphone Processors
Exploring the Future Potential of AI-Enabled Smartphone Processorsdebabhi2
 
Apidays New York 2024 - Scaling API-first by Ian Reasor and Radu Cotescu, Adobe
Apidays New York 2024 - Scaling API-first by Ian Reasor and Radu Cotescu, AdobeApidays New York 2024 - Scaling API-first by Ian Reasor and Radu Cotescu, Adobe
Apidays New York 2024 - Scaling API-first by Ian Reasor and Radu Cotescu, Adobeapidays
 
Axa Assurance Maroc - Insurer Innovation Award 2024
Axa Assurance Maroc - Insurer Innovation Award 2024Axa Assurance Maroc - Insurer Innovation Award 2024
Axa Assurance Maroc - Insurer Innovation Award 2024The Digital Insurer
 
Manulife - Insurer Transformation Award 2024
Manulife - Insurer Transformation Award 2024Manulife - Insurer Transformation Award 2024
Manulife - Insurer Transformation Award 2024The Digital Insurer
 

Último (20)

Strategies for Landing an Oracle DBA Job as a Fresher
Strategies for Landing an Oracle DBA Job as a FresherStrategies for Landing an Oracle DBA Job as a Fresher
Strategies for Landing an Oracle DBA Job as a Fresher
 
Apidays New York 2024 - Accelerating FinTech Innovation by Vasa Krishnan, Fin...
Apidays New York 2024 - Accelerating FinTech Innovation by Vasa Krishnan, Fin...Apidays New York 2024 - Accelerating FinTech Innovation by Vasa Krishnan, Fin...
Apidays New York 2024 - Accelerating FinTech Innovation by Vasa Krishnan, Fin...
 
A Year of the Servo Reboot: Where Are We Now?
A Year of the Servo Reboot: Where Are We Now?A Year of the Servo Reboot: Where Are We Now?
A Year of the Servo Reboot: Where Are We Now?
 
Apidays New York 2024 - The value of a flexible API Management solution for O...
Apidays New York 2024 - The value of a flexible API Management solution for O...Apidays New York 2024 - The value of a flexible API Management solution for O...
Apidays New York 2024 - The value of a flexible API Management solution for O...
 
"I see eyes in my soup": How Delivery Hero implemented the safety system for ...
"I see eyes in my soup": How Delivery Hero implemented the safety system for ..."I see eyes in my soup": How Delivery Hero implemented the safety system for ...
"I see eyes in my soup": How Delivery Hero implemented the safety system for ...
 
Web Form Automation for Bonterra Impact Management (fka Social Solutions Apri...
Web Form Automation for Bonterra Impact Management (fka Social Solutions Apri...Web Form Automation for Bonterra Impact Management (fka Social Solutions Apri...
Web Form Automation for Bonterra Impact Management (fka Social Solutions Apri...
 
Strategize a Smooth Tenant-to-tenant Migration and Copilot Takeoff
Strategize a Smooth Tenant-to-tenant Migration and Copilot TakeoffStrategize a Smooth Tenant-to-tenant Migration and Copilot Takeoff
Strategize a Smooth Tenant-to-tenant Migration and Copilot Takeoff
 
Connector Corner: Accelerate revenue generation using UiPath API-centric busi...
Connector Corner: Accelerate revenue generation using UiPath API-centric busi...Connector Corner: Accelerate revenue generation using UiPath API-centric busi...
Connector Corner: Accelerate revenue generation using UiPath API-centric busi...
 
EMPOWERMENT TECHNOLOGY GRADE 11 QUARTER 2 REVIEWER
EMPOWERMENT TECHNOLOGY GRADE 11 QUARTER 2 REVIEWEREMPOWERMENT TECHNOLOGY GRADE 11 QUARTER 2 REVIEWER
EMPOWERMENT TECHNOLOGY GRADE 11 QUARTER 2 REVIEWER
 
GenAI Risks & Security Meetup 01052024.pdf
GenAI Risks & Security Meetup 01052024.pdfGenAI Risks & Security Meetup 01052024.pdf
GenAI Risks & Security Meetup 01052024.pdf
 
+971581248768>> SAFE AND ORIGINAL ABORTION PILLS FOR SALE IN DUBAI AND ABUDHA...
+971581248768>> SAFE AND ORIGINAL ABORTION PILLS FOR SALE IN DUBAI AND ABUDHA...+971581248768>> SAFE AND ORIGINAL ABORTION PILLS FOR SALE IN DUBAI AND ABUDHA...
+971581248768>> SAFE AND ORIGINAL ABORTION PILLS FOR SALE IN DUBAI AND ABUDHA...
 
Apidays Singapore 2024 - Modernizing Securities Finance by Madhu Subbu
Apidays Singapore 2024 - Modernizing Securities Finance by Madhu SubbuApidays Singapore 2024 - Modernizing Securities Finance by Madhu Subbu
Apidays Singapore 2024 - Modernizing Securities Finance by Madhu Subbu
 
Apidays New York 2024 - The Good, the Bad and the Governed by David O'Neill, ...
Apidays New York 2024 - The Good, the Bad and the Governed by David O'Neill, ...Apidays New York 2024 - The Good, the Bad and the Governed by David O'Neill, ...
Apidays New York 2024 - The Good, the Bad and the Governed by David O'Neill, ...
 
Data Cloud, More than a CDP by Matt Robison
Data Cloud, More than a CDP by Matt RobisonData Cloud, More than a CDP by Matt Robison
Data Cloud, More than a CDP by Matt Robison
 
DBX First Quarter 2024 Investor Presentation
DBX First Quarter 2024 Investor PresentationDBX First Quarter 2024 Investor Presentation
DBX First Quarter 2024 Investor Presentation
 
Boost Fertility New Invention Ups Success Rates.pdf
Boost Fertility New Invention Ups Success Rates.pdfBoost Fertility New Invention Ups Success Rates.pdf
Boost Fertility New Invention Ups Success Rates.pdf
 
Exploring the Future Potential of AI-Enabled Smartphone Processors
Exploring the Future Potential of AI-Enabled Smartphone ProcessorsExploring the Future Potential of AI-Enabled Smartphone Processors
Exploring the Future Potential of AI-Enabled Smartphone Processors
 
Apidays New York 2024 - Scaling API-first by Ian Reasor and Radu Cotescu, Adobe
Apidays New York 2024 - Scaling API-first by Ian Reasor and Radu Cotescu, AdobeApidays New York 2024 - Scaling API-first by Ian Reasor and Radu Cotescu, Adobe
Apidays New York 2024 - Scaling API-first by Ian Reasor and Radu Cotescu, Adobe
 
Axa Assurance Maroc - Insurer Innovation Award 2024
Axa Assurance Maroc - Insurer Innovation Award 2024Axa Assurance Maroc - Insurer Innovation Award 2024
Axa Assurance Maroc - Insurer Innovation Award 2024
 
Manulife - Insurer Transformation Award 2024
Manulife - Insurer Transformation Award 2024Manulife - Insurer Transformation Award 2024
Manulife - Insurer Transformation Award 2024
 

Advanced Web-Based Geospatial Visualization using Leaflet

  • 1. Advanced Web-Based Geospatial Visualization using Leaflet Intel Analytics DC Dec. 11, 2012 Scott Fairgrieve
  • 2. Agenda • Web mapping challenges • Leaflet Overview • Overview of HumanGeo’s Leaflet Data Visualization Framework • Examples • Next Steps 2
  • 3. Challenges • Deciding what mapping framework to use – There are lots of options (Google Maps, Bing, Yahoo, OpenLayers, etc.), each with its own API – This presentation focuses on Leaflet • Understanding the structure/format of the data that’s going to be visualized – Is it web map/JavaScript friendly? – Does it work well with the mapping framework you’ve chosen? – Will you always be dealing with the same format? – Integrating data from a variety of sources typically requires custom code or code to standardize formats • Lots of different ways of specifying location: lat/lon, grid formats, addresses, country/state codes, city names, etc. – Handling location formats other than lat/lon can be difficult and often requires additional web services 3
  • 4. Visualizing Data on a 2D (Web) Map • Want to highlight variations in data • Typical approach: Vary the styling of points, lines, and polygons based on one or more values of the data • Primary options – Marker Size/Radius – Color/Fill Color • Other options – Line weight – useful when illustrating variation between line features – Opacity – useful for illustrating time, counts, etc. – Polygons – filled vs. empty, border vs. no border – Line style – dashed vs. solid 4
  • 5. Examples – USGS Earthquakes Map http://earthquake.usgs.gov/earthquakes/map/
  • 6. Examples – Choropleth/Infographics Bill and Melinda Gates Foundation Bureau of Education and Cultural Affairs EngineYard.com 6
  • 7. Leaflet Overview • Developed by CloudMade • Relatively new (first released in 2011) • Simple compared to other JavaScript web mapping frameworks  a pro and a con • Smooth animation and works well on mobile devices • Pretty good documentation/examples • http://leafletjs.com/index.html 7
  • 8. Leaflet Basic Options • Displaying point, line, and polygon features – L.Marker and L.Marker w/ L.DivIcon – L.CircleMarker – L.Polyline – L.Polygon • Loading data – L.GeoJSON Images from the Leaflet website 8
  • 9. Leaflet Vector Layers • Leaflet is Scalable Vector Graphics (SVG) based • Behind the scenes, non-image based markers are drawn using an SVG path element <path [path attributes] d=”[path data (e.g. M548 254L548 49L676 49L676 254L548 254z)]"></path> • Leaflet style options are mapped to path attributes • Style options include: color, fillColor, opacity, fillOpacity, weight, dashArray, stroke, fill, radius • We can create custom markers dynamically by inheriting from the L.Path class 9
  • 10. HumanGeo’s Leaflet Data Visualization Framework • Started as a side project (a few hours per week) • A work in progress (still in the alpha phase) • Goals: – Enable cool, interactive, infographic style visualizations – Support displaying data in any JSON-based data format – Eliminate redundant code/tasks related to displaying data – Standardize the way in which data are loaded/displayed – Minimize dependency on server-side components for typical use cases (e.g. visualizing data by state or country) – Remain consistent with Leaflet’s coding style 10
  • 11. Color – RGB • Most of us are familiar with RGB color, but it’s not always the best approach • What color is this? rgb(213,154,10) or #D59A0A Gold • Hue, Saturation, Luminosity/Lightness or HSL color provides a more intuitive color definition than RGB and is great for scientific visualizations/geo analytics 11
  • 12. Color - HSL • Hue represents a degree <L H >L R G B value on the color wheel 0 255 0 0 – Varies according to the colors 30 255 127 0 of the visible spectrum – the 60 255 255 0 rainbow ROYGBIV pattern that is familiar to most people 90 127 255 0 • Saturation represents the 120 45 255 0 percentage of the given hue 150 45 255 84 that is present in a color: 180 43 255 255 – 0% = gray 210 13 95 255 – 100% = full hue 240 0 0 255 • Luminosity represents the 270 99 0 255 percentage of lightness in a 300 249 0 255 color: 330 249 0 112 – 0% = black 360 255 0 0 – 50% = hue – 100% = white Source: Wikipedia 12
  • 13. Framework Basics – Linear Functions for Dynamic Styling • y = mx + b • Useful for varying one property linearly with respect to another property (e.g. mapping temperature to marker radius) – x = data property – y = style property • Numeric properties (radius, weight, opacity, fillOpacity)  L.LinearFunction Image Source: Wikipedia • color, fillColor  L.HSLHueFunction, L.HSLLuminosityFunction, L.HSLSaturationFunction, other color function classes 13
  • 14. Framework Basics – New Marker Types • L.RegularPolygonMarker • Charts: – L.PieChartMarker – L.BarChartMarker – L.RadialBarChartMarker – L.CoxcombChartMarker – L.RadialMeterMarker 14
  • 15. Framework Basics – Data Layers • L.DataLayer – Automates the work of displaying data regardless of the structure of the data – Handles country codes, state codes, and custom location formats in addition to lat/lon – Provides a legend for free • L.MarkerDataLayer • L.ChoroplethDataLayer • Charts – L.PieChartDataLayer – L.BarChartDataLayer – L.RadialBarChartDataLayer – L.CoxcombChartDataLayer 15
  • 16. Examples • USGS Earthquakes • Meetup Finder • Election Maps 16
  • 20. Next Steps • Clean up, simplify, test, and document code • Write tutorials/blog posts (in the works) • Consider additional marker and data layer types and additional classes/functions for making things easier • Release code on GitHub 20
  • 21. Interested in Using the Framework? • Look for code to be released on HumanGeo’s GitHub site: https://github.com/humangeo • Watch for updates/tutorials on HumanGeo’s blog: http://blog.thehumangeo.com • Send me an e-mail if you’re interested or want to contribute: scott@thehumangeo.com 21