Recomendados

Recomendados
Mais conteúdo relacionado
Destaque
Destaque (13)
Semelhante a 1 supply demand data
Mais de hfonfe
Mais de hfonfe (20)
1 supply demand data
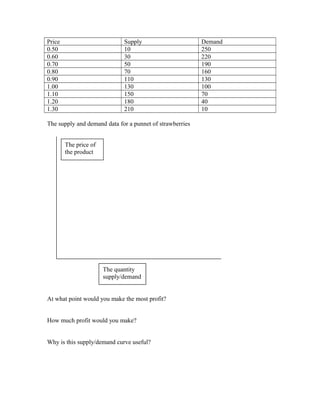
- 1. Price Supply Demand 0.50 10 250 0.60 30 220 0.70 50 190 0.80 70 160 0.90 110 130 1.00 130 100 1.10 150 70 1.20 180 40 1.30 210 10 The supply and demand data for a punnet of strawberries The price of the product The quantity supply/demand At what point would you make the most profit? How much profit would you make? Why is this supply/demand curve useful?