
Recomendados
Mais conteúdo relacionado
Mais procurados
Mais procurados (12)
Semelhante a Effect of colour of light on the rate of photosynthesis
Semelhante a Effect of colour of light on the rate of photosynthesis (20)
Mais de heejjung
Último
Último (20)
Effect of colour of light on the rate of photosynthesis
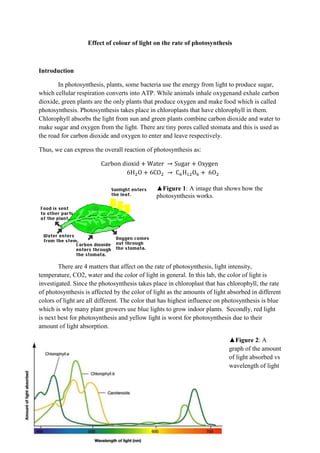
- 1. Effect of colour of light on the rate of photosynthesis Introduction In photosynthesis, plants, some bacteria use the energy from light to produce sugar, which cellular respiration converts into ATP. While animals inhale oxygenand exhale carbon dioxide, green plants are the only plants that produce oxygen and make food which is called photosynthesis. Photosynthesis takes place in chloroplasts that have chlorophyll in them. Chlorophyll absorbs the light from sun and green plants combine carbon dioxide and water to make sugar and oxygen from the light. There are tiny pores called stomata and this is used as the road for carbon dioxide and oxygen to enter and leave respectively. Thus, we can express the overall reaction of photosynthesis as: ▲ 1: A image that shows how the photosynthesis works. There are 4 matters that affect on the rate of photosynthesis, light intensity, temperature, CO2, water and the color of light in general. In this lab, the color of light is investigated. Since the photosynthesis takes place in chloroplast that has chlorophyll, the rate of photosynthesis is affected by the color of light as the amounts of light absorbed in different colors of light are all different. The color that has highest influence on photosynthesis is blue which is why many plant growers use blue lights to grow indoor plants. Secondly, red light is next best for photosynthesis and yellow light is worst for photosynthesis due to their amount of light absorption. ▲ 2: A graph of the amount of light absorbed vs wavelength of light
- 2. In this lab, the times when the first 10 discs float are collected to get the rate of photosynthesis. The reason why discs of leaf were used is that that a disc floats means the disc was already photosynthesized since the disc absorb CO2 during the photosynthesis. The floating of discs is possible since the oxygen in the discs was taken out through the step of pulling out the syringes with discs and water in them. The picture below shows the detail of this step. ▲ 3: The image above shows how the steps with syringe work Research question: Does the colour of light affects the rate of photosynthesis? Hypothesis: The graph of the rate of photosynthesis would look like the one of absorption of chloroplast pigments which means the rate with green light will be the lowest one while the rate with blue will be the highest one. Variables Variable Type How Light intensity Controlled Using light intensity measurer, logger pro and Microsoft office excel, set around 706 lux. Colour of leaves Controlled From same kind of plants in same area with same color with eyes. Concentration of sodium Controlled With electronic scale, bicarbonate cylinder The rate of photosynthesis Dependent Changed by the colour of water, collected with stop watch Colour of water Independent With food colors and water
- 3. Materials Leaves, hole puncher, syringes without any needles, beakers, aquarium, light, logger pro, light intensity measurer, ring stand, time watch, ruler, sodium bicarbonate, bowl, plates, electronic scales, stick and cylinder. Procedure 1. Get leave with same colour and make 60 discs from them with hole puncher 2. Put discs of leave into syringes block the entrance that needles used to be and pull the syringe out to remove the air in the leaves. 3. If all leaves sink down in the syringes, put all discs of leaves at a bowl so that the leaves are mixed and will be picked randomly later. Put the bowl somewhere that the light is completely blocked so that the leaves do not photosynthesis. 4. To make three different color of water, food color of red, green and blue and the water were put until the light intensity reaches same amount. Light intensity measurer and logger pro were used in this step. Using, logger pro and light intensity measurer, the amount of light intensity during certain term was collected and the average of them was considered as the light intensity of the light with the colors. (706 lux in this lab) 5. After getting all 4 colors of water, set a beaker with 2% of sodium bicarbonate solution which is with 100ml and 2g of sodium bicarbonate. 6. Take out 15 discs from the bowl, put into the beaker, immediately place the beaker in front of aquarium with color water and turn on the light.
- 4. 7. Start to collect time when the first ten discs float. 8. Repeat this steps (5 through 7) with all three colors, green, red and blue. 9. While collecting data with plain water, to make the light intensity same as the one with color, move the light until we get the certain light intensity, (in this lab, 706 lux with the distance of 22 cm between the light and the aquarium) 10. Same as the steps with colors set a beaker with 100 ml and 2g of sodium bicarbonate. Put 15 discs into the beaker, immediately place the beaker in front of the aquarium with plain water and turn on the light. 11. Collect time when the first ten discs float. Data collection and processing Recorded times for leaf discs rising for different colors - Trial 1 (seconds) ( ) Blue Green Red Plain 1 80 170 209 172 2 80 375 333 183 3 89 377 340 184 4 97 380 349 462 5 102 398 367 510 6 121 516 380 546 7 124 642 381 565 8 138 820 381 565 9 152 899 558 612 10 162 1005 558 694 ▲Table 1: This is the time that it took for the first 10 leaf discs to rise when exposed to light while submerged in water. (One of 3 trials) Observation: The blue light has the fastest time for leaf discs rising among four different colors of lights which means that the discs are photosynthesized in blue lights most rapidly.
- 5. The average of recorded times of leaf discs to rise (seconds) ( Blue Green red Plain First trial 114.5 558.2 385.6 449.3 Second trial 113.8 500.8 402.5 429.1 Third trial 116.7 535.7 403.9 381.0 ▲Table 2: This is the average of times for leaf discs to rise for three trials in four different colors of lights Observation: The discs are photosynthesized most rapidly in blue lights while those in green rights are photosynthesized most slowly. Sample calculation: To get the average of each blues add all times and divide by the number of discs (10 in this lab) In equation form, The rate of the average of recorded times of leaf discs for rising ()( Blue Green Red Plain The rate Trial 1 0.087 0.017 0.026 0.022 of Trial 2 0.088 0.019 0.025 0.023 photosynt hesis Trial 3 0.086 0.018 0.025 0.026 ▲Table 3: This indicates the rate of the recorded times of leaf discs for rising in four different color of water. Observation: The rate of blue is Sample calculation: To get the rate of the average of recorded times of leaf discs for rising, Colors Average of recorded times of leaf discs for rising (sec) Blue Green Red Plain