
Recomendados
Mais conteúdo relacionado
Mais procurados
Mais procurados (20)
Semelhante a 3 pm3 t_4%20-%20schedule%20development
Semelhante a 3 pm3 t_4%20-%20schedule%20development (20)
Mais de harwoodr
Mais de harwoodr (12)
Último
Último (20)
3 pm3 t_4%20-%20schedule%20development
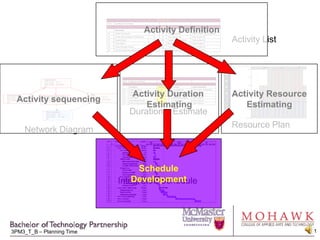
- 1. Activity Definition Activity List Resource Plan Activity sequencing Activity Resource Estimating Activity Duration Estimating Duration Estimate Network Diagram Schedule Development Integrated Schedule
- 2. Making a Schedule that “Works” Identify schedule “problems” Incorrect activity definition: work packages vs activities Incorrect sequencing: Unhealthy networks Over-allocated resources: resource levelling Making the schedule “useful” “Just in time” scheduling: The Rolling Wave Getting done on time Making status visible: Reports and Milestones The final product is the Time Management Plan called the “Integrated Schedule”
- 3. Activities vs. Work Packages Activities describe the processes performed to complete all the “work” in the Work Package
- 4. Activities vs Work Packages Example: Work Package = Qualification Test Report Activities: Collate Test Results Provide Data Package to Publications Prepare Report Check Report Project Manager Review Submit through Data Management
- 5. The “reality check” Once the links are entered, they should form a complete network Everything ties in to “something” As much as possible, all the “loose ends” tie back together at the end
- 6. Resource Levelling When the “ideal” schedule is viewed to check the “resource usage”, many resources maybe “overutilized” Example: If you have only one carpenter, you can’t have “Saw table legs” happen at the same time as “Assemble chair back” This is usually showed via a “histogram” that plots resource demand over time vs. the defined team size
- 7. Options for dealing for overutilized resources Negotiate increased resources with functional manager Increase “productivity” through overtime, or procurement of enabling technology Consider options for work re-allocation: Outsourcing Work segmentation to allow partial performance by another under-utilized function (eg. Getting an Admin Assistant to perform “clerical” tasks of writing a technical report) “Resource levelling” = re-arranging existing program resources and task sequence to minimize impacts to the “critical path” – delay “non-critical” tasks with conflicting resources
- 8. “Rolling Wave” Schedule Definition Some projects can be scheduled in detail at the beginning: Repeat of previous projects (eg. Building a house) Technology well understood, with little chance for environmental impact (eg. Database design) For many projects, however, only near term tasks are scheduled in detail: Technology not well developed or developed during project (eg.cold fusion reactor) Project involves significant “trade studies” or selection of alternative approaches (eg. Project to “develop corporate network” – Client/server vs. stand-alone? Mac vs. PC? Wireless vs broadband?) Project is lengthy and act of activity definition is a significant cost driver Latter using “Rolling Wave” scheduling
- 9. “Rolling Wave” Definition Near term/known events scheduled and resource loaded in detail to “activity” level Longer term activities scheduled at increasingly reduced levels of detail Depending on risk reduction philosophy, these may either have no budget/ resources allocated, or may be “lumped” as “Planning Packages”
- 10. Techniques for Shortening a Project Schedule Focus on the Critical Path Crashing: shortening the “calendar” duration of a task Apply more resources Apply overtime Introduce enabling technologies, eg. Automation “re-design” the work (eg. Current process requires 4 approvals – change process to require 2) Fast tracking: doing tasks - normally done in sequence - in parallel Eg. you eat breakfast, then drive to work eat breakfast while driving Eg. Test product, then ship it perform “minimum”/safety-critical tests and ship while completing remainder Remember the “Constraint Triangle”, any schedule reduction means: Cost, scope or quality trade-off Risk impact – especially when fast-tracking
- 11. Shortening Project Schedules Original schedule Crashing Shortenedduration Fast tracking Overlapped tasks
- 12. Milestones Milestones = zero duration tasks inserted into the schedule to provide visibility to key dates May be mandated by contract or management, at PM discretion or both Location: “Milestone” section at the top of the project Provides immediate summary of program goals and status Easy access for changing and “What-if” analyses “Embedded” in the related task path if needed to clarify inputs critical to that path Definition methods: “Hard dates”: Typed in as a “date” no “driving” dependencies Used to flow information “into” the schedule “Status Dates”: Hooked on to the end of a task network leading up to the state to be tracked Used to flow information “out of” the schedule
- 13. Application of Milestones Flow “down” key commitments from the contract/program plan (eg. First shipment; inputs to customer activities) “Hard” dates in the “milestone” section Flow “up” estimated completion dates (eg. Design complete; Foundation complete) “Status” dates usually embedded in schedule Indicate “external” inputs to the program from other schedules or program entities (eg. Parts available from supplier; test equipment available in shared facility) “Hard” dates embedded or at the top Measurement of performance – discussed in integration section Estimated vs committed “Burndown” Earned Value recognition Contractual basis for invoicing progress payments Usually attached to the “key commitments”
- 14. Schedule Reports the “schedule” is actually a database that integrates task cost, time and logic – often called: integrated schedule Integrated master schedule Cost/budget Can be used to generate various views and reports: WBS (sometimes) Network diagram (PERT chart) “Schedule” (GANTT chart) Resource/cost profiles