SlideShare uma empresa Scribd logo
1 de 10
Baixar para ler offline
FSD Advieskaart                                                    Totaaloverzicht

                                                                                  Onroerend           Hypotheek               Huur
      Jaar              Aandelen           Obligaties          Deposito's                                                                           Inflatie
                                                                                    goed                rente                prijzen

      1969                -3,20%              -1,20%               7,80%              10,70%               7,10%              7,69%                  7,50%
      1970                -4,00%               9,50%               8,00%               4,90%               8,00%              3,57%                  4,40%
      1971                -5,40%               7,70%               5,30%               2,00%               8,30%              10,34%                 7,60%
      1972                32,70%               8,80%               3,00%              13,60%               7,90%              6,25%                  7,80%
      1973                -12,70%             -2,40%               6,90%               6,30%               8,00%              8,82%                  8,00%
      1974                -16,70%              9,80%              10,40%              15,00%               9,60%              8,11%                  9,60%
      1975                51,30%              12,00%               5,30%              15,80%               9,30%              5,00%                 10,20%
      1976                 7,60%               9,40%               6,90%              28,60%               8,80%              14,29%                 8,80%
      1977                10,80%              11,40%               4,60%              39,70%               8,70%              6,25%                  6,70%
      1978                 7,50%               5,10%               6,50%               7,70%               8,30%              5,88%                  4,10%
      1979                13,00%               2,60%               9,50%              -5,50%               9,10%              7,41%                  4,20%
      1980                19,20%               3,10%              10,70%              -8,60%              10,20%              6,90%                  6,50%
      1981                -0,60%               6,10%              11,60%             -10,30%              10,90%              8,06%                  6,70%
      1982                24,10%              30,20%               8,40%             -10,00%              10,00%              8,96%                  6,00%
      1983                60,50%               6,10%               5,60%               2,90%               8,30%              8,22%                  2,80%
      1984                28,10%              15,50%               6,10%              -1,80%               8,30%              5,06%                  3,30%
      1985                33,10%              11,00%               6,30%               0,40%               7,80%              3,61%                  2,30%
      1986                 9,50%              10,90%               5,60%               4,48%               7,00%              3,49%                  0,20%
      1987                -17,90%              6,00%               5,30%               3,65%               7,00%              2,25%                 -0,50%
      1988                35,20%               5,10%               4,70%               4,44%               6,90%              3,30%                  0,70%
      1989                27,50%              -2,60%               7,30%               6,16%               7,60%              3,19%                  1,10%
      1990                -13,10%              1,40%               8,60%               2,07%               8,70%              3,09%                  2,50%
      1991                18,70%              12,60%               9,20%               2,57%               9,20%              4,00%                  3,90%
      1992                 7,90%              16,40%               9,30%               8,44%               8,80%              5,77%                  3,70%
      1993                47,20%              16,70%               6,80%              10,46%               7,50%              5,45%                  2,10%
      1994                 2,30%              -5,90%               5,10%               8,37%               7,30%              5,17%                  2,70%
      1995                19,80%              20,90%               4,30%               4,07%               7,10%              4,92%                  2,00%
      1996                40,30%               9,20%               3,00%              10,06%               6,30%              4,20%                  2,10%
      1997                44,90%               9,50%               3,30%               8,78%               5,80%              3,80%                  2,20%
      1998                22,30%              10,60%               3,40%               8,40%               5,20%              3,40%                  2,00%
      1999                31,00%              -1,40%               2,90%              18,06%               4,80%              3,00%                  2,20%
      2000                -2,10%               6,50%               4,20%              15,11%               5,40%              2,60%                  2,60%
      2001                -19,20%              6,00%               4,30%               7,42%               5,80%              2,70%                  4,50%
      2002                -32,80%              8,70%               3,30%               5,15%               5,20%              3,00%                  3,40%
      2003                 9,20%               3,20%               2,60%               1,67%               4,50%              3,40%                  2,10%
      2004                 5,13%               7,60%               2,30%               3,62%               4,20%              3,10%                  1,20%
      2005                32,46%               5,20%               2,20%               4,23%               3,80%              2,70%                  1,70%
      2006                18,48%              -0,20%               3,10%               3,70%               4,30%              3,20%                  1,10%
      2007                 9,26%               1,70%               4,25%               4,10%               5,30%              1,10%                  1,60%

 Gemiddeld*               11,87%               7,30%               5,82%               6,20%               7,34%              5,13%                  3,85%

      * : Alle gemiddelde percentages in dit overzicht zijn meetkundig vastgesteld. De kolom ‘Hypotheekrente’ betreft een rekenkundig gemiddelde.

Aandelen     : CBS Herbeleggingsindex, vanaf 2004 geldt de MSCI Netherland Index GR USD (CBS, Behr)
Obligaties   : CBS Herbeleggingsindex, vanaf 2004 geldt de Lehman Euro-Aggregate Government Bond Index (CBS, Behr)
Deposito’s   : Rentevergoeding vaste termijn spaarrekening (CBS / DNB)
Onr.goed     : Gemiddelde prijsontwikkeling koopwoning Nederland (CBS, NVM)
Hyp.rente    : 5-jaars rente annuiteitenhypotheek (CBS, Postbank)
Huurprijs    : Gemiddelde huurprijsontwikkeling in Nederland (CBS, VROM, NVM)
Inflatie     : Inflatie in Nederland (CBS)

                                                            FSD Advieskaarten © Totaaloverzicht
                          Aan dit overzicht kunnen geen rechten worden ontleend. Eigendom van Financiële Service Desk B.V. © 2008
FSD Advieskaart                                          1 maands Euribor 1977 - 2008


              Betreft een weergave van de 1-maands-Euribor tarieven zónder opslag. Bij de meeste geldverstrekkers geldt een opslag variërend van 0,5% tot 1,3%.
                                                                                                                                                                  Bron : CBS Statline / DNB


                                                                  FSD Advieskaarten © 1 maands Euribor 1977-2008
                                       Aan dit overzicht kunnen geen rechten worden ontleend. Eigendom van Financiële Service Desk B.V. © 2008
FSD Advieskaart                               3 maands Euribor 1977 - 2008


                  Betreft een weergave van de 3-maands-Euribor tarieven zónder opslag. Bij de meeste geldverstrekkers geldt een opslag variërend van 0,5% tot 1,3%.

                                                                                                                                                                      Bron : CBS Statline / DNB
                                                                FSD Advieskaarten © 3 maands Euribor 1977-2008
                                     Aan dit overzicht kunnen geen rechten worden ontleend. Eigendom van Financiële Service Desk B.V. © 2008
FSD Advieskaart                                                    6 maands Euribor 1986 - 2008


                  Betreft een weergave van de 6-maands-Euribor tarieven zónder opslag. Bij de meeste geldverstrekkers geldt een opslag variërend van 0,5% tot 1,3%.
                                                                                                                                                                      Bron : CBS Statline / DNB


                                                                FSD Advieskaarten © 6 maands Euribor 1986-2008
                                     Aan dit overzicht kunnen geen rechten worden ontleend. Eigendom van Financiële Service Desk B.V. © 2008
FSD Advieskaart                                                   12 maands Euribor 1986 - 2008


                  Betreft een weergave van de 12-maands-Euribor tarieven zónder opslag. Bij de meeste geldverstrekkers geldt een opslag variërend van 0,5% tot 1,3%.
                                                                                                                                                                       Bron : CBS Statline / DNB


                                                                 FSD Advieskaarten © 12 maands Euribor 1986-2008
                                      Aan dit overzicht kunnen geen rechten worden ontleend. Eigendom van Financiële Service Desk B.V. © 2008
FSD Advieskaart                    Rendement Aandelen 1957-2008


                                                                                       Bron : CBS Herbeleggingsindex, vanaf 2004 geldt de MSCI Netherland Index (CBS, Behr)


                                       FSD Advieskaarten © Rendement Aandelen periode 1957 - 2008
                  Aan dit overzicht kunnen geen rechten worden ontleend. Eigendom van Financiële Service Desk B.V. © 2008
FSD Advieskaart               Hypotheekrente 5 jaar vast 1957 - 2008


                                                                                                                            Bron : DNB / Postbank


                                         FSD Advieskaarten © Hypotheekrente 5 jaar vast 1957-2008
                  Aan dit overzicht kunnen geen rechten worden ontleend. Eigendom van Financiële Service Desk B.V. © 2008
FSD Advieskaart               Hypotheekrente 10 jaar vast 1957 - 2008


                                                                                                                            Bron : DNB / Postbank


                                        FSD Advieskaarten © Hypotheekrente 10 jaar vast 1957-2008
                  Aan dit overzicht kunnen geen rechten worden ontleend. Eigendom van Financiële Service Desk B.V. © 2008
FSD Advieskaart               Ontwikkeling hypotheekrente 1977 - 2008


                                                                                                                            Bron : DNB / CBS Statline / Postbank


                                       FSD Advieskaarten © Ontwikkeling hypotheekrente 1977 - 2008
                  Aan dit overzicht kunnen geen rechten worden ontleend. Eigendom van Financiële Service Desk B.V. © 2008
FSD Advieskaart                      Waarde ontwikkeling o/g Nederland


                                                                                                                   Bron : CBS Statline / NVM


                                    Waarde ontwikkeling onroerend goed 1956 - 2008
 1956   :   € 11.958
 1957   :   € 12.783     + 6,90%                 1974     :   € 39.473      + 15,00%                 1991    :   € 78.648        + 2,57%

 1958   :   € 13.141     + 2,80%                 1975     :   € 45.710      + 15,80%                 1992    :   € 85.288        + 8,44%

 1959   :   € 14.587     + 11,00%                1976     :   € 58.783      + 28,60%                 1993    :   € 94.211        + 10,46%

 1960   :   € 15.681     + 7,50%                 1977     :   € 82.119      + 39,70%                 1994    :   € 102.097       + 8,37%

 1961   :   € 16.778     + 7,00%                 1978     :   € 88.443      + 7,70%                  1995    :   € 106.247       + 4,07%

 1962   :   € 17.802     + 6,10%                 1979     :   € 83.578      - 5,50%                  1996    :   € 116.934       + 10,06%

 1963   :   € 19.991     + 12,30%                1980     :   € 76.390      - 8,60%                  1997    :   € 127.206       + 8,78%

 1964   :   € 20.591     + 3,00%                 1981     :   € 68.522      - 10,30%                 1998    :   € 137.893       + 8,40%

 1965   :   € 21.044     + 2,20%                 1982     :   € 61.670      - 10,00%                 1999    :   € 162.795       + 18,06%

 1966   :   € 22.370     + 6,30%                 1983     :   € 63.458      + 2,90%                  2000    :   € 187.385       + 15,11%

 1967   :   € 22.057     - 1,40%                 1984     :   € 62.316      - 1,80%                  2001    :   € 201.289       + 7,42%

 1968   :   € 23.998     + 8,80%                 1985     :   € 62.565      + 0,40%                  2002    :   € 211.664       + 5,15%

 1969   :   € 26.565     + 10,70%                1986     :   € 65.367      + 4,48%                  2003    :   € 215.192       + 1,67%

 1970   :   € 27.867     + 4,90%                 1987     :   € 67.753      + 3,65%                  2004    :   € 222.974       + 3,62%

 1971   :   € 28.424     + 2,00%                 1988     :   € 70.762      + 4,44%                  2005    :   € 232.416       + 4,23%

 1972   :   € 32.290     + 13,60%                1989     :   € 75.120      + 6,16%                  2006    :   € 241.015       + 3,70%

 1973   :   € 34.324     + 6,30%                 1990     :   € 76.676      + 2,07%                  2007    :   € 250.897       + 4,10%


               De gemiddelde waardestijging van onroerend goed in Nederland over de periode 1956 tot 2008 bedraagt 6,20%


                                        FSD Advieskaarten © Waarde ontwikkeling o/g Nederland
                Aan dit overzicht kunnen geen rechten worden ontleend. Eigendom van Financiële Service Desk B.V. © 2008

Mais conteúdo relacionado

Destaque

Everything You Need To Know About ChatGPT
Everything You Need To Know About ChatGPTEverything You Need To Know About ChatGPT
Everything You Need To Know About ChatGPTExpeed Software
 
Product Design Trends in 2024 | Teenage Engineerings
Product Design Trends in 2024 | Teenage EngineeringsProduct Design Trends in 2024 | Teenage Engineerings
Product Design Trends in 2024 | Teenage EngineeringsPixeldarts
 
How Race, Age and Gender Shape Attitudes Towards Mental Health
How Race, Age and Gender Shape Attitudes Towards Mental HealthHow Race, Age and Gender Shape Attitudes Towards Mental Health
How Race, Age and Gender Shape Attitudes Towards Mental HealthThinkNow
 
AI Trends in Creative Operations 2024 by Artwork Flow.pdf
AI Trends in Creative Operations 2024 by Artwork Flow.pdfAI Trends in Creative Operations 2024 by Artwork Flow.pdf
AI Trends in Creative Operations 2024 by Artwork Flow.pdfmarketingartwork
 
PEPSICO Presentation to CAGNY Conference Feb 2024
PEPSICO Presentation to CAGNY Conference Feb 2024PEPSICO Presentation to CAGNY Conference Feb 2024
PEPSICO Presentation to CAGNY Conference Feb 2024Neil Kimberley
 
Content Methodology: A Best Practices Report (Webinar)
Content Methodology: A Best Practices Report (Webinar)Content Methodology: A Best Practices Report (Webinar)
Content Methodology: A Best Practices Report (Webinar)contently
 
How to Prepare For a Successful Job Search for 2024
How to Prepare For a Successful Job Search for 2024How to Prepare For a Successful Job Search for 2024
How to Prepare For a Successful Job Search for 2024Albert Qian
 
Social Media Marketing Trends 2024 // The Global Indie Insights
Social Media Marketing Trends 2024 // The Global Indie InsightsSocial Media Marketing Trends 2024 // The Global Indie Insights
Social Media Marketing Trends 2024 // The Global Indie InsightsKurio // The Social Media Age(ncy)
 
Trends In Paid Search: Navigating The Digital Landscape In 2024
Trends In Paid Search: Navigating The Digital Landscape In 2024Trends In Paid Search: Navigating The Digital Landscape In 2024
Trends In Paid Search: Navigating The Digital Landscape In 2024Search Engine Journal
 
5 Public speaking tips from TED - Visualized summary
5 Public speaking tips from TED - Visualized summary5 Public speaking tips from TED - Visualized summary
5 Public speaking tips from TED - Visualized summarySpeakerHub
 
ChatGPT and the Future of Work - Clark Boyd
ChatGPT and the Future of Work - Clark Boyd ChatGPT and the Future of Work - Clark Boyd
ChatGPT and the Future of Work - Clark Boyd Clark Boyd
 
Getting into the tech field. what next
Getting into the tech field. what next Getting into the tech field. what next
Getting into the tech field. what next Tessa Mero
 
Google's Just Not That Into You: Understanding Core Updates & Search Intent
Google's Just Not That Into You: Understanding Core Updates & Search IntentGoogle's Just Not That Into You: Understanding Core Updates & Search Intent
Google's Just Not That Into You: Understanding Core Updates & Search IntentLily Ray
 
Time Management & Productivity - Best Practices
Time Management & Productivity -  Best PracticesTime Management & Productivity -  Best Practices
Time Management & Productivity - Best PracticesVit Horky
 
The six step guide to practical project management
The six step guide to practical project managementThe six step guide to practical project management
The six step guide to practical project managementMindGenius
 
Beginners Guide to TikTok for Search - Rachel Pearson - We are Tilt __ Bright...
Beginners Guide to TikTok for Search - Rachel Pearson - We are Tilt __ Bright...Beginners Guide to TikTok for Search - Rachel Pearson - We are Tilt __ Bright...
Beginners Guide to TikTok for Search - Rachel Pearson - We are Tilt __ Bright...RachelPearson36
 
Unlocking the Power of ChatGPT and AI in Testing - A Real-World Look, present...
Unlocking the Power of ChatGPT and AI in Testing - A Real-World Look, present...Unlocking the Power of ChatGPT and AI in Testing - A Real-World Look, present...
Unlocking the Power of ChatGPT and AI in Testing - A Real-World Look, present...Applitools
 

Destaque (20)

Everything You Need To Know About ChatGPT
Everything You Need To Know About ChatGPTEverything You Need To Know About ChatGPT
Everything You Need To Know About ChatGPT
 
Product Design Trends in 2024 | Teenage Engineerings
Product Design Trends in 2024 | Teenage EngineeringsProduct Design Trends in 2024 | Teenage Engineerings
Product Design Trends in 2024 | Teenage Engineerings
 
How Race, Age and Gender Shape Attitudes Towards Mental Health
How Race, Age and Gender Shape Attitudes Towards Mental HealthHow Race, Age and Gender Shape Attitudes Towards Mental Health
How Race, Age and Gender Shape Attitudes Towards Mental Health
 
AI Trends in Creative Operations 2024 by Artwork Flow.pdf
AI Trends in Creative Operations 2024 by Artwork Flow.pdfAI Trends in Creative Operations 2024 by Artwork Flow.pdf
AI Trends in Creative Operations 2024 by Artwork Flow.pdf
 
Skeleton Culture Code
Skeleton Culture CodeSkeleton Culture Code
Skeleton Culture Code
 
PEPSICO Presentation to CAGNY Conference Feb 2024
PEPSICO Presentation to CAGNY Conference Feb 2024PEPSICO Presentation to CAGNY Conference Feb 2024
PEPSICO Presentation to CAGNY Conference Feb 2024
 
Content Methodology: A Best Practices Report (Webinar)
Content Methodology: A Best Practices Report (Webinar)Content Methodology: A Best Practices Report (Webinar)
Content Methodology: A Best Practices Report (Webinar)
 
How to Prepare For a Successful Job Search for 2024
How to Prepare For a Successful Job Search for 2024How to Prepare For a Successful Job Search for 2024
How to Prepare For a Successful Job Search for 2024
 
Social Media Marketing Trends 2024 // The Global Indie Insights
Social Media Marketing Trends 2024 // The Global Indie InsightsSocial Media Marketing Trends 2024 // The Global Indie Insights
Social Media Marketing Trends 2024 // The Global Indie Insights
 
Trends In Paid Search: Navigating The Digital Landscape In 2024
Trends In Paid Search: Navigating The Digital Landscape In 2024Trends In Paid Search: Navigating The Digital Landscape In 2024
Trends In Paid Search: Navigating The Digital Landscape In 2024
 
5 Public speaking tips from TED - Visualized summary
5 Public speaking tips from TED - Visualized summary5 Public speaking tips from TED - Visualized summary
5 Public speaking tips from TED - Visualized summary
 
ChatGPT and the Future of Work - Clark Boyd
ChatGPT and the Future of Work - Clark Boyd ChatGPT and the Future of Work - Clark Boyd
ChatGPT and the Future of Work - Clark Boyd
 
Getting into the tech field. what next
Getting into the tech field. what next Getting into the tech field. what next
Getting into the tech field. what next
 
Google's Just Not That Into You: Understanding Core Updates & Search Intent
Google's Just Not That Into You: Understanding Core Updates & Search IntentGoogle's Just Not That Into You: Understanding Core Updates & Search Intent
Google's Just Not That Into You: Understanding Core Updates & Search Intent
 
How to have difficult conversations
How to have difficult conversations How to have difficult conversations
How to have difficult conversations
 
Introduction to Data Science
Introduction to Data ScienceIntroduction to Data Science
Introduction to Data Science
 
Time Management & Productivity - Best Practices
Time Management & Productivity -  Best PracticesTime Management & Productivity -  Best Practices
Time Management & Productivity - Best Practices
 
The six step guide to practical project management
The six step guide to practical project managementThe six step guide to practical project management
The six step guide to practical project management
 
Beginners Guide to TikTok for Search - Rachel Pearson - We are Tilt __ Bright...
Beginners Guide to TikTok for Search - Rachel Pearson - We are Tilt __ Bright...Beginners Guide to TikTok for Search - Rachel Pearson - We are Tilt __ Bright...
Beginners Guide to TikTok for Search - Rachel Pearson - We are Tilt __ Bright...
 
Unlocking the Power of ChatGPT and AI in Testing - A Real-World Look, present...
Unlocking the Power of ChatGPT and AI in Testing - A Real-World Look, present...Unlocking the Power of ChatGPT and AI in Testing - A Real-World Look, present...
Unlocking the Power of ChatGPT and AI in Testing - A Real-World Look, present...
 

Fsd Advieskaarten 2008

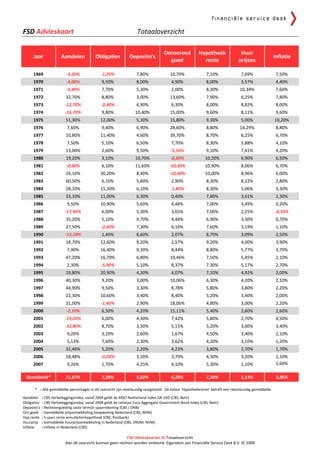
  • 1. FSD Advieskaart Totaaloverzicht Onroerend Hypotheek Huur Jaar Aandelen Obligaties Deposito's Inflatie goed rente prijzen 1969 -3,20% -1,20% 7,80% 10,70% 7,10% 7,69% 7,50% 1970 -4,00% 9,50% 8,00% 4,90% 8,00% 3,57% 4,40% 1971 -5,40% 7,70% 5,30% 2,00% 8,30% 10,34% 7,60% 1972 32,70% 8,80% 3,00% 13,60% 7,90% 6,25% 7,80% 1973 -12,70% -2,40% 6,90% 6,30% 8,00% 8,82% 8,00% 1974 -16,70% 9,80% 10,40% 15,00% 9,60% 8,11% 9,60% 1975 51,30% 12,00% 5,30% 15,80% 9,30% 5,00% 10,20% 1976 7,60% 9,40% 6,90% 28,60% 8,80% 14,29% 8,80% 1977 10,80% 11,40% 4,60% 39,70% 8,70% 6,25% 6,70% 1978 7,50% 5,10% 6,50% 7,70% 8,30% 5,88% 4,10% 1979 13,00% 2,60% 9,50% -5,50% 9,10% 7,41% 4,20% 1980 19,20% 3,10% 10,70% -8,60% 10,20% 6,90% 6,50% 1981 -0,60% 6,10% 11,60% -10,30% 10,90% 8,06% 6,70% 1982 24,10% 30,20% 8,40% -10,00% 10,00% 8,96% 6,00% 1983 60,50% 6,10% 5,60% 2,90% 8,30% 8,22% 2,80% 1984 28,10% 15,50% 6,10% -1,80% 8,30% 5,06% 3,30% 1985 33,10% 11,00% 6,30% 0,40% 7,80% 3,61% 2,30% 1986 9,50% 10,90% 5,60% 4,48% 7,00% 3,49% 0,20% 1987 -17,90% 6,00% 5,30% 3,65% 7,00% 2,25% -0,50% 1988 35,20% 5,10% 4,70% 4,44% 6,90% 3,30% 0,70% 1989 27,50% -2,60% 7,30% 6,16% 7,60% 3,19% 1,10% 1990 -13,10% 1,40% 8,60% 2,07% 8,70% 3,09% 2,50% 1991 18,70% 12,60% 9,20% 2,57% 9,20% 4,00% 3,90% 1992 7,90% 16,40% 9,30% 8,44% 8,80% 5,77% 3,70% 1993 47,20% 16,70% 6,80% 10,46% 7,50% 5,45% 2,10% 1994 2,30% -5,90% 5,10% 8,37% 7,30% 5,17% 2,70% 1995 19,80% 20,90% 4,30% 4,07% 7,10% 4,92% 2,00% 1996 40,30% 9,20% 3,00% 10,06% 6,30% 4,20% 2,10% 1997 44,90% 9,50% 3,30% 8,78% 5,80% 3,80% 2,20% 1998 22,30% 10,60% 3,40% 8,40% 5,20% 3,40% 2,00% 1999 31,00% -1,40% 2,90% 18,06% 4,80% 3,00% 2,20% 2000 -2,10% 6,50% 4,20% 15,11% 5,40% 2,60% 2,60% 2001 -19,20% 6,00% 4,30% 7,42% 5,80% 2,70% 4,50% 2002 -32,80% 8,70% 3,30% 5,15% 5,20% 3,00% 3,40% 2003 9,20% 3,20% 2,60% 1,67% 4,50% 3,40% 2,10% 2004 5,13% 7,60% 2,30% 3,62% 4,20% 3,10% 1,20% 2005 32,46% 5,20% 2,20% 4,23% 3,80% 2,70% 1,70% 2006 18,48% -0,20% 3,10% 3,70% 4,30% 3,20% 1,10% 2007 9,26% 1,70% 4,25% 4,10% 5,30% 1,10% 1,60% Gemiddeld* 11,87% 7,30% 5,82% 6,20% 7,34% 5,13% 3,85% * : Alle gemiddelde percentages in dit overzicht zijn meetkundig vastgesteld. De kolom ‘Hypotheekrente’ betreft een rekenkundig gemiddelde. Aandelen : CBS Herbeleggingsindex, vanaf 2004 geldt de MSCI Netherland Index GR USD (CBS, Behr) Obligaties : CBS Herbeleggingsindex, vanaf 2004 geldt de Lehman Euro-Aggregate Government Bond Index (CBS, Behr) Deposito’s : Rentevergoeding vaste termijn spaarrekening (CBS / DNB) Onr.goed : Gemiddelde prijsontwikkeling koopwoning Nederland (CBS, NVM) Hyp.rente : 5-jaars rente annuiteitenhypotheek (CBS, Postbank) Huurprijs : Gemiddelde huurprijsontwikkeling in Nederland (CBS, VROM, NVM) Inflatie : Inflatie in Nederland (CBS) FSD Advieskaarten © Totaaloverzicht Aan dit overzicht kunnen geen rechten worden ontleend. Eigendom van Financiële Service Desk B.V. © 2008
  • 2. FSD Advieskaart 1 maands Euribor 1977 - 2008 Betreft een weergave van de 1-maands-Euribor tarieven zónder opslag. Bij de meeste geldverstrekkers geldt een opslag variërend van 0,5% tot 1,3%. Bron : CBS Statline / DNB FSD Advieskaarten © 1 maands Euribor 1977-2008 Aan dit overzicht kunnen geen rechten worden ontleend. Eigendom van Financiële Service Desk B.V. © 2008
  • 3. FSD Advieskaart 3 maands Euribor 1977 - 2008 Betreft een weergave van de 3-maands-Euribor tarieven zónder opslag. Bij de meeste geldverstrekkers geldt een opslag variërend van 0,5% tot 1,3%. Bron : CBS Statline / DNB FSD Advieskaarten © 3 maands Euribor 1977-2008 Aan dit overzicht kunnen geen rechten worden ontleend. Eigendom van Financiële Service Desk B.V. © 2008
  • 4. FSD Advieskaart 6 maands Euribor 1986 - 2008 Betreft een weergave van de 6-maands-Euribor tarieven zónder opslag. Bij de meeste geldverstrekkers geldt een opslag variërend van 0,5% tot 1,3%. Bron : CBS Statline / DNB FSD Advieskaarten © 6 maands Euribor 1986-2008 Aan dit overzicht kunnen geen rechten worden ontleend. Eigendom van Financiële Service Desk B.V. © 2008
  • 5. FSD Advieskaart 12 maands Euribor 1986 - 2008 Betreft een weergave van de 12-maands-Euribor tarieven zónder opslag. Bij de meeste geldverstrekkers geldt een opslag variërend van 0,5% tot 1,3%. Bron : CBS Statline / DNB FSD Advieskaarten © 12 maands Euribor 1986-2008 Aan dit overzicht kunnen geen rechten worden ontleend. Eigendom van Financiële Service Desk B.V. © 2008
  • 6. FSD Advieskaart Rendement Aandelen 1957-2008 Bron : CBS Herbeleggingsindex, vanaf 2004 geldt de MSCI Netherland Index (CBS, Behr) FSD Advieskaarten © Rendement Aandelen periode 1957 - 2008 Aan dit overzicht kunnen geen rechten worden ontleend. Eigendom van Financiële Service Desk B.V. © 2008
  • 7. FSD Advieskaart Hypotheekrente 5 jaar vast 1957 - 2008 Bron : DNB / Postbank FSD Advieskaarten © Hypotheekrente 5 jaar vast 1957-2008 Aan dit overzicht kunnen geen rechten worden ontleend. Eigendom van Financiële Service Desk B.V. © 2008
  • 8. FSD Advieskaart Hypotheekrente 10 jaar vast 1957 - 2008 Bron : DNB / Postbank FSD Advieskaarten © Hypotheekrente 10 jaar vast 1957-2008 Aan dit overzicht kunnen geen rechten worden ontleend. Eigendom van Financiële Service Desk B.V. © 2008
  • 9. FSD Advieskaart Ontwikkeling hypotheekrente 1977 - 2008 Bron : DNB / CBS Statline / Postbank FSD Advieskaarten © Ontwikkeling hypotheekrente 1977 - 2008 Aan dit overzicht kunnen geen rechten worden ontleend. Eigendom van Financiële Service Desk B.V. © 2008
  • 10. FSD Advieskaart Waarde ontwikkeling o/g Nederland Bron : CBS Statline / NVM Waarde ontwikkeling onroerend goed 1956 - 2008 1956 : € 11.958 1957 : € 12.783 + 6,90% 1974 : € 39.473 + 15,00% 1991 : € 78.648 + 2,57% 1958 : € 13.141 + 2,80% 1975 : € 45.710 + 15,80% 1992 : € 85.288 + 8,44% 1959 : € 14.587 + 11,00% 1976 : € 58.783 + 28,60% 1993 : € 94.211 + 10,46% 1960 : € 15.681 + 7,50% 1977 : € 82.119 + 39,70% 1994 : € 102.097 + 8,37% 1961 : € 16.778 + 7,00% 1978 : € 88.443 + 7,70% 1995 : € 106.247 + 4,07% 1962 : € 17.802 + 6,10% 1979 : € 83.578 - 5,50% 1996 : € 116.934 + 10,06% 1963 : € 19.991 + 12,30% 1980 : € 76.390 - 8,60% 1997 : € 127.206 + 8,78% 1964 : € 20.591 + 3,00% 1981 : € 68.522 - 10,30% 1998 : € 137.893 + 8,40% 1965 : € 21.044 + 2,20% 1982 : € 61.670 - 10,00% 1999 : € 162.795 + 18,06% 1966 : € 22.370 + 6,30% 1983 : € 63.458 + 2,90% 2000 : € 187.385 + 15,11% 1967 : € 22.057 - 1,40% 1984 : € 62.316 - 1,80% 2001 : € 201.289 + 7,42% 1968 : € 23.998 + 8,80% 1985 : € 62.565 + 0,40% 2002 : € 211.664 + 5,15% 1969 : € 26.565 + 10,70% 1986 : € 65.367 + 4,48% 2003 : € 215.192 + 1,67% 1970 : € 27.867 + 4,90% 1987 : € 67.753 + 3,65% 2004 : € 222.974 + 3,62% 1971 : € 28.424 + 2,00% 1988 : € 70.762 + 4,44% 2005 : € 232.416 + 4,23% 1972 : € 32.290 + 13,60% 1989 : € 75.120 + 6,16% 2006 : € 241.015 + 3,70% 1973 : € 34.324 + 6,30% 1990 : € 76.676 + 2,07% 2007 : € 250.897 + 4,10% De gemiddelde waardestijging van onroerend goed in Nederland over de periode 1956 tot 2008 bedraagt 6,20% FSD Advieskaarten © Waarde ontwikkeling o/g Nederland Aan dit overzicht kunnen geen rechten worden ontleend. Eigendom van Financiële Service Desk B.V. © 2008