SlideShare uma empresa Scribd logo
1 de 3
Baixar para ler offline
Equity Research
PP11072/03/2010 (023549)


Sector Update                                                                                                     28 May 2009


                                                     Apr ’09 statistics: Signs of weakness
Banking                                              ahead. Underweight.
Underweight (unchanged)                              Weakness ahead. Loan disbursements, applications and approvals
                                                     slowed in Apr, reflecting cautious sentiment. Loans growth was just
                                                     1.4% YTD, and 4.2% annualised. There was a slight uptick in absolute
                                                     NPLs, implying stress in some loans segments. The poor 1Q09 GDP
                                                     numbers suggest growing stress in system loans over the next few
Wong Chew Hann, CA                                   months. We remain cautious on banks’ profits, especially from 3Q09.
wchewh@maybank-ib.com                                1.4% YTD loans growth. Banking loans (net of repayments) grew to
(603) 2297 8686                                      RM736.5m in Apr ’09 (+0.4% MoM, +10.6% YoY) on expansion in both
                                                     household (+0.7% MoM, +8.5% YoY) and business loans (-0.03%
                                                     MoM, +9.2% YoY). Disbursements slowed (-6.6% MoM, -6.4% YoY)
                                                     but repayments were relatively stable (+1.3% MoM, -2.8% YoY). YTD
                                                     loans growth was +1.4% (4M2008: +3.4%), driven by household loans
                                                     (+2.2%) while business loans’ growth was anemic (+0.4%).
                                                     Forward indicators contracting. Loan applications and approvals fell
                                                     YoY: -5.4% and -18.2%. The business segment saw loan applications
                                                     and approvals down 24.2% and 35%, while the household segment
                                                     continued to see growing appetite in loan applications but flattish loan
                                                     approvals. On a MoM comparison, both indicators also showed
                                                     contraction. Loan applications fell 1.4% while approvals slipped 0.8%.
                                                     Absolute NPLs inched up. Absolute NPLs ticked-up by 0.34% MoM to
                                                     RM33.7b (Mar ‘09: -3.7% MoM). However, Apr ‘09’s absolute NPLs
                                                     were still lower than a year ago, by 14.7%. We suspect the rising NPLs
                                                     came from the business segment, especially exporters. The net NPL
                                                     ratio was unchanged at 2.24% due to the expanded loans base. Loan
                                                     loss coverage (LLC) remained adequate at 88.5% (Mar ’09: 88.3%).
                                                     Stay Underweight. The combined 1Q09 net profit of the six banking
                                                     stocks we cover was down 2.1% QoQ, and a sharper 13.1% YoY, on
                                                     lower treasury and FX income and higher loan loss provisions. We
                                                     expect sector earnings to contract 10% YoY in 2009 and reiterate our
                                                     concerns on asset and loan quality as the economy contracts over the
                                                     next two quarters. Our analysis shows a 3-6 months interval from GDP
                                                     trough to NPL peak. Banks are set to report weaker profits.
Banking Sector – Peer Valuation Summary
Stock              Rec     Shr px   Mkt cap   TP        PER (x)   PER (x)   P/B (x)   P/B (x)   ROAE    ROAE    Gross   Gross
                                                                                                 (%)     (%)     yld     yld
                            (RM)     (RMm)    (RM)      CY09E     CY10E     FY09E     FY10E     CY09E   CY10E   FY09E   FY10E
Maybank *       NR          5.20     36,804    NR        14.6      15.1      1.3       1.3        8.8     8.5    4.8     4.8
BCHB            Sell        8.75     31,308   6.80       16.5      15.6      1.7       1.6       10.7    10.4    2.1     2.3
Public Bank     Sell        8.75     30,904   7.60       13.0      12.6      2.8       2.5       22.3    20.7    5.7     6.3
RHB Cap         Hold        4.22      9,088   4.30       10.7      10.0      1.1       1.0       10.5    10.4    3.8     4.0
AMMB            Hold        3.32      9,040   3.30       11.8      11.4      1.2       1.1       10.0     9.2    2.4     2.7
EON Cap         Sell        3.82      2,648   3.40       12.8      11.6      0.8       0.7        6.3     6.6    2.6     2.6
HL Bank *       NR          5.60      8,849    NA        10.6      10.3      1.5       1.4       15.7    13.6    3.9     4.1
AFG *           NR          2.20      3,406    NA        11.0      10.0      1.2       1.1       11.8    10.8    2.9     3.2
Affin Hldgs *   NR          1.70      2,540    NA        11.1       9.8      0.5       0.5        5.5     5.7    2.9     2.8
Sector (weighted)                   134,587              13.5      13.1      1.3       1.2
* Consensus; Source: Maybank-IB
Banking


                                                       Other indicators
                                                       Deposits declined, LDR up slightly. System deposits declined
                                                       marginally by 0.1% MoM (-6.2% YoY) to RM984.8b mainly due to
                                                       purchase of equity issued by the banks. As a result, system loan-to-
                                                       deposit ratio (LDR) rose slightly to 74.2% as at end-Apr ’09 (Mar ’09:
                                                       73.7%). This implies that the banks still have good capacity to lend.

                                                       Lending rates stable. There was no further OPR reduction at 26
                                                       May’s Monetary Policy Committee meeting after three cuts since Nov
                                                       ’08 totalling 150 bps. As the OPR reached a historic low of 2%, the
                                                       same goes for lending and deposit rates. Commercial banks’ average
                                                       base lending rate (BLR) stayed at a historic low of 5.53% as at 15 May
                                                       ’09 with a total 119 bps reduction since Nov ‘08. Average lending rate
                                                       (ALR) also touched a historic low of 5.13% as at end-Apr ’09.
                                                       Impact of OPR cuts on BLR and FD Rate
                                                                             st                      nd                      rd
                                                                            1 OPR cut            2 OPR cut                  3 OPR cut
                                                                            (24 Nov ’08)         (21 Jan ’09)               (24 Feb ’09)
                                                        OPR                 3.25% (-25bps)       2.50% (-75bps)             2.00% (-50bps)
                                                        SRR                 3.50% (-50bps)       2.00% (-150bps)            1.00% (-100bps)
                                                        BLR (average)       6.48% @ end-Dec      5.89% @ end-Feb            5.53% @ 15 Apr ’09
                                                                            ‘08 (-24bps)         ’09 (-59bps)               (-36bps)
                                                        FD rate:
                                                            1-month         3.00% (-10bps)       2.50% (-50bps)             2.00% (-50bps)
                                                            3-month         3.50% (-20bps)       3.00% (-50bps)             2.50% (-50bps)
                                                       Source: Maybank-IB

                                                       Capitalisation stayed strong. System capitalisation edged up with a
                                                       core ratio of 12.3% (Mar ‘09: 11.6%) and RWCR of 14.2% (Mar ‘09:
                                                       13.5%) after capital raising exercises by the banks. The higher ratios
                                                       had resulted in higher excess capital, by RM5.1b, to absorb potential
                                                       losses. We estimate the system can absorb a loss of RM54.7b.
  Loans Momentum
   (% YoY)          May 08     Jun 08    Jul 08    Aug 08      Sep 08   Oct 08     Nov 08    Dec 08       Jan 09   Feb 09     Mar 09        Apr 09
  Gross loans        +11.0      +11.7     +9.9      +11.0       +10.6   +10.3       +10.7    +12.8         +11.7    +10.9     +10.9         +10.6
  - Businesses       +12.6      +14.4     +9.4      +11.4       +9.5     +8.8       +7.8     +13.2         +11.8    +10.0      +9.5          +9.2
  - Households       +8.7       +8.9      +8.8      +8.7        +9.1     +8.9       +9.0      +9.1         +9.1     +8.9       +8.8          +8.5
  Applications        -9.7       -5.2    +11.9      +25.5        -5.8    -7.9       -32.6     -18.8        -21.0     +8.1      +5.4           -5.4
  Approvals         -19.0%      -23.4     +2.3      +15.8        -2.9   -14.4       -44.0     -23.7        -35.5    -15.9      -0.7          -18.2
  Source: Bank Negara

  Interest Rates
  (%)               May 08     Jun 08    Jul 08    Aug 08      Sep 08   Oct 08     Nov 08    Dec 08       Jan 09   Feb 09     Mar 09        Apr 09
  BLR                6.72       6.72      6.72      6.72        6.72      6.72       6.66      6.48         6.38     5.89       5.53          5.53
  ALR                6.13       6.08      6.02      5.98         5.96     6.01       5.98      5.86         5.77     5.49       5.16          5.13
  ADR                3.31       3.31      3.31      3.31         3.31     3.31       3.21      3.16         2.63     2.16       2.14          2.14
  ALR-ADR            2.82       2.77      2.71      2.67         2.65     2.70       2.77      2.70         3.14     3.33       3.02          2.99
  ALR-BLR            -0.59      -0.64     -0.70     -0.74       -0.76    -0.71      -0.68     -0.62        -0.62    -0.40      -0.37         -0.40
  ADR-CPI            -0.49      -4.38     -5.20     -5.19       -4.90    -4.32      -2.50     -1.24        -1.27    -1.54      -1.38         -0.91
  Note: ADR refers to the average of fixed deposit rates; Source: Bank Negara

  Asset Quality & Capitalisation
                    May 08     Jun 08    Jul 08    Aug 08      Sep 08   Oct 08     Nov 08    Dec 08       Jan 09   Feb 09     Mar 09        Apr 09
  Gross NPL          37.8       36.9      36.7      36.8        36.1     36.3       35.9      35.1         34.9     34.9       33.6          33.7
  (3-mth) (RMb)
  Net NPL (%)         2.81      2.66      2.53       2.50       2.40     2.43       2.38      2.25         2.21     2.23          2.24       2.24
  LLC(%)              80.9      82.4      84.5       85.1       86.9     86.7       86.8      89.1         89.6     89.2          88.3       88.5
  Tier 1 cap (%)      9.9       10.8      10.9       10.8       10.6     10.4       10.4      10.6         11.1     11.2          11.6       12.3
  RWCR (%)            13.0      13.6      13.6       13.4       13.1     12.6       12.5      12.1         13.0     13.2          13.5       14.2
  Source: Bank Negara


28 May 2009                                                                                                                              Page 2 of 3
Banking


 Definition of Ratings
 Maybank Investment Bank Research uses the following rating system:
   BUY     Total return is expected to be above 10% in the next 12 months
  HOLD     Total return is expected to be between -5% to 10% in the next 12 months
  SELL     Total return is expected to be below -5% in the next 12 months


 Applicability of Ratings
 The respective analyst maintains a coverage universe of stocks, the list of which may be adjusted according to needs. Investment ratings are
 only applicable to the stocks which form part of the coverage universe. Reports on companies which are not part of the coverage do not
 carry investment ratings as we do not actively follow developments in these companies.

 Some common terms abbreviated in this report (where they appear):
  Adex = Advertising Expenditure                           FCF = Free Cashflow                       PE = Price Earnings
  BV = Book Value                                          FV = Fair Value                           PEG = PE Ratio To Growth
  CAGR = Compounded Annual Growth Rate                     FY = Financial Year                       PER = PE Ratio
  Capex = Capital Expenditure                              FYE = Financial Year End                  QoQ = Quarter-On-Quarter
  CY = Calendar Year                                       MoM = Month-On-Month                      ROA = Return On Asset
  DCF = Discounted Cashflow                                NAV = Net Asset Value                     ROE = Return On Equity
  DPS = Dividend Per Share                                 NTA = Net Tangible Asset                  ROSF = Return On Shareholders’ Funds
  EBIT = Earnings Before Interest And Tax                  P = Price                                 WACC = Weighted Average Cost Of Capital
  EBITDA = EBIT, Depreciation And Amortisation             P.A. = Per Annum                          YoY = Year-On-Year
  EPS = Earnings Per Share                                 PAT = Profit After Tax                    YTD = Year-To-Date
  EV = Enterprise Value                                    PBT = Profit Before Tax

 Disclaimer
 This report is for information purposes only and under no circumstances is it to be considered or intended as an offer to sell or a solicitation
 of an offer to buy the securities referred to herein. Investors should note that income from such securities, if any, may fluctuate and that each
 security’s price or value may rise or fall. Opinions or recommendations contained herein are in form of technical ratings and fundamental
 ratings. Technical ratings may differ from fundamental ratings as technical valuations apply different methodologies and are purely based on
 price and volume-related information extracted from Bursa Malaysia Securities Berhad in the equity analysis. Accordingly, investors may
 receive back less than originally invested. Past performance is not necessarily a guide to future performance. This report is not intended to
 provide personal investment advice and does not take into account the specific investment objectives, the financial situation and the
 particular needs of persons who may receive or read this report. Investors should therefore seek financial, legal and other advice regarding
 the appropriateness of investing in any securities or the investment strategies discussed or recommended in this report.
 The information contained herein has been obtained from sources believed to be reliable but such sources have not been independently
 verified by Maybank Investment Bank Bhd and consequently no representation is made as to the accuracy or completeness of this report by
 Maybank Investment Bank Bhd and it should not be relied upon as such. Accordingly, no liability can be accepted for any direct, indirect or
 consequential losses or damages that may arise from the use or reliance of this report. Maybank Investment Bank Bhd, its affiliates and
 related companies and their officers, directors, associates, connected parties and/or employees may from time to time have positions or be
 materially interested in the securities referred to herein and may further act as market maker or may have assumed an underwriting
 commitment or deal with such securities and may also perform or seek to perform investment banking services, advisory and other services
 for or relating to those companies. Any information, opinions or recommendations contained herein are subject to change at any time,
 without prior notice.
 This report may contain forward looking statements which are often but not always identified by the use of words such as “anticipate”,
 “believe”, “estimate”, “intend”, “plan”, “expect”, “forecast”, “predict” and “project” and statements that an event or result “may”, “will”, “can”,
 “should”, “could” or “might” occur or be achieved and other similar expressions. Such forward looking statements are based on assumptions
 made and information currently available to us and are subject to certain risks and uncertainties that could cause the actual results to differ
 materially from those expressed in any forward looking statements. Readers are cautioned not to place undue relevance on these forward-
 looking statements. Maybank Investment Bank Bhd expressly disclaims any obligation to update or revise any such forward looking
 statements to reflect new information, events or circumstances after the date of this publication or to reflect the occurrence of unanticipated
 events.
 This report is prepared for the use of Maybank Investment Bank Bhd's clients and may not be reproduced, altered in any way, transmitted to,
 copied or distributed to any other party in whole or in part in any form or manner without the prior express written consent of Maybank
 Investment Bank Bhd and Maybank Investment Bank Bhd accepts no liability whatsoever for the actions of third parties in this respect.
 This report is not directed to or intended for distribution to or use by any person or entity who is a citizen or resident of or located in any
 locality, state, country or other jurisdiction where such distribution, publication, availability or use would be contrary to law or regulation.
                                                                 Published / Printed by


                                                          Maybank Investment Bank Berhad (15938-H)
                                                    (Formerly known as Aseambankers Malaysia Berhad)
                                              (A Participating Organisation of Bursa Malaysia Securities Berhad)
                                           33rd Floor, Menara Maybank, 100 Jalan Tun Perak, 50050 Kuala Lumpur
                                                          Tel: (603) 2059 1888; Fax: (603) 2078 4194
                                                                     Stockbroking Business:
                                    Level 8, MaybanLife Tower, Dataran Maybank, No.1, Jalan Maarof 59000 Kuala Lumpur
                                                          Tel: (603) 2297 8888; Fax: (603) 2282 5136
                                                                  http://www.maybank-ib.com


28 May 2009                                                                                                                                 Page 3 of 3

Mais conteúdo relacionado

Mais procurados

Icici bank ru2 qfy2011-291010
Icici bank ru2 qfy2011-291010Icici bank ru2 qfy2011-291010
Icici bank ru2 qfy2011-291010Angel Broking
 
jsc-bank-of-georgia-announces-consolidated-q3-and-yeartodate-2007-results-pub...
jsc-bank-of-georgia-announces-consolidated-q3-and-yeartodate-2007-results-pub...jsc-bank-of-georgia-announces-consolidated-q3-and-yeartodate-2007-results-pub...
jsc-bank-of-georgia-announces-consolidated-q3-and-yeartodate-2007-results-pub...Lado Gurgenidze
 
2 q09 earnings_press_release_final
2 q09 earnings_press_release_final2 q09 earnings_press_release_final
2 q09 earnings_press_release_finalmanoranjanpattanayak
 
u.s.bancorp3Q 2008 Earnings Release
u.s.bancorp3Q 2008 Earnings Release  u.s.bancorp3Q 2008 Earnings Release
u.s.bancorp3Q 2008 Earnings Release finance13
 
BoG Q3 2007 Results Overview
BoG Q3 2007 Results OverviewBoG Q3 2007 Results Overview
BoG Q3 2007 Results OverviewLado Gurgenidze
 
sovereignbank Q3_2007
sovereignbank Q3_2007sovereignbank Q3_2007
sovereignbank Q3_2007finance47
 
Ge Webcast Presentation 2008
Ge Webcast Presentation 2008Ge Webcast Presentation 2008
Ge Webcast Presentation 2008earningsreport
 
[JMFL] Repco Home Finance - Initiating Coverage 14 February 14
[JMFL] Repco Home Finance - Initiating Coverage 14 February 14[JMFL] Repco Home Finance - Initiating Coverage 14 February 14
[JMFL] Repco Home Finance - Initiating Coverage 14 February 14Amey Sathe, CFA
 
4Q 2013 Bank-Only Earnings Presentation
4Q 2013 Bank-Only Earnings Presentation4Q 2013 Bank-Only Earnings Presentation
4Q 2013 Bank-Only Earnings PresentationGaranti Bank
 
FirstBank Nigeria Result Presentation 2010
FirstBank Nigeria Result Presentation 2010FirstBank Nigeria Result Presentation 2010
FirstBank Nigeria Result Presentation 2010FirstBank, Nigeria
 
Scotiabank Investor Presentation
Scotiabank Investor PresentationScotiabank Investor Presentation
Scotiabank Investor PresentationCompany Spotlight
 
Presentacion inversionistas 1 q21 ingles-vf
Presentacion inversionistas   1 q21 ingles-vfPresentacion inversionistas   1 q21 ingles-vf
Presentacion inversionistas 1 q21 ingles-vfBladex
 
asset_allocation 2009
asset_allocation 2009asset_allocation 2009
asset_allocation 2009Nino Boezio
 
xcel energy November 2008
xcel energy  November 2008 xcel energy  November 2008
xcel energy November 2008 finance26
 

Mais procurados (20)

Icici bank ru2 qfy2011-291010
Icici bank ru2 qfy2011-291010Icici bank ru2 qfy2011-291010
Icici bank ru2 qfy2011-291010
 
jsc-bank-of-georgia-announces-consolidated-q3-and-yeartodate-2007-results-pub...
jsc-bank-of-georgia-announces-consolidated-q3-and-yeartodate-2007-results-pub...jsc-bank-of-georgia-announces-consolidated-q3-and-yeartodate-2007-results-pub...
jsc-bank-of-georgia-announces-consolidated-q3-and-yeartodate-2007-results-pub...
 
2 q09 earnings_press_release_final
2 q09 earnings_press_release_final2 q09 earnings_press_release_final
2 q09 earnings_press_release_final
 
TEXPO_April 2016_FINAL
TEXPO_April 2016_FINALTEXPO_April 2016_FINAL
TEXPO_April 2016_FINAL
 
u.s.bancorp3Q 2008 Earnings Release
u.s.bancorp3Q 2008 Earnings Release  u.s.bancorp3Q 2008 Earnings Release
u.s.bancorp3Q 2008 Earnings Release
 
BoG Q3 2007 Results Overview
BoG Q3 2007 Results OverviewBoG Q3 2007 Results Overview
BoG Q3 2007 Results Overview
 
Weekly market review feb 22, 2013
Weekly market review   feb 22, 2013Weekly market review   feb 22, 2013
Weekly market review feb 22, 2013
 
Federal Bank
Federal BankFederal Bank
Federal Bank
 
sovereignbank Q3_2007
sovereignbank Q3_2007sovereignbank Q3_2007
sovereignbank Q3_2007
 
Ge Webcast Presentation 2008
Ge Webcast Presentation 2008Ge Webcast Presentation 2008
Ge Webcast Presentation 2008
 
Weekly Market Review Nov 9 2012
Weekly Market Review   Nov 9 2012Weekly Market Review   Nov 9 2012
Weekly Market Review Nov 9 2012
 
[JMFL] Repco Home Finance - Initiating Coverage 14 February 14
[JMFL] Repco Home Finance - Initiating Coverage 14 February 14[JMFL] Repco Home Finance - Initiating Coverage 14 February 14
[JMFL] Repco Home Finance - Initiating Coverage 14 February 14
 
4Q 2013 Bank-Only Earnings Presentation
4Q 2013 Bank-Only Earnings Presentation4Q 2013 Bank-Only Earnings Presentation
4Q 2013 Bank-Only Earnings Presentation
 
FirstBank Nigeria Result Presentation 2010
FirstBank Nigeria Result Presentation 2010FirstBank Nigeria Result Presentation 2010
FirstBank Nigeria Result Presentation 2010
 
Q1 2009 Earning Report of Popular Inc.
Q1 2009 Earning Report of Popular Inc.Q1 2009 Earning Report of Popular Inc.
Q1 2009 Earning Report of Popular Inc.
 
Scotiabank Investor Presentation
Scotiabank Investor PresentationScotiabank Investor Presentation
Scotiabank Investor Presentation
 
Presentacion inversionistas 1 q21 ingles-vf
Presentacion inversionistas   1 q21 ingles-vfPresentacion inversionistas   1 q21 ingles-vf
Presentacion inversionistas 1 q21 ingles-vf
 
asset_allocation 2009
asset_allocation 2009asset_allocation 2009
asset_allocation 2009
 
AFP_Sept 2015_v3
AFP_Sept 2015_v3AFP_Sept 2015_v3
AFP_Sept 2015_v3
 
xcel energy November 2008
xcel energy  November 2008 xcel energy  November 2008
xcel energy November 2008
 

Destaque (16)

Sven
Sven Sven
Sven
 
2009 Real Gdp
2009 Real Gdp2009 Real Gdp
2009 Real Gdp
 
How easy create digital conception
How easy create digital conceptionHow easy create digital conception
How easy create digital conception
 
Srinivas Challa E Community
Srinivas Challa  E CommunitySrinivas Challa  E Community
Srinivas Challa E Community
 
Modena In Maggio 2009
Modena In Maggio 2009Modena In Maggio 2009
Modena In Maggio 2009
 
Eduzine ppt
Eduzine pptEduzine ppt
Eduzine ppt
 
Presentation
PresentationPresentation
Presentation
 
Акция для dunken donats
Акция для dunken donatsАкция для dunken donats
Акция для dunken donats
 
Miller more then party
Miller more then partyMiller more then party
Miller more then party
 
Srinivas Challa E Community
Srinivas Challa  E CommunitySrinivas Challa  E Community
Srinivas Challa E Community
 
Creative News
Creative NewsCreative News
Creative News
 
Nike run idea
Nike run ideaNike run idea
Nike run idea
 
Langkah Kemaskini Site Kokurikulum Frog VLE
Langkah Kemaskini Site Kokurikulum Frog VLELangkah Kemaskini Site Kokurikulum Frog VLE
Langkah Kemaskini Site Kokurikulum Frog VLE
 
LADAP FROG VLE FASA 2
LADAP FROG VLE FASA 2LADAP FROG VLE FASA 2
LADAP FROG VLE FASA 2
 
Orosi digital social for nike
Orosi digital social for nikeOrosi digital social for nike
Orosi digital social for nike
 
Digital trends for Casio
Digital trends for CasioDigital trends for Casio
Digital trends for Casio
 

Semelhante a Banking:Weakness Ahead

BANKING A Picture Of Health
BANKING A Picture Of HealthBANKING A Picture Of Health
BANKING A Picture Of HealthBoyboy cute
 
3 q09 earnings_presentation_final (2)
3 q09 earnings_presentation_final (2)3 q09 earnings_presentation_final (2)
3 q09 earnings_presentation_final (2)manoranjanpattanayak
 
2 q09 earnings_presentation_final (1)
2 q09 earnings_presentation_final (1)2 q09 earnings_presentation_final (1)
2 q09 earnings_presentation_final (1)manoranjanpattanayak
 
Bendigo Bank (EBN) - finding an earnings base
Bendigo Bank (EBN) - finding an earnings base Bendigo Bank (EBN) - finding an earnings base
Bendigo Bank (EBN) - finding an earnings base George Gabriel
 
Corporation Bank Result Update
Corporation Bank Result UpdateCorporation Bank Result Update
Corporation Bank Result UpdateAngel Broking
 
Dena Bank Result Update
Dena Bank Result UpdateDena Bank Result Update
Dena Bank Result UpdateAngel Broking
 
Yes Bank - Result Update
Yes Bank - Result UpdateYes Bank - Result Update
Yes Bank - Result UpdateAngel Broking
 
Yes bank ru4 qfy2010-290410
Yes bank ru4 qfy2010-290410Yes bank ru4 qfy2010-290410
Yes bank ru4 qfy2010-290410Angel Broking
 
JPMorgan Chase First Quarter 2008 Financial Results Conference Call
JPMorgan Chase First Quarter 2008 Financial Results Conference Call JPMorgan Chase First Quarter 2008 Financial Results Conference Call
JPMorgan Chase First Quarter 2008 Financial Results Conference Call finance2
 
July Banking Sector Update
July Banking Sector UpdateJuly Banking Sector Update
July Banking Sector UpdateQNB Group
 
Financial Services Liberalisation
Financial Services LiberalisationFinancial Services Liberalisation
Financial Services LiberalisationBoyboy cute
 
Indian bank ru2 qfy2011-251010
Indian bank ru2 qfy2011-251010Indian bank ru2 qfy2011-251010
Indian bank ru2 qfy2011-251010Angel Broking
 
Pnb ru2 qfy2011-291010
Pnb ru2 qfy2011-291010Pnb ru2 qfy2011-291010
Pnb ru2 qfy2011-291010Angel Broking
 
3Q 2013 Consolidated Earnings Presentation
3Q 2013 Consolidated Earnings Presentation3Q 2013 Consolidated Earnings Presentation
3Q 2013 Consolidated Earnings PresentationGaranti Bank
 
JPM 2016 equity research
JPM 2016 equity researchJPM 2016 equity research
JPM 2016 equity researchAnthony Petalas
 
FirstBank Nigeria 2010 Result Presentation
FirstBank Nigeria  2010 Result PresentationFirstBank Nigeria  2010 Result Presentation
FirstBank Nigeria 2010 Result PresentationFirstBank, Nigeria
 
Mercer Capital's Bank Watch | June 2022 | Bond Pain and Perspective on Bank V...
Mercer Capital's Bank Watch | June 2022 | Bond Pain and Perspective on Bank V...Mercer Capital's Bank Watch | June 2022 | Bond Pain and Perspective on Bank V...
Mercer Capital's Bank Watch | June 2022 | Bond Pain and Perspective on Bank V...Mercer Capital
 

Semelhante a Banking:Weakness Ahead (20)

BANKING A Picture Of Health
BANKING A Picture Of HealthBANKING A Picture Of Health
BANKING A Picture Of Health
 
3 q09 earnings_presentation_final
3 q09 earnings_presentation_final3 q09 earnings_presentation_final
3 q09 earnings_presentation_final
 
3 q09 earnings_presentation_final (2)
3 q09 earnings_presentation_final (2)3 q09 earnings_presentation_final (2)
3 q09 earnings_presentation_final (2)
 
2 q09 earnings_presentation_final (1)
2 q09 earnings_presentation_final (1)2 q09 earnings_presentation_final (1)
2 q09 earnings_presentation_final (1)
 
2 q09 earnings_presentation_final
2 q09 earnings_presentation_final2 q09 earnings_presentation_final
2 q09 earnings_presentation_final
 
Bendigo Bank (EBN) - finding an earnings base
Bendigo Bank (EBN) - finding an earnings base Bendigo Bank (EBN) - finding an earnings base
Bendigo Bank (EBN) - finding an earnings base
 
Corporation Bank Result Update
Corporation Bank Result UpdateCorporation Bank Result Update
Corporation Bank Result Update
 
Dena Bank Result Update
Dena Bank Result UpdateDena Bank Result Update
Dena Bank Result Update
 
Yes Bank - Result Update
Yes Bank - Result UpdateYes Bank - Result Update
Yes Bank - Result Update
 
Yes bank ru4 qfy2010-290410
Yes bank ru4 qfy2010-290410Yes bank ru4 qfy2010-290410
Yes bank ru4 qfy2010-290410
 
JPMorgan Chase First Quarter 2008 Financial Results Conference Call
JPMorgan Chase First Quarter 2008 Financial Results Conference Call JPMorgan Chase First Quarter 2008 Financial Results Conference Call
JPMorgan Chase First Quarter 2008 Financial Results Conference Call
 
July Banking Sector Update
July Banking Sector UpdateJuly Banking Sector Update
July Banking Sector Update
 
1 q09 investor-presentation
1 q09 investor-presentation1 q09 investor-presentation
1 q09 investor-presentation
 
Financial Services Liberalisation
Financial Services LiberalisationFinancial Services Liberalisation
Financial Services Liberalisation
 
Indian bank ru2 qfy2011-251010
Indian bank ru2 qfy2011-251010Indian bank ru2 qfy2011-251010
Indian bank ru2 qfy2011-251010
 
Pnb ru2 qfy2011-291010
Pnb ru2 qfy2011-291010Pnb ru2 qfy2011-291010
Pnb ru2 qfy2011-291010
 
3Q 2013 Consolidated Earnings Presentation
3Q 2013 Consolidated Earnings Presentation3Q 2013 Consolidated Earnings Presentation
3Q 2013 Consolidated Earnings Presentation
 
JPM 2016 equity research
JPM 2016 equity researchJPM 2016 equity research
JPM 2016 equity research
 
FirstBank Nigeria 2010 Result Presentation
FirstBank Nigeria  2010 Result PresentationFirstBank Nigeria  2010 Result Presentation
FirstBank Nigeria 2010 Result Presentation
 
Mercer Capital's Bank Watch | June 2022 | Bond Pain and Perspective on Bank V...
Mercer Capital's Bank Watch | June 2022 | Bond Pain and Perspective on Bank V...Mercer Capital's Bank Watch | June 2022 | Bond Pain and Perspective on Bank V...
Mercer Capital's Bank Watch | June 2022 | Bond Pain and Perspective on Bank V...
 

Último

Mahendragarh Escorts 🥰 8617370543 Call Girls Offer VIP Hot Girls
Mahendragarh Escorts 🥰 8617370543 Call Girls Offer VIP Hot GirlsMahendragarh Escorts 🥰 8617370543 Call Girls Offer VIP Hot Girls
Mahendragarh Escorts 🥰 8617370543 Call Girls Offer VIP Hot GirlsDeepika Singh
 
Dubai Call Girls Deira O525547819 Dubai Call Girls Bur Dubai Multiple
Dubai Call Girls Deira O525547819 Dubai Call Girls Bur Dubai MultipleDubai Call Girls Deira O525547819 Dubai Call Girls Bur Dubai Multiple
Dubai Call Girls Deira O525547819 Dubai Call Girls Bur Dubai Multiplekojalpk89
 
Seeman_Fiintouch_LLP_Newsletter_May-2024.pdf
Seeman_Fiintouch_LLP_Newsletter_May-2024.pdfSeeman_Fiintouch_LLP_Newsletter_May-2024.pdf
Seeman_Fiintouch_LLP_Newsletter_May-2024.pdfAshis Kumar Dey
 
Pension dashboards forum 1 May 2024 (1).pdf
Pension dashboards forum 1 May 2024 (1).pdfPension dashboards forum 1 May 2024 (1).pdf
Pension dashboards forum 1 May 2024 (1).pdfHenry Tapper
 
Group 8 - Goldman Sachs & 1MDB Case Studies
Group 8 - Goldman Sachs & 1MDB Case StudiesGroup 8 - Goldman Sachs & 1MDB Case Studies
Group 8 - Goldman Sachs & 1MDB Case StudiesNghiaPham100
 
Shrambal_Distributors_Newsletter_May-2024.pdf
Shrambal_Distributors_Newsletter_May-2024.pdfShrambal_Distributors_Newsletter_May-2024.pdf
Shrambal_Distributors_Newsletter_May-2024.pdfvikashdidwania1
 
cost-volume-profit analysis.ppt(managerial accounting).pptx
cost-volume-profit analysis.ppt(managerial accounting).pptxcost-volume-profit analysis.ppt(managerial accounting).pptx
cost-volume-profit analysis.ppt(managerial accounting).pptxazadalisthp2020i
 
Business Principles, Tools, and Techniques in Participating in Various Types...
Business Principles, Tools, and Techniques  in Participating in Various Types...Business Principles, Tools, and Techniques  in Participating in Various Types...
Business Principles, Tools, and Techniques in Participating in Various Types...jeffreytingson
 
Strategic Resources May 2024 Corporate Presentation
Strategic Resources May 2024 Corporate PresentationStrategic Resources May 2024 Corporate Presentation
Strategic Resources May 2024 Corporate PresentationAdnet Communications
 
Technology industry / Finnish economic outlook
Technology industry / Finnish economic outlookTechnology industry / Finnish economic outlook
Technology industry / Finnish economic outlookTechFinland
 
FE Credit and SMBC Acquisition Case Studies
FE Credit and SMBC Acquisition Case StudiesFE Credit and SMBC Acquisition Case Studies
FE Credit and SMBC Acquisition Case StudiesNghiaPham100
 
FOREX FUNDAMENTALS: A BEGINNER'S GUIDE.pdf
FOREX FUNDAMENTALS: A BEGINNER'S GUIDE.pdfFOREX FUNDAMENTALS: A BEGINNER'S GUIDE.pdf
FOREX FUNDAMENTALS: A BEGINNER'S GUIDE.pdfCocity Enterprises
 
Call Girls Howrah ( 8250092165 ) Cheap rates call girls | Get low budget
Call Girls Howrah ( 8250092165 ) Cheap rates call girls | Get low budgetCall Girls Howrah ( 8250092165 ) Cheap rates call girls | Get low budget
Call Girls Howrah ( 8250092165 ) Cheap rates call girls | Get low budgetSareena Khatun
 
+97470301568>>buy weed in qatar,buy thc oil in qatar doha>>buy cannabis oil i...
+97470301568>>buy weed in qatar,buy thc oil in qatar doha>>buy cannabis oil i...+97470301568>>buy weed in qatar,buy thc oil in qatar doha>>buy cannabis oil i...
+97470301568>>buy weed in qatar,buy thc oil in qatar doha>>buy cannabis oil i...Health
 
Test bank for advanced assessment interpreting findings and formulating diffe...
Test bank for advanced assessment interpreting findings and formulating diffe...Test bank for advanced assessment interpreting findings and formulating diffe...
Test bank for advanced assessment interpreting findings and formulating diffe...robinsonayot
 
Responsible Finance Principles and Implication
Responsible Finance Principles and ImplicationResponsible Finance Principles and Implication
Responsible Finance Principles and ImplicationNghiaPham100
 
abortion pills in Riyadh Saudi Arabia (+919707899604)cytotec pills in dammam
abortion pills in Riyadh Saudi Arabia (+919707899604)cytotec pills in dammamabortion pills in Riyadh Saudi Arabia (+919707899604)cytotec pills in dammam
abortion pills in Riyadh Saudi Arabia (+919707899604)cytotec pills in dammamsamsungultra782445
 
+971565801893>>SAFE ORIGINAL ABORTION PILLS FOR SALE IN DUBAI,RAK CITY,ABUDHA...
+971565801893>>SAFE ORIGINAL ABORTION PILLS FOR SALE IN DUBAI,RAK CITY,ABUDHA...+971565801893>>SAFE ORIGINAL ABORTION PILLS FOR SALE IN DUBAI,RAK CITY,ABUDHA...
+971565801893>>SAFE ORIGINAL ABORTION PILLS FOR SALE IN DUBAI,RAK CITY,ABUDHA...Health
 
Famous No1 Amil Baba Love marriage Astrologer Specialist Expert In Pakistan a...
Famous No1 Amil Baba Love marriage Astrologer Specialist Expert In Pakistan a...Famous No1 Amil Baba Love marriage Astrologer Specialist Expert In Pakistan a...
Famous No1 Amil Baba Love marriage Astrologer Specialist Expert In Pakistan a...janibaber266
 
劳伦森大学毕业证
劳伦森大学毕业证劳伦森大学毕业证
劳伦森大学毕业证yyawb
 

Último (20)

Mahendragarh Escorts 🥰 8617370543 Call Girls Offer VIP Hot Girls
Mahendragarh Escorts 🥰 8617370543 Call Girls Offer VIP Hot GirlsMahendragarh Escorts 🥰 8617370543 Call Girls Offer VIP Hot Girls
Mahendragarh Escorts 🥰 8617370543 Call Girls Offer VIP Hot Girls
 
Dubai Call Girls Deira O525547819 Dubai Call Girls Bur Dubai Multiple
Dubai Call Girls Deira O525547819 Dubai Call Girls Bur Dubai MultipleDubai Call Girls Deira O525547819 Dubai Call Girls Bur Dubai Multiple
Dubai Call Girls Deira O525547819 Dubai Call Girls Bur Dubai Multiple
 
Seeman_Fiintouch_LLP_Newsletter_May-2024.pdf
Seeman_Fiintouch_LLP_Newsletter_May-2024.pdfSeeman_Fiintouch_LLP_Newsletter_May-2024.pdf
Seeman_Fiintouch_LLP_Newsletter_May-2024.pdf
 
Pension dashboards forum 1 May 2024 (1).pdf
Pension dashboards forum 1 May 2024 (1).pdfPension dashboards forum 1 May 2024 (1).pdf
Pension dashboards forum 1 May 2024 (1).pdf
 
Group 8 - Goldman Sachs & 1MDB Case Studies
Group 8 - Goldman Sachs & 1MDB Case StudiesGroup 8 - Goldman Sachs & 1MDB Case Studies
Group 8 - Goldman Sachs & 1MDB Case Studies
 
Shrambal_Distributors_Newsletter_May-2024.pdf
Shrambal_Distributors_Newsletter_May-2024.pdfShrambal_Distributors_Newsletter_May-2024.pdf
Shrambal_Distributors_Newsletter_May-2024.pdf
 
cost-volume-profit analysis.ppt(managerial accounting).pptx
cost-volume-profit analysis.ppt(managerial accounting).pptxcost-volume-profit analysis.ppt(managerial accounting).pptx
cost-volume-profit analysis.ppt(managerial accounting).pptx
 
Business Principles, Tools, and Techniques in Participating in Various Types...
Business Principles, Tools, and Techniques  in Participating in Various Types...Business Principles, Tools, and Techniques  in Participating in Various Types...
Business Principles, Tools, and Techniques in Participating in Various Types...
 
Strategic Resources May 2024 Corporate Presentation
Strategic Resources May 2024 Corporate PresentationStrategic Resources May 2024 Corporate Presentation
Strategic Resources May 2024 Corporate Presentation
 
Technology industry / Finnish economic outlook
Technology industry / Finnish economic outlookTechnology industry / Finnish economic outlook
Technology industry / Finnish economic outlook
 
FE Credit and SMBC Acquisition Case Studies
FE Credit and SMBC Acquisition Case StudiesFE Credit and SMBC Acquisition Case Studies
FE Credit and SMBC Acquisition Case Studies
 
FOREX FUNDAMENTALS: A BEGINNER'S GUIDE.pdf
FOREX FUNDAMENTALS: A BEGINNER'S GUIDE.pdfFOREX FUNDAMENTALS: A BEGINNER'S GUIDE.pdf
FOREX FUNDAMENTALS: A BEGINNER'S GUIDE.pdf
 
Call Girls Howrah ( 8250092165 ) Cheap rates call girls | Get low budget
Call Girls Howrah ( 8250092165 ) Cheap rates call girls | Get low budgetCall Girls Howrah ( 8250092165 ) Cheap rates call girls | Get low budget
Call Girls Howrah ( 8250092165 ) Cheap rates call girls | Get low budget
 
+97470301568>>buy weed in qatar,buy thc oil in qatar doha>>buy cannabis oil i...
+97470301568>>buy weed in qatar,buy thc oil in qatar doha>>buy cannabis oil i...+97470301568>>buy weed in qatar,buy thc oil in qatar doha>>buy cannabis oil i...
+97470301568>>buy weed in qatar,buy thc oil in qatar doha>>buy cannabis oil i...
 
Test bank for advanced assessment interpreting findings and formulating diffe...
Test bank for advanced assessment interpreting findings and formulating diffe...Test bank for advanced assessment interpreting findings and formulating diffe...
Test bank for advanced assessment interpreting findings and formulating diffe...
 
Responsible Finance Principles and Implication
Responsible Finance Principles and ImplicationResponsible Finance Principles and Implication
Responsible Finance Principles and Implication
 
abortion pills in Riyadh Saudi Arabia (+919707899604)cytotec pills in dammam
abortion pills in Riyadh Saudi Arabia (+919707899604)cytotec pills in dammamabortion pills in Riyadh Saudi Arabia (+919707899604)cytotec pills in dammam
abortion pills in Riyadh Saudi Arabia (+919707899604)cytotec pills in dammam
 
+971565801893>>SAFE ORIGINAL ABORTION PILLS FOR SALE IN DUBAI,RAK CITY,ABUDHA...
+971565801893>>SAFE ORIGINAL ABORTION PILLS FOR SALE IN DUBAI,RAK CITY,ABUDHA...+971565801893>>SAFE ORIGINAL ABORTION PILLS FOR SALE IN DUBAI,RAK CITY,ABUDHA...
+971565801893>>SAFE ORIGINAL ABORTION PILLS FOR SALE IN DUBAI,RAK CITY,ABUDHA...
 
Famous No1 Amil Baba Love marriage Astrologer Specialist Expert In Pakistan a...
Famous No1 Amil Baba Love marriage Astrologer Specialist Expert In Pakistan a...Famous No1 Amil Baba Love marriage Astrologer Specialist Expert In Pakistan a...
Famous No1 Amil Baba Love marriage Astrologer Specialist Expert In Pakistan a...
 
劳伦森大学毕业证
劳伦森大学毕业证劳伦森大学毕业证
劳伦森大学毕业证
 

Banking:Weakness Ahead

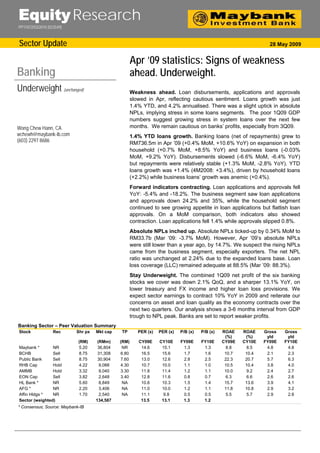
  • 1. Equity Research PP11072/03/2010 (023549) Sector Update 28 May 2009 Apr ’09 statistics: Signs of weakness Banking ahead. Underweight. Underweight (unchanged) Weakness ahead. Loan disbursements, applications and approvals slowed in Apr, reflecting cautious sentiment. Loans growth was just 1.4% YTD, and 4.2% annualised. There was a slight uptick in absolute NPLs, implying stress in some loans segments. The poor 1Q09 GDP numbers suggest growing stress in system loans over the next few Wong Chew Hann, CA months. We remain cautious on banks’ profits, especially from 3Q09. wchewh@maybank-ib.com 1.4% YTD loans growth. Banking loans (net of repayments) grew to (603) 2297 8686 RM736.5m in Apr ’09 (+0.4% MoM, +10.6% YoY) on expansion in both household (+0.7% MoM, +8.5% YoY) and business loans (-0.03% MoM, +9.2% YoY). Disbursements slowed (-6.6% MoM, -6.4% YoY) but repayments were relatively stable (+1.3% MoM, -2.8% YoY). YTD loans growth was +1.4% (4M2008: +3.4%), driven by household loans (+2.2%) while business loans’ growth was anemic (+0.4%). Forward indicators contracting. Loan applications and approvals fell YoY: -5.4% and -18.2%. The business segment saw loan applications and approvals down 24.2% and 35%, while the household segment continued to see growing appetite in loan applications but flattish loan approvals. On a MoM comparison, both indicators also showed contraction. Loan applications fell 1.4% while approvals slipped 0.8%. Absolute NPLs inched up. Absolute NPLs ticked-up by 0.34% MoM to RM33.7b (Mar ‘09: -3.7% MoM). However, Apr ‘09’s absolute NPLs were still lower than a year ago, by 14.7%. We suspect the rising NPLs came from the business segment, especially exporters. The net NPL ratio was unchanged at 2.24% due to the expanded loans base. Loan loss coverage (LLC) remained adequate at 88.5% (Mar ’09: 88.3%). Stay Underweight. The combined 1Q09 net profit of the six banking stocks we cover was down 2.1% QoQ, and a sharper 13.1% YoY, on lower treasury and FX income and higher loan loss provisions. We expect sector earnings to contract 10% YoY in 2009 and reiterate our concerns on asset and loan quality as the economy contracts over the next two quarters. Our analysis shows a 3-6 months interval from GDP trough to NPL peak. Banks are set to report weaker profits. Banking Sector – Peer Valuation Summary Stock Rec Shr px Mkt cap TP PER (x) PER (x) P/B (x) P/B (x) ROAE ROAE Gross Gross (%) (%) yld yld (RM) (RMm) (RM) CY09E CY10E FY09E FY10E CY09E CY10E FY09E FY10E Maybank * NR 5.20 36,804 NR 14.6 15.1 1.3 1.3 8.8 8.5 4.8 4.8 BCHB Sell 8.75 31,308 6.80 16.5 15.6 1.7 1.6 10.7 10.4 2.1 2.3 Public Bank Sell 8.75 30,904 7.60 13.0 12.6 2.8 2.5 22.3 20.7 5.7 6.3 RHB Cap Hold 4.22 9,088 4.30 10.7 10.0 1.1 1.0 10.5 10.4 3.8 4.0 AMMB Hold 3.32 9,040 3.30 11.8 11.4 1.2 1.1 10.0 9.2 2.4 2.7 EON Cap Sell 3.82 2,648 3.40 12.8 11.6 0.8 0.7 6.3 6.6 2.6 2.6 HL Bank * NR 5.60 8,849 NA 10.6 10.3 1.5 1.4 15.7 13.6 3.9 4.1 AFG * NR 2.20 3,406 NA 11.0 10.0 1.2 1.1 11.8 10.8 2.9 3.2 Affin Hldgs * NR 1.70 2,540 NA 11.1 9.8 0.5 0.5 5.5 5.7 2.9 2.8 Sector (weighted) 134,587 13.5 13.1 1.3 1.2 * Consensus; Source: Maybank-IB
  • 2. Banking Other indicators Deposits declined, LDR up slightly. System deposits declined marginally by 0.1% MoM (-6.2% YoY) to RM984.8b mainly due to purchase of equity issued by the banks. As a result, system loan-to- deposit ratio (LDR) rose slightly to 74.2% as at end-Apr ’09 (Mar ’09: 73.7%). This implies that the banks still have good capacity to lend. Lending rates stable. There was no further OPR reduction at 26 May’s Monetary Policy Committee meeting after three cuts since Nov ’08 totalling 150 bps. As the OPR reached a historic low of 2%, the same goes for lending and deposit rates. Commercial banks’ average base lending rate (BLR) stayed at a historic low of 5.53% as at 15 May ’09 with a total 119 bps reduction since Nov ‘08. Average lending rate (ALR) also touched a historic low of 5.13% as at end-Apr ’09. Impact of OPR cuts on BLR and FD Rate st nd rd 1 OPR cut 2 OPR cut 3 OPR cut (24 Nov ’08) (21 Jan ’09) (24 Feb ’09) OPR 3.25% (-25bps) 2.50% (-75bps) 2.00% (-50bps) SRR 3.50% (-50bps) 2.00% (-150bps) 1.00% (-100bps) BLR (average) 6.48% @ end-Dec 5.89% @ end-Feb 5.53% @ 15 Apr ’09 ‘08 (-24bps) ’09 (-59bps) (-36bps) FD rate: 1-month 3.00% (-10bps) 2.50% (-50bps) 2.00% (-50bps) 3-month 3.50% (-20bps) 3.00% (-50bps) 2.50% (-50bps) Source: Maybank-IB Capitalisation stayed strong. System capitalisation edged up with a core ratio of 12.3% (Mar ‘09: 11.6%) and RWCR of 14.2% (Mar ‘09: 13.5%) after capital raising exercises by the banks. The higher ratios had resulted in higher excess capital, by RM5.1b, to absorb potential losses. We estimate the system can absorb a loss of RM54.7b. Loans Momentum (% YoY) May 08 Jun 08 Jul 08 Aug 08 Sep 08 Oct 08 Nov 08 Dec 08 Jan 09 Feb 09 Mar 09 Apr 09 Gross loans +11.0 +11.7 +9.9 +11.0 +10.6 +10.3 +10.7 +12.8 +11.7 +10.9 +10.9 +10.6 - Businesses +12.6 +14.4 +9.4 +11.4 +9.5 +8.8 +7.8 +13.2 +11.8 +10.0 +9.5 +9.2 - Households +8.7 +8.9 +8.8 +8.7 +9.1 +8.9 +9.0 +9.1 +9.1 +8.9 +8.8 +8.5 Applications -9.7 -5.2 +11.9 +25.5 -5.8 -7.9 -32.6 -18.8 -21.0 +8.1 +5.4 -5.4 Approvals -19.0% -23.4 +2.3 +15.8 -2.9 -14.4 -44.0 -23.7 -35.5 -15.9 -0.7 -18.2 Source: Bank Negara Interest Rates (%) May 08 Jun 08 Jul 08 Aug 08 Sep 08 Oct 08 Nov 08 Dec 08 Jan 09 Feb 09 Mar 09 Apr 09 BLR 6.72 6.72 6.72 6.72 6.72 6.72 6.66 6.48 6.38 5.89 5.53 5.53 ALR 6.13 6.08 6.02 5.98 5.96 6.01 5.98 5.86 5.77 5.49 5.16 5.13 ADR 3.31 3.31 3.31 3.31 3.31 3.31 3.21 3.16 2.63 2.16 2.14 2.14 ALR-ADR 2.82 2.77 2.71 2.67 2.65 2.70 2.77 2.70 3.14 3.33 3.02 2.99 ALR-BLR -0.59 -0.64 -0.70 -0.74 -0.76 -0.71 -0.68 -0.62 -0.62 -0.40 -0.37 -0.40 ADR-CPI -0.49 -4.38 -5.20 -5.19 -4.90 -4.32 -2.50 -1.24 -1.27 -1.54 -1.38 -0.91 Note: ADR refers to the average of fixed deposit rates; Source: Bank Negara Asset Quality & Capitalisation May 08 Jun 08 Jul 08 Aug 08 Sep 08 Oct 08 Nov 08 Dec 08 Jan 09 Feb 09 Mar 09 Apr 09 Gross NPL 37.8 36.9 36.7 36.8 36.1 36.3 35.9 35.1 34.9 34.9 33.6 33.7 (3-mth) (RMb) Net NPL (%) 2.81 2.66 2.53 2.50 2.40 2.43 2.38 2.25 2.21 2.23 2.24 2.24 LLC(%) 80.9 82.4 84.5 85.1 86.9 86.7 86.8 89.1 89.6 89.2 88.3 88.5 Tier 1 cap (%) 9.9 10.8 10.9 10.8 10.6 10.4 10.4 10.6 11.1 11.2 11.6 12.3 RWCR (%) 13.0 13.6 13.6 13.4 13.1 12.6 12.5 12.1 13.0 13.2 13.5 14.2 Source: Bank Negara 28 May 2009 Page 2 of 3
  • 3. Banking Definition of Ratings Maybank Investment Bank Research uses the following rating system: BUY Total return is expected to be above 10% in the next 12 months HOLD Total return is expected to be between -5% to 10% in the next 12 months SELL Total return is expected to be below -5% in the next 12 months Applicability of Ratings The respective analyst maintains a coverage universe of stocks, the list of which may be adjusted according to needs. Investment ratings are only applicable to the stocks which form part of the coverage universe. Reports on companies which are not part of the coverage do not carry investment ratings as we do not actively follow developments in these companies. Some common terms abbreviated in this report (where they appear): Adex = Advertising Expenditure FCF = Free Cashflow PE = Price Earnings BV = Book Value FV = Fair Value PEG = PE Ratio To Growth CAGR = Compounded Annual Growth Rate FY = Financial Year PER = PE Ratio Capex = Capital Expenditure FYE = Financial Year End QoQ = Quarter-On-Quarter CY = Calendar Year MoM = Month-On-Month ROA = Return On Asset DCF = Discounted Cashflow NAV = Net Asset Value ROE = Return On Equity DPS = Dividend Per Share NTA = Net Tangible Asset ROSF = Return On Shareholders’ Funds EBIT = Earnings Before Interest And Tax P = Price WACC = Weighted Average Cost Of Capital EBITDA = EBIT, Depreciation And Amortisation P.A. = Per Annum YoY = Year-On-Year EPS = Earnings Per Share PAT = Profit After Tax YTD = Year-To-Date EV = Enterprise Value PBT = Profit Before Tax Disclaimer This report is for information purposes only and under no circumstances is it to be considered or intended as an offer to sell or a solicitation of an offer to buy the securities referred to herein. Investors should note that income from such securities, if any, may fluctuate and that each security’s price or value may rise or fall. Opinions or recommendations contained herein are in form of technical ratings and fundamental ratings. Technical ratings may differ from fundamental ratings as technical valuations apply different methodologies and are purely based on price and volume-related information extracted from Bursa Malaysia Securities Berhad in the equity analysis. Accordingly, investors may receive back less than originally invested. Past performance is not necessarily a guide to future performance. This report is not intended to provide personal investment advice and does not take into account the specific investment objectives, the financial situation and the particular needs of persons who may receive or read this report. Investors should therefore seek financial, legal and other advice regarding the appropriateness of investing in any securities or the investment strategies discussed or recommended in this report. The information contained herein has been obtained from sources believed to be reliable but such sources have not been independently verified by Maybank Investment Bank Bhd and consequently no representation is made as to the accuracy or completeness of this report by Maybank Investment Bank Bhd and it should not be relied upon as such. Accordingly, no liability can be accepted for any direct, indirect or consequential losses or damages that may arise from the use or reliance of this report. Maybank Investment Bank Bhd, its affiliates and related companies and their officers, directors, associates, connected parties and/or employees may from time to time have positions or be materially interested in the securities referred to herein and may further act as market maker or may have assumed an underwriting commitment or deal with such securities and may also perform or seek to perform investment banking services, advisory and other services for or relating to those companies. Any information, opinions or recommendations contained herein are subject to change at any time, without prior notice. This report may contain forward looking statements which are often but not always identified by the use of words such as “anticipate”, “believe”, “estimate”, “intend”, “plan”, “expect”, “forecast”, “predict” and “project” and statements that an event or result “may”, “will”, “can”, “should”, “could” or “might” occur or be achieved and other similar expressions. Such forward looking statements are based on assumptions made and information currently available to us and are subject to certain risks and uncertainties that could cause the actual results to differ materially from those expressed in any forward looking statements. Readers are cautioned not to place undue relevance on these forward- looking statements. Maybank Investment Bank Bhd expressly disclaims any obligation to update or revise any such forward looking statements to reflect new information, events or circumstances after the date of this publication or to reflect the occurrence of unanticipated events. This report is prepared for the use of Maybank Investment Bank Bhd's clients and may not be reproduced, altered in any way, transmitted to, copied or distributed to any other party in whole or in part in any form or manner without the prior express written consent of Maybank Investment Bank Bhd and Maybank Investment Bank Bhd accepts no liability whatsoever for the actions of third parties in this respect. This report is not directed to or intended for distribution to or use by any person or entity who is a citizen or resident of or located in any locality, state, country or other jurisdiction where such distribution, publication, availability or use would be contrary to law or regulation. Published / Printed by Maybank Investment Bank Berhad (15938-H) (Formerly known as Aseambankers Malaysia Berhad) (A Participating Organisation of Bursa Malaysia Securities Berhad) 33rd Floor, Menara Maybank, 100 Jalan Tun Perak, 50050 Kuala Lumpur Tel: (603) 2059 1888; Fax: (603) 2078 4194 Stockbroking Business: Level 8, MaybanLife Tower, Dataran Maybank, No.1, Jalan Maarof 59000 Kuala Lumpur Tel: (603) 2297 8888; Fax: (603) 2282 5136 http://www.maybank-ib.com 28 May 2009 Page 3 of 3