
Recomendados
Recomendados
Mais conteúdo relacionado
Semelhante a American Journal of Medical Quality28(5) 414 –421© 2013 by.docx
Semelhante a American Journal of Medical Quality28(5) 414 –421© 2013 by.docx (20)
Mais de greg1eden90113
Mais de greg1eden90113 (20)
Último
Último (20)
American Journal of Medical Quality28(5) 414 –421© 2013 by.docx
- 1. American Journal of Medical Quality 28(5) 414 –421 © 2013 by the American College of Medical Quality Reprints and permissions: sagepub.com/journalsPermissions.nav DOI: 10.1177/1062860612473635 ajmq.sagepub.com Article The role of leaders in health care organizations, particularly their commitment to prioritize patient safety, is crucial in creating and maintaining a care delivery system that strives to simultaneously prevent future harmful events while being responsive to adverse events and their related conse- quences.1,2 Executive or leadership walkrounds (WRs) is a promising tool to identify risk and areas of safety concerns and to solve systemic problems such as ineffective com- munication.3 To this end, the WR concept has the follow- ing objectives: (a) increase the awareness of safety issues for all clinicians and staff, (b) demonstrate that patient safety is a high priority for senior leadership, (c) educate staff and reinforce patient safety concepts such as nonpuni- tive reporting, and (d) obtain and act on information elic- ited from staff about safety problems and issues.3 Ideally, WRs create formal, albeit comfortable, ven- ues for dialogue between leaders and frontline staff to identify opportunities to improve care processes leading to better patient safety outcomes.4 Experiences of clini- cians and executives indicate that WRs help educate
- 2. leadership and frontline clinicians about patient safety concepts and lead to cultural changes such as increased transparency in discussions of adverse events and an improved rate of safety-based changes.5 One year following WR implementation in a 1000-bed tertiary care facility in Canada, there was a 64% to 80% increase in the number of identified patient safety issues that had been resolved or had active improvement work in progress.6 Nine out of 10 clinicians reported that they felt comfortable when openly and honestly discussing patient safety issues, and they had enhanced awareness of patient safety. In another study at a 711-bed tertiary care 473635AJMXXX10.1177/1062860612473635Ameri can Journal of Medical QualitySchwendimann et al 1University of Basel, Institute of Nursing Science, Basel, Switzerland 2Patient Safety Training and Research Center, Duke University Health System, Durham, NC 3Duke University School of Nursing, Durham, NC 4Duke University Hospital, Durham, NC 5Duke University School of Medicine, Durham, NC 6Pascal Metrics Inc, Washington, DC 7Duke University Department of Psychiatry, Durham, NC The authors declared no potential conflicts of interest with respect to the research, authorship, and/or publication of this article. The authors received no financial support for the research, authorship, and/or publication of this article.
- 3. Corresponding Author: René Schwendimann, PhD, RN, University of Basel, Institute of Nursing Science, Bernoullistrasse 28, 4056 Basel, Switzerland. Email: [email protected] A Closer Look at Associations Between Hospital Leadership Walkrounds and Patient Safety Climate and Risk Reduction: A Cross-Sectional Study René Schwendimann, PhD, RN,1,2,3 Judy Milne, MSN, RN,2,4 Karen Frush, MD, BSN,2,3,5 Dietmar Ausserhofer, PhD, RN,1 Allan Frankel, MD,6 and J. Bryan Sexton, PhD2,7 Abstract Leadership walkrounds (WRs) are widely used in health care organizations to improve patient safety. This retrospective, cross-sectional study evaluated the association between WRs and caregiver assessments of patient safety climate and patient safety risk reduction across 49 hospitals in a nonprofit health care system. Linear regression analyses using units’ participation in WRs were conducted. Survey results from 706 hospital units revealed that units with ≥60% of caregivers reporting exposure to at least 1 WR had a significantly higher safety climate, greater patient safety risk reduction, and a higher proportion of feedback on actions taken as a result of WRs compared with those units with <60% of caregivers reporting exposure to WRs. WR participation at the unit level reflects a frequency effect as a function of units with none/low, medium, and high leadership WR exposure. Keywords leadership walkrounds, safety climate, leadership, patient safety, hospital
- 4. [email protected] - February 18, 2020 - Read articles at www.DeepDyve.com Schwendimann et al 415 hospital, nurses participating in WRs scored significantly higher in safety climate attitudes (73% positive) com- pared with controls (53% positive).7 The authors con- cluded that safety climate scores likely will increase in clinical areas in which caregivers are engaged in rigor- ously implemented WRs. However, such implementation requires significant organizational will in a given hospi- tal.8 In 2002, the University of Michigan Medical Center implemented hospital-wide Patient Safety Rounds (PSRs) as a modified approach of WRs. In a follow-up study, researchers conducted a retrospective study of more than 900 staff members who had participated in a total of 70 PSRs over the last 4 years. Overall, patient safety was enhanced as demonstrated by the resolution of a series of local safety problems (eg, repair of equipment), the development of safety policies to address safety concerns at the regional level (eg, intravenous medication policy), and the initiation of systemwide changes (eg, simulation- based training on central line catheter insertion). In addi- tion, clinical staff who participated in PSRs were more likely to report errors and near misses and were more likely to perceive that their managers promote patient safety as compared with those who did not participate in PSRs. However, it remains unclear to what extent these differences are attributable to the PSRs.9 Although the concept of WRs is popular and widely used in North American hospitals,9-12 the broad impact of
- 5. WRs on specific patient safety attitudes of clinical staff as well as clinical patient outcomes is less well known. One of the barriers to rigorous scientific scrutiny of WRs is that their format varies widely between the institutions and the leaders facilitating the discussions. For example, the authors’ experiences with conducting and investigat- ing WRs have included formats as varied as hallway conversations, breakroom discussions over snacks, audi- torium presentations, and “Safe-Tea Time,” during which general questions were asked over tea. Other variations range from collecting rigorous minutes, to refusing to let names or details be written down at all.13,14 To date, little is known about the frequency of WRs and their associa- tion with safety culture, although reported WR frequen- cies range from weekly WRs across the hospital8 to monthly visits in the same hospital units or clinical areas, to random visits to random units once a month.6,7 The aim of this study was to evaluate the association between leadership WRs and caregiver assessments of patient safety climate, patient safety risk reduction, and feedback on leadership WR-related actions. The authors hypothesized that frequency of caregivers’ participation in WRs (ie, exposure) at the unit level was positively associated with favorable assessments of patient safety climate, patient risk reduction, and actions taken as a result of WRs. More specifically, it was hypothesized that higher rates of participation in WRs would be associ- ated with better safety climate, more feedback received on actions taken as a result of WRs, and patient safety risk reduction at the unit level. Methods Survey data from 49 hospitals of a nonprofit US health system were used for this cross-sectional study. The
- 6. study setting consisted of a mix of clinical areas (eg, medical-surgical units, pharmacy, intensive care units, radiology) and included caregivers such as nurses, phy- sicians, technicians, support staff, and others directly or indirectly involved in patient care. All participating hospitals had implemented WRs between 2002 and 2005 as part of their quality improvement strategies related to enhancing patient safety culture, which was initiated in 2001 and 2003 with leadership WRs train- ing workshops from the Institute for Healthcare Improvement15 and annual patient safety, quality, and risk management conferences, respectively. Thus, all units within hospitals were included in the overall health system’s quality improvement strategy that focused on assessing the individual hospital’s safety culture, including features such as leadership WR expo- sure, teamwork climate, and safety climate, in its vari- ous clinical areas. Leadership WRs The WR approach used in this study is based on the model developed by Allan Frankel3 and consisted of regular monthly visits by hospital executives (eg, depart- ment chiefs, chairs, risk managers) to clinical areas to discuss patient safety issues with caregivers. The execu- tives were instructed on how to conduct and schedule their rounds and use rounds to address concerns related to patient safety. The leaders were given scripted, open- ended questions that should be asked during each round. These might include questions about staff members’ specific concerns, such as “What keeps you up at night?” or “What aspects of the environment are likely to lead to the next harmful event?” The questions raised in the WR sessions are intended to initiate group discussion and stimulate safety problem resolution. It was important for leaders to explain that their desire was to talk openly and
- 7. honestly with staff about “what is the next thing that could harm a patient,” and to reassure staff that any infor- mation discussed during the WR would be kept confiden- tial. Safety issues raised during the sessions were documented and led to actions, which were followed up by leaders providing feedback to participating staff (eg, at team meetings). For study purposes, 2 questions from a version of the Safety Attitudes Questionnaire (SAQ) were used; these questions were modified to include specific WR-related items: (a) “Does your clinical area use Patient Safety [email protected] - February 18, 2020 - Read articles at www.DeepDyve.com 416 American Journal of Medical Quality 28(5) Leadership WalkRounds to discuss with senior leaders any issues that could harm patients or undermine the safe delivery of care? (Yes; No; Not Sure)” and (b) “How often did you participate? (0, 1, 2, 3-4, 5-7, 8 or more, Not Sure).” The other WR items on the survey were the fol- lowing: “Did you receive feedback about actions taken as a result of the WalkRounds? (Yes, No, Not Sure)” and “Do you think that 1 or more patient safety risks were reduced as a result of the WalkRounds? (Yes, No, Not Sure).” Patient Safety Climate Patient safety climate, defined as “the perceived level of commitment to and focus on patient safety within a given unit,” is a consensus assessment about patient safety- related norms and behaviors. Thus, patient safety atti-
- 8. tudes of caregivers were measured with the 7-item patient safety climate subscale from the SAQ. Each item is rated on a 5-point Likert-type scale ranging from dis- agree strongly to agree strongly. Examples of questions included statements such as “I would feel safe being treated here as a patient” or “In this clinical area, it is difficult to discuss mistakes.” There is growing evidence that the SAQ elicits attitudes that are responsive to interventions associated with caregivers’ behaviors, such as communication and teamwork to improve patient safety.14,16 Patient Safety Risk Reduction The WR item “Do you think that 1 or more patient safety risks were reduced as a result of the WalkRounds? (Yes, No, Not Sure)” was the self-reported caregiver assess- ment of the extent to which patient safety issues were elicited and acted on to reduce risk. Anecdotal examples include double-checking medication before administer- ing, supported ambulation from bed to wheelchairs, and unit staff briefings before morning shifts, among others. Feedback on WR-Related Actions The nature of leadership WRs is to discuss patient safety issues and concerns at the unit level and include appro- priate follow-up actions using the leader’s position to make things happen at hierarchical levels above indi- vidual units. Accordingly, providing feedback to the involved unit caregivers about actions taken as a result of these WRs is essential to keep momentum and build trust in management’s ability to solve patient safety problems. For instance, unit managers and safety officers track planned measures at the unit or departmental level fol- lowing WRs for updates and communicate this follow-up information to caregivers and senior leadership with the
- 9. aim of supplying accurate feedback to ensure completion of improvement tasks.3 Therefore, the modified SAQ included the item “Did you receive feedback about actions taken as a result of the WalkRounds? (Yes/No/Not Sure)” to capture the care- giver’s experience. Data Collection After the patient safety survey was initiated by the health system, in each hospital, the questionnaire was adminis- tered (paper and pencil) in all clinical patient care areas to caregivers who had a working commitment of at least 50% in a specific care area and who had been working full-time or part-time for at least 4 weeks. Participation was voluntary. Completing the questionnaire implied consent and took approximately 10 minutes. Data collec- tion took place between May and September 2006 as a partial evaluation of the hospital’s strategies to enhance patient safety. Data from returned questionnaires were scanned, exported to statistical software, and checked for consistency. Statistical Analysis Descriptive analyses such as frequencies, percentages, means (±standard deviation [SD]), and graphs were used to describe demographics and the 3 variables: safety cli- mate, exposure to leadership WRs, and patient safety risk reduction. Units were included in the analyses if at least 60% of the respective caregivers completed the questionnaire and there were at least 5 respondents per unit. Leadership WR exposure was aggregated at the unit level by calculating the percentage of respondents within
- 10. a unit who reported participating in leadership WRs at least once. Safety climate was calculated for individual respondents by taking the average of the scaled items and then calculating the percentage of respondents within a unit who reported positive safety climate (ie, proportion of those who agreed slightly or strongly).17,18 Patient safety risk reduction and received feedback about actions taken as a result of WRs were both calcu- lated as the proportion of respondents within a unit who answered “Yes,” that 1 or more patient risks were reduced as a result of WRs or that they received feedback about actions taken as a result of WRs, respectively (ie, respon- dents who answered “No” or “Not Sure” to these items were excluded). Linear regression analyses were used to test the assumption that the rate of caregiver participation in WRs at the unit level was positively associated with safety climate, patient risk reduction, and feedback about WR actions. The predictor variable, unit exposure to WRs, [email protected] - February 18, 2020 - Read articles at www.DeepDyve.com Schwendimann et al 417 was categorized as follows: (a) 0% to 19% of caregivers reported participating in WRs = no or low exposure; (b) 20% to 59% = medium exposure; and (c) ≥60% = high exposure. The thresholds for this categorization came from earlier studies using the SAQ.8,14,19 Because the data aggregated at the unit level were hierarchically structured (units within hospitals), the authors considered multilevel
- 11. modeling to be appropriate and included hospitals as a random effect. All analyses were performed using IBM SPSS Statistics, version 19.0.1 (IBM Inc, Armonk, NY) and STATA 11.2 (StataCorp LP, College Station, TX). Results A total of 19,053 SAQ surveys were received from 49 hospitals and included 706 clinical and nonclinical units (4-38 per hospital); the units included medical and surgical patient units, critical care units, hospital pharma- cies, and med tech laboratories (overall response rate = 80.2%; range = 64% to 100% per hospital). Mean and median number of respondents per unit were 27 (SD 19) and 22, respectively. Respondent characteristics are shown in Table 1. Leadership WRs Based on the item “Does your clinical area use Patient Safety Leadership WalkRounds to discuss with senior leaders any issues that could harm patients or undermine the safe delivery of care,” the percentage of people within units who answered “Yes” ranged from 0% (49 units) to ≥80% (16 units). More specifically, using the item “How often did you participate?” 100 units (14.2%) had 0 respondents who self-reported participating at least once in WRs, whereas the proportion of respon- dents who reported that they themselves had participated at least once ranged from 4% to 100% in the remaining 606 units (85.8%). Only 52 (7.4%) of the 706 hospital units in this study reported WR exposure above the 60% threshold (60% of respondents participating in WRs at least once).
- 12. Safety Climate In 419 (59.3%) of the total 706 units, ≥60% of the respon- dents reported a positive safety climate. Overall, the propor- tion of respondents per unit reporting a “good safety climate” ranged from 0% (1 unit) to 100% (35 units; Figure 1). Patient Safety Risk Reduction Of the total 706 units, the percentages of respondents per unit reporting safety risk reduction following WR expo- sure ranged from 0% (62 units) to 100% (1 unit; Figure 2). More specifically, ≥60% of the respondents reported patient safety risk reduction as a result of WR exposure in only 41 (5.8%) of the units. Table 1. Respondent Characteristics (N = 19 053). Female sex, n (%)a 15 337 (82.8) Professional categories, n (%)a Nurses (registered nurse, nurse manager, LVN/LPN) 8463 (46.3) Support staff (eg, unit assistant, clerk, secretary) 2960 (16.2) Technicians (eg, EKG, laboratory, radiology) 2253 (12.3) Physicians (attending/staff/resident physician) 1267 (7.0)
- 13. Therapists (eg, respiratory, PT, OT, speech, dietician) 1280 (7.0) Pharmacist 331 (1.8) Nurse practitioner/physician assistant 105 (0.6) Medical administrator 30 (0.2) Others (eg, maintenance personnel) 1594 (8.7) Years in organization, n (%)a <1 year 2324 (12.8) 1-2 years 2640 (14.6) 3-4 years 5432 (28.5) 5-10 years 2301 (12.1) 11-20 years 2798 (14.7) >20 years 2633 (13.8) Abbreviations: LVN, licensed vocational nurse; LPN, licensed practical nurse; EKG, electrocardiogram; PT, physical therapist; OT, occupational therapist. aMissing data: sex = 541; professional categories = 770; years in organization = 925. Figure 1. Safety climate, percentage of respondents reporting “good safety climate” (n = 706 units). [email protected] - February 18, 2020 - Read articles at www.DeepDyve.com 418 American Journal of Medical Quality 28(5)
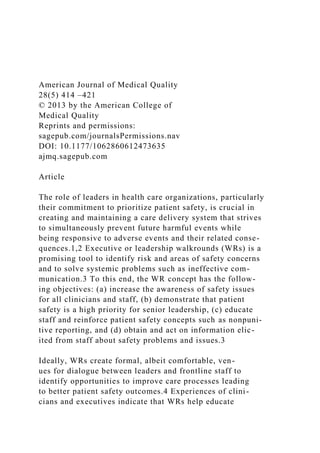
- 14. Actions Taken as a Result of WRs Percentages of respondents per unit reporting feedback about actions taken as a result of WRs ranged from 0% (79 units) to 100% (1 unit; Figure 3). More specifically, ≥60% of the respondents reported feedback about actions taken as a result of WR in only 34 (4.8%) of the 706 units. Association Between Leadership WR Exposure, Safety Climate, Patient Safety Risk Reduction, and Feedback About WR Actions Taken Units with ≥60% of caregivers reporting at least 1 WR exposure had a significantly higher safety climate com- pared with those units in either of the other categories (Figure 4). In the multilevel regression analysis testing for associations between unit WR exposure and unit safety climate, significant variability between hospitals was observed (variance = 55.02; 95% confidence interval [CI] = 29.14-103.91). In addition, units in which ≥60% of caregivers reported at least 1 WR exposure reported sig- nificantly higher patient safety risk reduction compared with units in either of the other categories (Figure 4). The regression analysis for unit WR and unit patient safety risk reduction, considering hospital level as random effects, revealed significant variability between hospitals (variance = 38.58; 95% CI = 21.36-69.67). Furthermore, units in which ≥60% of caregivers reported at least 1 WR exposure reported significantly higher feedback about WR actions compared with those units in either of the other categories (Figure 4). The regression analysis for unit WR and received feedback about actions taken as a result of WR, considering hospital level as random effects, revealed significant variability between hospitals (variance = 24.26; 95% CI = 12.21-48.18).
- 15. Discussion This retrospective multicenter study on the relationship between WRs and patient safety climate, patient safety risk reduction, and WR feedback included more than 19 000 caregivers from 706 clinical areas in 49 hospitals of a large nonprofit health system in the United States. A strong association was observed between exposure of caregivers to WRs and all 3 outcome variables at the hospital unit level. These associations may reflect a frequency effect as a function of units with none/low, medium, and high leadership WR exposure, whereby these effects varied significantly between participating hospitals. Differences in safety climate scores of caregivers in units with a higher WR exposure compared with units with a relatively low WR exposure might indicate an effect of this widely applied intervention on team perfor- mance and perceptions. It appears that WRs elicited patient safety issues and potential solutions within these caregiver teams, allowing them not only to express their concerns to WR leaders but also to openly discuss identi- fied aspects of what may harm patients and how the care teams may eliminate those risks. Figure 2. Patient safety risk reduction, percentage of respondents reporting patient safety risk reduction following walkround (n = 706). Figure 3. Actions taken as a result of the walkround (WR), percentage of respondents reporting received feedback about actions taken as a result of the WR (n = 706). [email protected] - February 18, 2020 - Read articles at www.DeepDyve.com
- 16. Schwendimann et al 419 Caregivers’ notions of patient safety risk reduction and feedback about actions taken as a result of the WRs also revealed significant differences between units with relatively high WR exposure compared with those units with relatively low WR exposure. This indicates that WRs likely impact caregiver behavior toward patient safety. Although the characteristics of patient safety risk reduction and actions taken as a result of the WRs were not explored in detail, findings indicate that greater num- bers of caregivers being exposed to WRs was associated with greater risk reduction and more feedback on WR-related actions at the unit level. From anecdotal evi- dence, caregiver teams used a variety of teamwork behaviors such as structured information delivery, criti- cal language, and debriefing20 to resolve patient safety defects and provide safe care. Units with relatively high WR exposure showed favor- able results in terms of safety climate scores when com- pared with units having a relatively low WR exposure. One could argue that WRs lead to proactively identifying safety risks, facilitating open discussion of solutions, and providing feedback on actions taken as a result of the dis- cussion. These activities likely positively influence safety climate, because units with more exposure to these expe- riences reported a significantly higher safety climate. These findings are in line with another study in which WRs were associated with increased caregivers safety climate perceptions.8 That study relied on a pre–post design comparing 21 clinical areas in 2 hospitals over time, whereas the current study findings are based on a
- 17. 1-time observation of a multicentre sample of more than 700 hospital units showing strong associations between safety climate and the rate of WR exposure. Although examples of patient safety risk reduction activities were not explored in detail and rely solely on caregiver self- report, these results are clearly in line with another study showing that risk reduction related to specific actions resulting from WRs is a common strategy to provide safe care.9 WR data from the current study suggest that WRs encouraged teams to speak up about errors and potential safety risks, as well as to adopt practices shared through “lessons learned.” In another study, improvements in safety culture and facilitated reporting led to substantial improvements in safety practices such as equipment replacement, process changes, and effective communica- tion.10 Such safety practices also were employed in many of the clinical units in the current study, according to anecdotal evidence. Each may have influenced caregivers’ perceptions of patient safety climate. However, the fact remains that more than 3 times the number of units with >60% participation in WRs had positive patient safety climate scores compared with units with participation below the 60% threshold. Therefore, the authors attribute the positive safety climate to WR exposure, especially in those units with high WR exposure rates compared with those with relatively low exposure. This study reinforces the argument that “leaders must see patient safety problems as problems of their system (eg, different units within hospitals) not of their employ- ees,”1 supported by the use of WRs that allow leaders to tap into questions such as “How did this incident occur?” or “What in our treatment chain could harm a patient?” rather than “Who did it?” or “Who was at fault?” In this study, hospital units that participated in WRs with senior
- 19. 90 100 0%-19% exposed to WR (n=259 units) 20%-59% exposed to WR (n=395 units) ≥60% exposed to WR (n=52 units) (p=0.149) (p=0.000) (p=0.000) (p=0.000) (p=0.000) (p=0.000) Pa�ent safety risk reduc�on Feedback about WR ac�ons Figure 4. Association between low, medium, and high walkround (WR) exposure, safety climate, risk reduction, and feedback about WR actions taken (n = 706 units). [email protected] - February 18, 2020 - Read articles at www.DeepDyve.com
- 20. 420 American Journal of Medical Quality 28(5) leaders demonstrated enhanced patient safety perfor- mance, as evidenced by improved safety culture scores and increased risk reduction efforts. Indeed, units with high WR exposure reported some of the highest safety climate scores and most robust risk reduction strategies. Study Limitations Several study limitations must be recognized. First, the reliance on cross-sectional surveys allows for observa- tions and associations to be made, whereas causal rela- tionships between WR frequency and improvements in safety climate could not be established. Second, patient safety “risk reduction” was noted on the questionnaire as “Do you think one or more patient safety risks were reduced as a result of WalkRounds? (Yes, No, Not Sure),” such that exploring the specific patient safety risk reduction strategies or the format and content of WRs was beyond the scope of the current study. Nevertheless, the results suggest that higher WR frequency was associ- ated with larger proportions of respondents reporting that they thought one or more patient safety risks were reduced as a result. Third, the science of assessing and improving safety culture is not yet mature, and the use of a 60% positive threshold is based on previous experience and a priori thresholds used in previous safety culture studies. Fourth, other activities and safety practices (eg, risk reduction practices such as error reporting and dis- cussion or safety debriefing) that have been used in the study units in addition to the WRs may have contributed to the positive patient safety climate (above the 60% threshold) in many units. Nevertheless, the 60% thresh-
- 21. old is quite conservative relative to other standards,21 the response rates for this study were relatively high, and the sample was large. Moreover, the focus on rates of WR exposure rather than format or content, while a limita- tion, is also a methodological option that others may choose to explore, as it allows for systematic compari- sons between units, over time, regardless of the type of unit, background of the senior leader, length of the WR, location of the WR, and dynamics between the caregivers and the senior leaders. Conclusion These findings from a large retrospective study indicate that WR participation is associated with a positive safety climate, safety risk reduction, and feedback about WR actions. This study substantiates preliminary findings on …