SlideShare uma empresa Scribd logo
1 de 12
Baixar para ler offline
Office: (832) 326-5787
Courtney@CourtneyFoster.com
www.ReferredRealtyMT.com
Courtney Foster
Referred Realty Group
Each data point is 12 months of activity. Data is from February 5, 2018.
All data from Big Sky Country MLS, a subsidiary of the Gallatin Association of REALTORS®. InfoSparks © 2018 ShowingTime.
January Homes for Sale
Bozeman & Belgrade & Three Forks & Big Sky
0
100
200
300
400
500
600
2016 2017 2018
507
414
362
-18.3% -12.6%
84 79 68
-6.0% -13.9%
27 26 34
-3.7% +30.8%
260
240
195
-7.7% -18.8%
Bozeman Belgrade Three Forks Big Sky
Office: (832) 326-5787
Courtney@CourtneyFoster.com
www.ReferredRealtyMT.com
Courtney Foster
Referred Realty Group
Each data point is one month of activity. Data is from February 5, 2018.
All data from Big Sky Country MLS, a subsidiary of the Gallatin Association of REALTORS®. InfoSparks © 2018 ShowingTime.
January New Listings
Bozeman & Belgrade & Three Forks & Big Sky
0
25
50
75
100
125
150
175
2016 2017 2018
115
137
106
+19.1% -22.6%
24
33 33
+37.5% 0.0%
3 3 5
0.0% +66.7%
41
15
27
-63.4% +80.0%
Bozeman Belgrade Three Forks Big Sky
Office: (832) 326-5787
Courtney@CourtneyFoster.com
www.ReferredRealtyMT.com
Courtney Foster
Referred Realty Group
Each data point is one month of activity. Data is from February 5, 2018.
All data from Big Sky Country MLS, a subsidiary of the Gallatin Association of REALTORS®. InfoSparks © 2018 ShowingTime.
January Pending Sales
Bozeman & Belgrade & Three Forks & Big Sky
0
20
40
60
80
100
120
140
2016 2017 2018
85
113
118
+32.9% +4.4%
23
37
30
+60.9% -18.9%
2 3
6
+50.0% +100.0%
24
28
25
+16.7% -10.7%
Bozeman Belgrade Three Forks Big Sky
Office: (832) 326-5787
Courtney@CourtneyFoster.com
www.ReferredRealtyMT.com
Courtney Foster
Referred Realty Group
Each data point is one month of activity. Data is from February 5, 2018.
All data from Big Sky Country MLS, a subsidiary of the Gallatin Association of REALTORS®. InfoSparks © 2018 ShowingTime.
January Closed Sales
Bozeman & Belgrade & Three Forks & Big Sky
0
20
40
60
80
100
120
2016 2017 2018
83
99
80
+19.3% -19.2%
23
26
16
+13.0% -38.5%
0 1
6
–– +500.0%
8 10
13
+25.0% +30.0%
Bozeman Belgrade Three Forks Big Sky
Office: (832) 326-5787
Courtney@CourtneyFoster.com
www.ReferredRealtyMT.com
Courtney Foster
Referred Realty Group
Each data point is one month of activity. Data is from February 5, 2018.
All data from Big Sky Country MLS, a subsidiary of the Gallatin Association of REALTORS®. InfoSparks © 2018 ShowingTime.
January Average Sales Price
Bozeman & Belgrade & Three Forks & Big Sky
$0
$0.2M
$0.4M
$0.6M
$0.8M
$1.0M
$1.2M
$1.4M
2016 2017 2018
$341,212
$491,826
$448,990
+44.1% -8.7%
$320,907 $320,959
$272,555
0.0% -15.1%
$30,000
$209,900
–– +599.7%
$1,201,609
$623,325
$443,254
-48.1% -28.9%
Bozeman Belgrade Three Forks Big Sky
Office: (832) 326-5787
Courtney@CourtneyFoster.com
www.ReferredRealtyMT.com
Courtney Foster
Referred Realty Group
Each data point is one month of activity. Data is from February 5, 2018.
All data from Big Sky Country MLS, a subsidiary of the Gallatin Association of REALTORS®. InfoSparks © 2018 ShowingTime.
January Months Supply of Homes for Sale
Bozeman & Belgrade & Three Forks & Big Sky
0.0
5.0
2.5
7.5
10.0
12.5
15.0
2016 2017 2018
3.6
2.2 2.1
-38.9% -4.5%
2.3
1.5
1.7
-34.8% +13.3%
5.4
4.2
3.0
-22.2% -28.6%
13.6
9.7
8.9
-28.7% -8.2%
Bozeman Belgrade Three Forks Big Sky
Office: (832) 326-5787
Courtney@CourtneyFoster.com
www.ReferredRealtyMT.com
Courtney Foster
Referred Realty Group
Each data point is one month of activity. Data is from February 5, 2018.
All data from Big Sky Country MLS, a subsidiary of the Gallatin Association of REALTORS®. InfoSparks © 2018 ShowingTime.
January Median Days on Market
Bozeman & Belgrade & Three Forks & Big Sky
0
100
200
300
400
500
600
2016 2017 2018
66
52 43
-21.2% -17.3%
24 33 42
+37.5% +27.3%
496
27
–– -94.6%
336
166
99
-50.6% -40.4%
Bozeman Belgrade Three Forks Big Sky
Office: (832) 326-5787
Courtney@CourtneyFoster.com
www.ReferredRealtyMT.com
Courtney Foster
Referred Realty Group
Each data point is one month of activity. Data is from February 5, 2018.
All data from Big Sky Country MLS, a subsidiary of the Gallatin Association of REALTORS®. InfoSparks © 2018 ShowingTime.
January Average Price Per Square Foot
Bozeman & Belgrade & Three Forks & Big Sky
$0
$50
$100
$150
$200
$250
$300
$350
2016 2017 2018
$166
$209
$218
+25.9% +4.3%
$152
$161 $159
+5.9% -1.2%
$54
$167
–– +209.3%
$312 $313
$305
+0.3% -2.6%
Bozeman Belgrade Three Forks Big Sky
Local Market Update – December 2017
This is a research tool provided by the Big Sky Country MLS
Bozeman City Limits
Single Family December Year to Date
Key Metrics 2016 2017 % Change Thru 12-2016 Thru 12-2017 % Change
New Listings 21 21 0.0% 669 638 - 4.6%
Pending Sales 26 25 - 3.8% 600 564 - 6.0%
Closed Sales 39 39 0.0% 588 565 - 3.9%
Days on Market Until Sale 50 75 + 50.0% 64 58 - 9.4%
Median Sales Price* $330,000 $390,000 + 18.2% $359,250 $381,500 + 6.2%
Average Sales Price* $349,198 $433,783 + 24.2% $399,724 $425,992 + 6.6%
Percent of List Price Received* 98.8% 99.2% + 0.4% 99.0% 99.2% + 0.2%
Inventory of Homes for Sale 101 87 - 13.9% –– –– ––
Months Supply of Inventory 2.0 1.9 - 5.0% –– –– ––
Condo/Townhouse December Year to Date
Key Metrics 2016 2017 % Change Thru 12-2016 Thru 12-2017 % Change
New Listings 20 20 0.0% 458 533 + 16.4%
Pending Sales 22 19 - 13.6% 459 440 - 4.1%
Closed Sales 31 50 + 61.3% 448 447 - 0.2%
Days on Market Until Sale 79 39 - 50.6% 60 59 - 1.7%
Median Sales Price* $268,025 $227,795 - 15.0% $240,000 $260,000 + 8.3%
Average Sales Price* $291,851 $269,745 - 7.6% $261,915 $297,958 + 13.8%
Percent of List Price Received* 98.2% 99.4% + 1.2% 98.9% 99.6% + 0.7%
Inventory of Homes for Sale 52 88 + 69.2% –– –– ––
Months Supply of Inventory 1.4 2.4 + 71.4% –– –– ––
* Does not account for sale concessions and/or downpayment assistance. | Percent changes are calculated using rounded figures and can sometimes look extreme due to small sample size.
A rolling 12-month calculation represents the current month and the 11 months prior in a single data point. If no activity occurred during a month, the line extends to the next available data point.
Median Sales Price - Single Family
Rolling 12-Month Calculation Gallatin County
Bozeman City Limits
1-2003 1-2005 1-2007 1-2009 1-2011 1-2013 1-2015 1-2017
$150,000
$200,000
$250,000
$300,000
$350,000
$400,000
Median Sales Price - Condo
Rolling 12-Month Calculation Gallatin County
Bozeman City Limits
1-2003 1-2005 1-2007 1-2009 1-2011 1-2013 1-2015 1-2017
$100,000
$150,000
$200,000
$250,000
$300,000
Current as of January 10, 2018. All data from Big Sky Country Multiple Listing Service®. Report © 2018 ShowingTime.
Local Market Update – December 2017
This is a research tool provided by the Big Sky Country MLS
Belgrade
Single Family December Year to Date
Key Metrics 2016 2017 % Change Thru 12-2016 Thru 12-2017 % Change
New Listings 12 17 + 41.7% 358 405 + 13.1%
Pending Sales 20 16 - 20.0% 303 358 + 18.2%
Closed Sales 28 24 - 14.3% 299 358 + 19.7%
Days on Market Until Sale 61 24 - 60.7% 41 37 - 9.8%
Median Sales Price* $291,525 $288,300 - 1.1% $255,000 $287,250 + 12.6%
Average Sales Price* $292,145 $345,131 + 18.1% $284,281 $322,039 + 13.3%
Percent of List Price Received* 97.4% 98.7% + 1.3% 99.1% 99.0% - 0.1%
Inventory of Homes for Sale 50 49 - 2.0% –– –– ––
Months Supply of Inventory 2.0 1.6 - 20.0% –– –– ––
Condo/Townhouse December Year to Date
Key Metrics 2016 2017 % Change Thru 12-2016 Thru 12-2017 % Change
New Listings 2 2 0.0% 83 91 + 9.6%
Pending Sales 1 1 0.0% 87 84 - 3.4%
Closed Sales 5 6 + 20.0% 92 84 - 8.7%
Days on Market Until Sale 35 24 - 31.4% 45 26 - 42.2%
Median Sales Price* $159,000 $190,950 + 20.1% $167,750 $189,450 + 12.9%
Average Sales Price* $162,080 $202,050 + 24.7% $165,962 $187,290 + 12.9%
Percent of List Price Received* 99.5% 99.5% 0.0% 99.5% 99.5% 0.0%
Inventory of Homes for Sale 8 10 + 25.0% –– –– ––
Months Supply of Inventory 1.1 1.4 + 27.3% –– –– ––
* Does not account for sale concessions and/or downpayment assistance. | Percent changes are calculated using rounded figures and can sometimes look extreme due to small sample size.
A rolling 12-month calculation represents the current month and the 11 months prior in a single data point. If no activity occurred during a month, the line extends to the next available data point.
Median Sales Price - Single Family
Rolling 12-Month Calculation Gallatin County
Belgrade
1-2003 1-2005 1-2007 1-2009 1-2011 1-2013 1-2015 1-2017
$100,000
$150,000
$200,000
$250,000
$300,000
$350,000
$400,000
Median Sales Price - Condo
Rolling 12-Month Calculation Gallatin County
Belgrade
1-2003 1-2005 1-2007 1-2009 1-2011 1-2013 1-2015 1-2017
$50,000
$100,000
$150,000
$200,000
$250,000
$300,000
Current as of January 10, 2018. All data from Big Sky Country Multiple Listing Service®. Report © 2018 ShowingTime.
Local Market Update – December 2017
This is a research tool provided by the Big Sky Country MLS
Greater Big Sky
Single Family December Year to Date
Key Metrics 2016 2017 % Change Thru 12-2016 Thru 12-2017 % Change
New Listings 5 11 + 120.0% 108 118 + 9.3%
Pending Sales 7 2 - 71.4% 63 79 + 25.4%
Closed Sales 4 10 + 150.0% 63 80 + 27.0%
Days on Market Until Sale 158 215 + 36.1% 228 207 - 9.2%
Median Sales Price* $920,000 $1,437,500 + 56.3% $1,050,000 $1,160,000 + 10.5%
Average Sales Price* $885,000 $1,584,814 + 79.1% $1,486,482 $1,381,248 - 7.1%
Percent of List Price Received* 93.1% 94.2% + 1.2% 95.3% 94.6% - 0.7%
Inventory of Homes for Sale 81 72 - 11.1% –– –– ––
Months Supply of Inventory 14.1 10.9 - 22.7% –– –– ––
Condo/Townhouse December Year to Date
Key Metrics 2016 2017 % Change Thru 12-2016 Thru 12-2017 % Change
New Listings 7 31 + 342.9% 223 226 + 1.3%
Pending Sales 9 7 - 22.2% 171 174 + 1.8%
Closed Sales 13 10 - 23.1% 174 167 - 4.0%
Days on Market Until Sale 119 107 - 10.1% 171 136 - 20.5%
Median Sales Price* $525,000 $379,750 - 27.7% $335,000 $365,000 + 9.0%
Average Sales Price* $658,370 $487,130 - 26.0% $421,239 $450,943 + 7.1%
Percent of List Price Received* 98.1% 96.7% - 1.4% 95.8% 96.5% + 0.7%
Inventory of Homes for Sale 123 120 - 2.4% –– –– ––
Months Supply of Inventory 8.6 8.3 - 3.5% –– –– ––
* Does not account for sale concessions and/or downpayment assistance. | Percent changes are calculated using rounded figures and can sometimes look extreme due to small sample size.
A rolling 12-month calculation represents the current month and the 11 months prior in a single data point. If no activity occurred during a month, the line extends to the next available data point.
Median Sales Price - Single Family
Rolling 12-Month Calculation Gallatin County
Greater Big Sky
1-2003 1-2005 1-2007 1-2009 1-2011 1-2013 1-2015 1-2017
$0
$500,000
$1,000,000
$1,500,000
$2,000,000
Median Sales Price - Condo
Rolling 12-Month Calculation Gallatin County
Greater Big Sky
1-2003 1-2005 1-2007 1-2009 1-2011 1-2013 1-2015 1-2017
$0
$100,000
$200,000
$300,000
$400,000
$500,000
$600,000
Current as of January 10, 2018. All data from Big Sky Country Multiple Listing Service®. Report © 2018 ShowingTime.
Local Market Update – December 2017
This is a research tool provided by the Big Sky Country MLS
Livingston City Limits
Single Family December Year to Date
Key Metrics 2016 2017 % Change Thru 12-2016 Thru 12-2017 % Change
New Listings 4 5 + 25.0% 176 169 - 4.0%
Pending Sales 4 5 + 25.0% 129 157 + 21.7%
Closed Sales 9 8 - 11.1% 136 153 + 12.5%
Days on Market Until Sale 51 24 - 52.9% 62 50 - 19.4%
Median Sales Price* $223,000 $274,500 + 23.1% $199,950 $230,000 + 15.0%
Average Sales Price* $204,944 $270,648 + 32.1% $206,064 $235,252 + 14.2%
Percent of List Price Received* 95.4% 96.5% + 1.2% 96.3% 97.2% + 0.9%
Inventory of Homes for Sale 45 27 - 40.0% –– –– ––
Months Supply of Inventory 4.2 2.1 - 50.0% –– –– ––
Condo/Townhouse December Year to Date
Key Metrics 2016 2017 % Change Thru 12-2016 Thru 12-2017 % Change
New Listings 0 0 –– 19 31 + 63.2%
Pending Sales 0 0 –– 10 25 + 150.0%
Closed Sales 1 3 + 200.0% 12 22 + 83.3%
Days on Market Until Sale 13 44 + 238.5% 26 26 0.0%
Median Sales Price* $115,000 $219,000 + 90.4% $163,250 $176,000 + 7.8%
Average Sales Price* $115,000 $219,333 + 90.7% $154,463 $197,112 + 27.6%
Percent of List Price Received* 96.6% 96.9% + 0.3% 97.9% 97.0% - 0.9%
Inventory of Homes for Sale 7 6 - 14.3% –– –– ––
Months Supply of Inventory 4.2 1.9 - 54.8% –– –– ––
* Does not account for sale concessions and/or downpayment assistance. | Percent changes are calculated using rounded figures and can sometimes look extreme due to small sample size.
A rolling 12-month calculation represents the current month and the 11 months prior in a single data point. If no activity occurred during a month, the line extends to the next available data point.
Median Sales Price - Single Family
Rolling 12-Month Calculation Gallatin County
Livingston City Limits
1-2003 1-2005 1-2007 1-2009 1-2011 1-2013 1-2015 1-2017
$50,000
$100,000
$150,000
$200,000
$250,000
$300,000
$350,000
$400,000
Median Sales Price - Condo
Rolling 12-Month Calculation Gallatin County
Livingston City Limits
1-2003 1-2005 1-2007 1-2009 1-2011 1-2013 1-2015 1-2017
$50,000
$100,000
$150,000
$200,000
$250,000
$300,000
Current as of January 10, 2018. All data from Big Sky Country Multiple Listing Service®. Report © 2018 ShowingTime.

Mais conteúdo relacionado

Mais procurados

July 2018 Gallatin Valley Market Reports
July 2018 Gallatin Valley Market ReportsJuly 2018 Gallatin Valley Market Reports
July 2018 Gallatin Valley Market ReportsReferred Realty Group
 
August 2018 Bozeman Home Sales Market Data
August 2018 Bozeman Home Sales Market DataAugust 2018 Bozeman Home Sales Market Data
August 2018 Bozeman Home Sales Market DataReferred Realty Group
 
San Francisco Market Focus Report October 2018
San Francisco Market Focus Report October 2018San Francisco Market Focus Report October 2018
San Francisco Market Focus Report October 2018Ronny Budiutama
 
May 2019 Gallatin Valley Market Reports
May 2019 Gallatin Valley Market ReportsMay 2019 Gallatin Valley Market Reports
May 2019 Gallatin Valley Market ReportsReferred Realty Group
 
San Francisco Market Focus April 2018
San Francisco Market Focus April 2018San Francisco Market Focus April 2018
San Francisco Market Focus April 2018Ronny Budiutama
 
San Francisco Market Focus Report May
San Francisco Market Focus Report MaySan Francisco Market Focus Report May
San Francisco Market Focus Report MayRonny Budiutama
 
Bozeman and Surrounding Communities June 2019 Market Report
Bozeman and Surrounding Communities June 2019 Market ReportBozeman and Surrounding Communities June 2019 Market Report
Bozeman and Surrounding Communities June 2019 Market ReportReferred Realty Group
 
Jan 2019 Gallatin Valley Market Reports
Jan 2019 Gallatin Valley Market ReportsJan 2019 Gallatin Valley Market Reports
Jan 2019 Gallatin Valley Market ReportsReferred Realty Group
 
Georgia Housing Market Snapshot For October 2018
Georgia Housing Market Snapshot For October 2018Georgia Housing Market Snapshot For October 2018
Georgia Housing Market Snapshot For October 2018Arthur Prescott
 
Georgia Housing Market Snapshot For September 2018
Georgia Housing Market Snapshot For September 2018Georgia Housing Market Snapshot For September 2018
Georgia Housing Market Snapshot For September 2018Arthur Prescott
 
#HomeSalesShow Oct 2017 market reports
#HomeSalesShow Oct 2017 market reports#HomeSalesShow Oct 2017 market reports
#HomeSalesShow Oct 2017 market reportsReferred Realty Group
 
August 2019 Market Reports for Bozeman
August 2019 Market Reports for BozemanAugust 2019 Market Reports for Bozeman
August 2019 Market Reports for BozemanReferred Realty Group
 
San Francisco Market Focus Report November 2018
San Francisco Market Focus Report November 2018San Francisco Market Focus Report November 2018
San Francisco Market Focus Report November 2018Ronny Budiutama
 
Feb 2019 Market Reports for the Bozeman Area
Feb 2019 Market Reports for the Bozeman AreaFeb 2019 Market Reports for the Bozeman Area
Feb 2019 Market Reports for the Bozeman AreaReferred Realty Group
 
Massachusetts statewide closed sales for condos and single family homes
Massachusetts statewide closed sales for condos and single family homesMassachusetts statewide closed sales for condos and single family homes
Massachusetts statewide closed sales for condos and single family homesMichael Mahoney
 
San Francisco Market Focus June 2017
San Francisco Market Focus June 2017San Francisco Market Focus June 2017
San Francisco Market Focus June 2017Ronny Budiutama
 
San Francisco Market Focus May 2017
San Francisco Market Focus May 2017San Francisco Market Focus May 2017
San Francisco Market Focus May 2017Ronny Budiutama
 

Mais procurados (20)

July 2018 Gallatin Valley Market Reports
July 2018 Gallatin Valley Market ReportsJuly 2018 Gallatin Valley Market Reports
July 2018 Gallatin Valley Market Reports
 
August 2018 Bozeman Home Sales Market Data
August 2018 Bozeman Home Sales Market DataAugust 2018 Bozeman Home Sales Market Data
August 2018 Bozeman Home Sales Market Data
 
San Francisco Market Focus Report October 2018
San Francisco Market Focus Report October 2018San Francisco Market Focus Report October 2018
San Francisco Market Focus Report October 2018
 
May 2019 Gallatin Valley Market Reports
May 2019 Gallatin Valley Market ReportsMay 2019 Gallatin Valley Market Reports
May 2019 Gallatin Valley Market Reports
 
San Francisco Market Focus April 2018
San Francisco Market Focus April 2018San Francisco Market Focus April 2018
San Francisco Market Focus April 2018
 
San Francisco Market Focus Report May
San Francisco Market Focus Report MaySan Francisco Market Focus Report May
San Francisco Market Focus Report May
 
Bozeman and Surrounding Communities June 2019 Market Report
Bozeman and Surrounding Communities June 2019 Market ReportBozeman and Surrounding Communities June 2019 Market Report
Bozeman and Surrounding Communities June 2019 Market Report
 
Jan 2019 Gallatin Valley Market Reports
Jan 2019 Gallatin Valley Market ReportsJan 2019 Gallatin Valley Market Reports
Jan 2019 Gallatin Valley Market Reports
 
Georgia Housing Market Snapshot For October 2018
Georgia Housing Market Snapshot For October 2018Georgia Housing Market Snapshot For October 2018
Georgia Housing Market Snapshot For October 2018
 
March 2019 Market Report
March 2019 Market ReportMarch 2019 Market Report
March 2019 Market Report
 
Georgia Housing Market Snapshot For September 2018
Georgia Housing Market Snapshot For September 2018Georgia Housing Market Snapshot For September 2018
Georgia Housing Market Snapshot For September 2018
 
March 2020 Market Data
March 2020 Market DataMarch 2020 Market Data
March 2020 Market Data
 
#HomeSalesShow Oct 2017 market reports
#HomeSalesShow Oct 2017 market reports#HomeSalesShow Oct 2017 market reports
#HomeSalesShow Oct 2017 market reports
 
August 2019 Market Reports for Bozeman
August 2019 Market Reports for BozemanAugust 2019 Market Reports for Bozeman
August 2019 Market Reports for Bozeman
 
San Francisco Market Focus Report November 2018
San Francisco Market Focus Report November 2018San Francisco Market Focus Report November 2018
San Francisco Market Focus Report November 2018
 
Feb 2019 Market Reports for the Bozeman Area
Feb 2019 Market Reports for the Bozeman AreaFeb 2019 Market Reports for the Bozeman Area
Feb 2019 Market Reports for the Bozeman Area
 
Massachusetts statewide closed sales for condos and single family homes
Massachusetts statewide closed sales for condos and single family homesMassachusetts statewide closed sales for condos and single family homes
Massachusetts statewide closed sales for condos and single family homes
 
September 2019 Market Reports
September 2019 Market ReportsSeptember 2019 Market Reports
September 2019 Market Reports
 
San Francisco Market Focus June 2017
San Francisco Market Focus June 2017San Francisco Market Focus June 2017
San Francisco Market Focus June 2017
 
San Francisco Market Focus May 2017
San Francisco Market Focus May 2017San Francisco Market Focus May 2017
San Francisco Market Focus May 2017
 

Semelhante a Jan 2018 Gallatin Valley market reports

April 2019 Market Reports for the Gallatin Valley
April 2019 Market Reports for the Gallatin ValleyApril 2019 Market Reports for the Gallatin Valley
April 2019 Market Reports for the Gallatin ValleyReferred Realty Group
 
July 2019 Gallatin Valley Market Reports
July 2019 Gallatin Valley Market ReportsJuly 2019 Gallatin Valley Market Reports
July 2019 Gallatin Valley Market ReportsReferred Realty Group
 
January 2022 Bozeman real estate stats
January 2022 Bozeman real estate statsJanuary 2022 Bozeman real estate stats
January 2022 Bozeman real estate statsReferred Realty Group
 
Georgia Housing Market Snapshot For November 2018
Georgia Housing Market Snapshot For November 2018Georgia Housing Market Snapshot For November 2018
Georgia Housing Market Snapshot For November 2018Arthur Prescott
 
Greater Baton Rouge Home Sales December 2017 Update provided by GBRAR.
Greater Baton Rouge Home Sales December 2017 Update provided by GBRAR. Greater Baton Rouge Home Sales December 2017 Update provided by GBRAR.
Greater Baton Rouge Home Sales December 2017 Update provided by GBRAR. Bill Cobb, Appraiser
 
San Francisco Market Report October 2022.pdf
San Francisco Market Report October 2022.pdfSan Francisco Market Report October 2022.pdf
San Francisco Market Report October 2022.pdfRonny Budiutama
 
2014 Chicago Real Estate Review - Market Insight and Predictions - Amanda McM...
2014 Chicago Real Estate Review - Market Insight and Predictions - Amanda McM...2014 Chicago Real Estate Review - Market Insight and Predictions - Amanda McM...
2014 Chicago Real Estate Review - Market Insight and Predictions - Amanda McM...Amanda McMillan
 
San Francisco Market Data October 2020
San Francisco Market Data October 2020San Francisco Market Data October 2020
San Francisco Market Data October 2020Ronny Budiutama
 
San Francisco Market Report March 2022
San Francisco Market Report March 2022San Francisco Market Report March 2022
San Francisco Market Report March 2022Ronny Budiutama
 
San Francisco Market Focus Report July
San Francisco Market Focus Report JulySan Francisco Market Focus Report July
San Francisco Market Focus Report JulyRonny Budiutama
 
San Francisco Market Focus Report Nov 2020
San Francisco Market Focus Report Nov 2020San Francisco Market Focus Report Nov 2020
San Francisco Market Focus Report Nov 2020Ronny Budiutama
 
San Francisco Market Focus April 2017
San Francisco Market Focus April 2017San Francisco Market Focus April 2017
San Francisco Market Focus April 2017Ronny Budiutama
 

Semelhante a Jan 2018 Gallatin Valley market reports (13)

April 2019 Market Reports for the Gallatin Valley
April 2019 Market Reports for the Gallatin ValleyApril 2019 Market Reports for the Gallatin Valley
April 2019 Market Reports for the Gallatin Valley
 
July 2019 Gallatin Valley Market Reports
July 2019 Gallatin Valley Market ReportsJuly 2019 Gallatin Valley Market Reports
July 2019 Gallatin Valley Market Reports
 
Oct 2019 Market Reports
Oct 2019 Market ReportsOct 2019 Market Reports
Oct 2019 Market Reports
 
January 2022 Bozeman real estate stats
January 2022 Bozeman real estate statsJanuary 2022 Bozeman real estate stats
January 2022 Bozeman real estate stats
 
Georgia Housing Market Snapshot For November 2018
Georgia Housing Market Snapshot For November 2018Georgia Housing Market Snapshot For November 2018
Georgia Housing Market Snapshot For November 2018
 
Greater Baton Rouge Home Sales December 2017 Update provided by GBRAR.
Greater Baton Rouge Home Sales December 2017 Update provided by GBRAR. Greater Baton Rouge Home Sales December 2017 Update provided by GBRAR.
Greater Baton Rouge Home Sales December 2017 Update provided by GBRAR.
 
San Francisco Market Report October 2022.pdf
San Francisco Market Report October 2022.pdfSan Francisco Market Report October 2022.pdf
San Francisco Market Report October 2022.pdf
 
2014 Chicago Real Estate Review - Market Insight and Predictions - Amanda McM...
2014 Chicago Real Estate Review - Market Insight and Predictions - Amanda McM...2014 Chicago Real Estate Review - Market Insight and Predictions - Amanda McM...
2014 Chicago Real Estate Review - Market Insight and Predictions - Amanda McM...
 
San Francisco Market Data October 2020
San Francisco Market Data October 2020San Francisco Market Data October 2020
San Francisco Market Data October 2020
 
San Francisco Market Report March 2022
San Francisco Market Report March 2022San Francisco Market Report March 2022
San Francisco Market Report March 2022
 
San Francisco Market Focus Report July
San Francisco Market Focus Report JulySan Francisco Market Focus Report July
San Francisco Market Focus Report July
 
San Francisco Market Focus Report Nov 2020
San Francisco Market Focus Report Nov 2020San Francisco Market Focus Report Nov 2020
San Francisco Market Focus Report Nov 2020
 
San Francisco Market Focus April 2017
San Francisco Market Focus April 2017San Francisco Market Focus April 2017
San Francisco Market Focus April 2017
 

Mais de Referred Realty Group

Bozeman March 2022 Real Estate Market Report
Bozeman March 2022 Real Estate Market ReportBozeman March 2022 Real Estate Market Report
Bozeman March 2022 Real Estate Market ReportReferred Realty Group
 
Feb 2022 Market Report for Bozeman, MT
Feb 2022 Market Report for Bozeman, MTFeb 2022 Market Report for Bozeman, MT
Feb 2022 Market Report for Bozeman, MTReferred Realty Group
 
December and Year End 2018 Sales Data
December and Year End 2018 Sales DataDecember and Year End 2018 Sales Data
December and Year End 2018 Sales DataReferred Realty Group
 
November 2018 Real Estate Update, The Woodlands, TX
November 2018 Real Estate Update, The Woodlands, TXNovember 2018 Real Estate Update, The Woodlands, TX
November 2018 Real Estate Update, The Woodlands, TXReferred Realty Group
 
October 2018 Real Estate Update for The Woodlands, Texas
October 2018 Real Estate Update for The Woodlands, TexasOctober 2018 Real Estate Update for The Woodlands, Texas
October 2018 Real Estate Update for The Woodlands, TexasReferred Realty Group
 
September 2018 Real Estate Update, The Woodlands, Texas
September 2018 Real Estate Update, The Woodlands, TexasSeptember 2018 Real Estate Update, The Woodlands, Texas
September 2018 Real Estate Update, The Woodlands, TexasReferred Realty Group
 
August 2018 Real Estate Update for The Woodlands, Texas
August 2018 Real Estate Update for The Woodlands, TexasAugust 2018 Real Estate Update for The Woodlands, Texas
August 2018 Real Estate Update for The Woodlands, TexasReferred Realty Group
 
July 2018 Real Estate Update for The Woodlands, Texas
July 2018 Real Estate Update for The Woodlands, TexasJuly 2018 Real Estate Update for The Woodlands, Texas
July 2018 Real Estate Update for The Woodlands, TexasReferred Realty Group
 
May 2018 Real Estate Update for The Woodlands, Texas
May 2018 Real Estate Update for The Woodlands, TexasMay 2018 Real Estate Update for The Woodlands, Texas
May 2018 Real Estate Update for The Woodlands, TexasReferred Realty Group
 

Mais de Referred Realty Group (11)

Apr 22 Market Reports
Apr 22 Market ReportsApr 22 Market Reports
Apr 22 Market Reports
 
Bozeman March 2022 Real Estate Market Report
Bozeman March 2022 Real Estate Market ReportBozeman March 2022 Real Estate Market Report
Bozeman March 2022 Real Estate Market Report
 
Feb 2022 Market Report for Bozeman, MT
Feb 2022 Market Report for Bozeman, MTFeb 2022 Market Report for Bozeman, MT
Feb 2022 Market Report for Bozeman, MT
 
December and Year End 2018 Sales Data
December and Year End 2018 Sales DataDecember and Year End 2018 Sales Data
December and Year End 2018 Sales Data
 
November 2018 Real Estate Update, The Woodlands, TX
November 2018 Real Estate Update, The Woodlands, TXNovember 2018 Real Estate Update, The Woodlands, TX
November 2018 Real Estate Update, The Woodlands, TX
 
October 2018 Real Estate Update for The Woodlands, Texas
October 2018 Real Estate Update for The Woodlands, TexasOctober 2018 Real Estate Update for The Woodlands, Texas
October 2018 Real Estate Update for The Woodlands, Texas
 
September 2018 Real Estate Update, The Woodlands, Texas
September 2018 Real Estate Update, The Woodlands, TexasSeptember 2018 Real Estate Update, The Woodlands, Texas
September 2018 Real Estate Update, The Woodlands, Texas
 
August 2018 Real Estate Update for The Woodlands, Texas
August 2018 Real Estate Update for The Woodlands, TexasAugust 2018 Real Estate Update for The Woodlands, Texas
August 2018 Real Estate Update for The Woodlands, Texas
 
July 2018 Real Estate Update for The Woodlands, Texas
July 2018 Real Estate Update for The Woodlands, TexasJuly 2018 Real Estate Update for The Woodlands, Texas
July 2018 Real Estate Update for The Woodlands, Texas
 
May 2018 Real Estate Update for The Woodlands, Texas
May 2018 Real Estate Update for The Woodlands, TexasMay 2018 Real Estate Update for The Woodlands, Texas
May 2018 Real Estate Update for The Woodlands, Texas
 
April 2018 Real Estate Update
April 2018 Real Estate UpdateApril 2018 Real Estate Update
April 2018 Real Estate Update
 

Último

Low Rate ↬Call Girls in Trilokpuri Delhi ↫8447779280}Escorts Service In Delhi
Low Rate ↬Call Girls in Trilokpuri Delhi ↫8447779280}Escorts Service In DelhiLow Rate ↬Call Girls in Trilokpuri Delhi ↫8447779280}Escorts Service In Delhi
Low Rate ↬Call Girls in Trilokpuri Delhi ↫8447779280}Escorts Service In Delhiasmaqueen5
 
Call Girls In Mayur Vihar Delhi ☆↫8447779280 ❤Escorts Service In Delhi
Call Girls In Mayur Vihar Delhi ☆↫8447779280 ❤Escorts Service In DelhiCall Girls In Mayur Vihar Delhi ☆↫8447779280 ❤Escorts Service In Delhi
Call Girls In Mayur Vihar Delhi ☆↫8447779280 ❤Escorts Service In Delhiasmaqueen5
 
9990771857 Call Girls in Dwarka Sector 7 Delhi (Call Girls) Delhi
9990771857 Call Girls in Dwarka Sector 7 Delhi (Call Girls) Delhi9990771857 Call Girls in Dwarka Sector 7 Delhi (Call Girls) Delhi
9990771857 Call Girls in Dwarka Sector 7 Delhi (Call Girls) Delhidelhimodel235
 
2k Shot Call girls Aiims Delhi 9205541914
2k Shot Call girls Aiims Delhi 92055419142k Shot Call girls Aiims Delhi 9205541914
2k Shot Call girls Aiims Delhi 9205541914Delhi Call girls
 
BDSM⚡Call Girls in Sector 57 Noida Escorts >༒8448380779 Escort Service
BDSM⚡Call Girls in Sector 57 Noida Escorts >༒8448380779 Escort ServiceBDSM⚡Call Girls in Sector 57 Noida Escorts >༒8448380779 Escort Service
BDSM⚡Call Girls in Sector 57 Noida Escorts >༒8448380779 Escort ServiceDelhi Call girls
 
3D Architectural Rendering Company by Panoram CGI
3D Architectural Rendering Company by Panoram CGI3D Architectural Rendering Company by Panoram CGI
3D Architectural Rendering Company by Panoram CGIPanoram CGI
 
9990771857 Call Girls in Dwarka Sector 6 Delhi (Call Girls) Delhi
9990771857 Call Girls in Dwarka Sector 6 Delhi (Call Girls) Delhi9990771857 Call Girls in Dwarka Sector 6 Delhi (Call Girls) Delhi
9990771857 Call Girls in Dwarka Sector 6 Delhi (Call Girls) Delhidelhimodel235
 
Kolte Patil Kharadi Pune E Brochure.pdf
Kolte Patil Kharadi Pune E  Brochure.pdfKolte Patil Kharadi Pune E  Brochure.pdf
Kolte Patil Kharadi Pune E Brochure.pdfabbu831446
 
9990771857 Call Girls in Dwarka Sector 2 Delhi (Call Girls) Delhi
9990771857 Call Girls in Dwarka Sector 2 Delhi (Call Girls) Delhi9990771857 Call Girls in Dwarka Sector 2 Delhi (Call Girls) Delhi
9990771857 Call Girls in Dwarka Sector 2 Delhi (Call Girls) Delhidelhimodel235
 
9990771857 Call Girls in Dwarka Sector 3 Delhi (Call Girls) Delhi
9990771857 Call Girls in Dwarka Sector 3 Delhi (Call Girls) Delhi9990771857 Call Girls in Dwarka Sector 3 Delhi (Call Girls) Delhi
9990771857 Call Girls in Dwarka Sector 3 Delhi (Call Girls) Delhidelhimodel235
 
call girls in ganesh nagar Delhi 8264348440 ✅ call girls ❤️
call girls in ganesh nagar Delhi 8264348440 ✅ call girls ❤️call girls in ganesh nagar Delhi 8264348440 ✅ call girls ❤️
call girls in ganesh nagar Delhi 8264348440 ✅ call girls ❤️soniya singh
 
Greater Vancouver Realtors Statistics Package April 2024
Greater Vancouver Realtors Statistics Package April 2024Greater Vancouver Realtors Statistics Package April 2024
Greater Vancouver Realtors Statistics Package April 2024VickyAulakh1
 
Properties for Sale in Istanbul with Schools and Parks | Antalya Development
Properties for Sale in Istanbul with Schools and Parks | Antalya DevelopmentProperties for Sale in Istanbul with Schools and Parks | Antalya Development
Properties for Sale in Istanbul with Schools and Parks | Antalya DevelopmentAntalya Development
 
Girls in Kalyanpuri }Delhi↫8447779280↬Escort Service. In Delhi NCR
Girls in Kalyanpuri }Delhi↫8447779280↬Escort Service. In Delhi NCRGirls in Kalyanpuri }Delhi↫8447779280↬Escort Service. In Delhi NCR
Girls in Kalyanpuri }Delhi↫8447779280↬Escort Service. In Delhi NCRasmaqueen5
 
M3M 129 E Brochure Noida Expressway, Sector 129, Noida
M3M 129 E Brochure Noida Expressway, Sector 129, NoidaM3M 129 E Brochure Noida Expressway, Sector 129, Noida
M3M 129 E Brochure Noida Expressway, Sector 129, Noidasarak0han45400
 
M3M The Line Brochure - Premium Investment Opportunity for Commercial Ventures
M3M The Line Brochure - Premium Investment Opportunity for Commercial VenturesM3M The Line Brochure - Premium Investment Opportunity for Commercial Ventures
M3M The Line Brochure - Premium Investment Opportunity for Commercial Venturessheltercareglobal
 
Call Girls In Laxmi Nagar Delhi +91-8447779280! !Best Woman Seeking Man Escor...
Call Girls In Laxmi Nagar Delhi +91-8447779280! !Best Woman Seeking Man Escor...Call Girls In Laxmi Nagar Delhi +91-8447779280! !Best Woman Seeking Man Escor...
Call Girls In Laxmi Nagar Delhi +91-8447779280! !Best Woman Seeking Man Escor...asmaqueen5
 
Magarpatta Nova Elegance Mundhwa Pune E-Brochure.pdf
Magarpatta Nova Elegance Mundhwa Pune  E-Brochure.pdfMagarpatta Nova Elegance Mundhwa Pune  E-Brochure.pdf
Magarpatta Nova Elegance Mundhwa Pune E-Brochure.pdfManishSaxena95
 
9990771857 Call Girls in Dwarka Sector 1 Delhi (Call Girls) Delhi
9990771857 Call Girls in Dwarka Sector 1 Delhi (Call Girls) Delhi9990771857 Call Girls in Dwarka Sector 1 Delhi (Call Girls) Delhi
9990771857 Call Girls in Dwarka Sector 1 Delhi (Call Girls) Delhidelhimodel235
 
Premium Villa Projects in Sarjapur Road Bengaluru
Premium Villa Projects in Sarjapur Road BengaluruPremium Villa Projects in Sarjapur Road Bengaluru
Premium Villa Projects in Sarjapur Road BengaluruShivaSeo3
 

Último (20)

Low Rate ↬Call Girls in Trilokpuri Delhi ↫8447779280}Escorts Service In Delhi
Low Rate ↬Call Girls in Trilokpuri Delhi ↫8447779280}Escorts Service In DelhiLow Rate ↬Call Girls in Trilokpuri Delhi ↫8447779280}Escorts Service In Delhi
Low Rate ↬Call Girls in Trilokpuri Delhi ↫8447779280}Escorts Service In Delhi
 
Call Girls In Mayur Vihar Delhi ☆↫8447779280 ❤Escorts Service In Delhi
Call Girls In Mayur Vihar Delhi ☆↫8447779280 ❤Escorts Service In DelhiCall Girls In Mayur Vihar Delhi ☆↫8447779280 ❤Escorts Service In Delhi
Call Girls In Mayur Vihar Delhi ☆↫8447779280 ❤Escorts Service In Delhi
 
9990771857 Call Girls in Dwarka Sector 7 Delhi (Call Girls) Delhi
9990771857 Call Girls in Dwarka Sector 7 Delhi (Call Girls) Delhi9990771857 Call Girls in Dwarka Sector 7 Delhi (Call Girls) Delhi
9990771857 Call Girls in Dwarka Sector 7 Delhi (Call Girls) Delhi
 
2k Shot Call girls Aiims Delhi 9205541914
2k Shot Call girls Aiims Delhi 92055419142k Shot Call girls Aiims Delhi 9205541914
2k Shot Call girls Aiims Delhi 9205541914
 
BDSM⚡Call Girls in Sector 57 Noida Escorts >༒8448380779 Escort Service
BDSM⚡Call Girls in Sector 57 Noida Escorts >༒8448380779 Escort ServiceBDSM⚡Call Girls in Sector 57 Noida Escorts >༒8448380779 Escort Service
BDSM⚡Call Girls in Sector 57 Noida Escorts >༒8448380779 Escort Service
 
3D Architectural Rendering Company by Panoram CGI
3D Architectural Rendering Company by Panoram CGI3D Architectural Rendering Company by Panoram CGI
3D Architectural Rendering Company by Panoram CGI
 
9990771857 Call Girls in Dwarka Sector 6 Delhi (Call Girls) Delhi
9990771857 Call Girls in Dwarka Sector 6 Delhi (Call Girls) Delhi9990771857 Call Girls in Dwarka Sector 6 Delhi (Call Girls) Delhi
9990771857 Call Girls in Dwarka Sector 6 Delhi (Call Girls) Delhi
 
Kolte Patil Kharadi Pune E Brochure.pdf
Kolte Patil Kharadi Pune E  Brochure.pdfKolte Patil Kharadi Pune E  Brochure.pdf
Kolte Patil Kharadi Pune E Brochure.pdf
 
9990771857 Call Girls in Dwarka Sector 2 Delhi (Call Girls) Delhi
9990771857 Call Girls in Dwarka Sector 2 Delhi (Call Girls) Delhi9990771857 Call Girls in Dwarka Sector 2 Delhi (Call Girls) Delhi
9990771857 Call Girls in Dwarka Sector 2 Delhi (Call Girls) Delhi
 
9990771857 Call Girls in Dwarka Sector 3 Delhi (Call Girls) Delhi
9990771857 Call Girls in Dwarka Sector 3 Delhi (Call Girls) Delhi9990771857 Call Girls in Dwarka Sector 3 Delhi (Call Girls) Delhi
9990771857 Call Girls in Dwarka Sector 3 Delhi (Call Girls) Delhi
 
call girls in ganesh nagar Delhi 8264348440 ✅ call girls ❤️
call girls in ganesh nagar Delhi 8264348440 ✅ call girls ❤️call girls in ganesh nagar Delhi 8264348440 ✅ call girls ❤️
call girls in ganesh nagar Delhi 8264348440 ✅ call girls ❤️
 
Greater Vancouver Realtors Statistics Package April 2024
Greater Vancouver Realtors Statistics Package April 2024Greater Vancouver Realtors Statistics Package April 2024
Greater Vancouver Realtors Statistics Package April 2024
 
Properties for Sale in Istanbul with Schools and Parks | Antalya Development
Properties for Sale in Istanbul with Schools and Parks | Antalya DevelopmentProperties for Sale in Istanbul with Schools and Parks | Antalya Development
Properties for Sale in Istanbul with Schools and Parks | Antalya Development
 
Girls in Kalyanpuri }Delhi↫8447779280↬Escort Service. In Delhi NCR
Girls in Kalyanpuri }Delhi↫8447779280↬Escort Service. In Delhi NCRGirls in Kalyanpuri }Delhi↫8447779280↬Escort Service. In Delhi NCR
Girls in Kalyanpuri }Delhi↫8447779280↬Escort Service. In Delhi NCR
 
M3M 129 E Brochure Noida Expressway, Sector 129, Noida
M3M 129 E Brochure Noida Expressway, Sector 129, NoidaM3M 129 E Brochure Noida Expressway, Sector 129, Noida
M3M 129 E Brochure Noida Expressway, Sector 129, Noida
 
M3M The Line Brochure - Premium Investment Opportunity for Commercial Ventures
M3M The Line Brochure - Premium Investment Opportunity for Commercial VenturesM3M The Line Brochure - Premium Investment Opportunity for Commercial Ventures
M3M The Line Brochure - Premium Investment Opportunity for Commercial Ventures
 
Call Girls In Laxmi Nagar Delhi +91-8447779280! !Best Woman Seeking Man Escor...
Call Girls In Laxmi Nagar Delhi +91-8447779280! !Best Woman Seeking Man Escor...Call Girls In Laxmi Nagar Delhi +91-8447779280! !Best Woman Seeking Man Escor...
Call Girls In Laxmi Nagar Delhi +91-8447779280! !Best Woman Seeking Man Escor...
 
Magarpatta Nova Elegance Mundhwa Pune E-Brochure.pdf
Magarpatta Nova Elegance Mundhwa Pune  E-Brochure.pdfMagarpatta Nova Elegance Mundhwa Pune  E-Brochure.pdf
Magarpatta Nova Elegance Mundhwa Pune E-Brochure.pdf
 
9990771857 Call Girls in Dwarka Sector 1 Delhi (Call Girls) Delhi
9990771857 Call Girls in Dwarka Sector 1 Delhi (Call Girls) Delhi9990771857 Call Girls in Dwarka Sector 1 Delhi (Call Girls) Delhi
9990771857 Call Girls in Dwarka Sector 1 Delhi (Call Girls) Delhi
 
Premium Villa Projects in Sarjapur Road Bengaluru
Premium Villa Projects in Sarjapur Road BengaluruPremium Villa Projects in Sarjapur Road Bengaluru
Premium Villa Projects in Sarjapur Road Bengaluru
 

Jan 2018 Gallatin Valley market reports

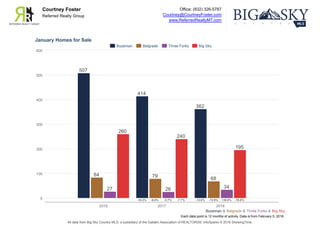
  • 1. Office: (832) 326-5787 Courtney@CourtneyFoster.com www.ReferredRealtyMT.com Courtney Foster Referred Realty Group Each data point is 12 months of activity. Data is from February 5, 2018. All data from Big Sky Country MLS, a subsidiary of the Gallatin Association of REALTORS®. InfoSparks © 2018 ShowingTime. January Homes for Sale Bozeman & Belgrade & Three Forks & Big Sky 0 100 200 300 400 500 600 2016 2017 2018 507 414 362 -18.3% -12.6% 84 79 68 -6.0% -13.9% 27 26 34 -3.7% +30.8% 260 240 195 -7.7% -18.8% Bozeman Belgrade Three Forks Big Sky
  • 2. Office: (832) 326-5787 Courtney@CourtneyFoster.com www.ReferredRealtyMT.com Courtney Foster Referred Realty Group Each data point is one month of activity. Data is from February 5, 2018. All data from Big Sky Country MLS, a subsidiary of the Gallatin Association of REALTORS®. InfoSparks © 2018 ShowingTime. January New Listings Bozeman & Belgrade & Three Forks & Big Sky 0 25 50 75 100 125 150 175 2016 2017 2018 115 137 106 +19.1% -22.6% 24 33 33 +37.5% 0.0% 3 3 5 0.0% +66.7% 41 15 27 -63.4% +80.0% Bozeman Belgrade Three Forks Big Sky
  • 3. Office: (832) 326-5787 Courtney@CourtneyFoster.com www.ReferredRealtyMT.com Courtney Foster Referred Realty Group Each data point is one month of activity. Data is from February 5, 2018. All data from Big Sky Country MLS, a subsidiary of the Gallatin Association of REALTORS®. InfoSparks © 2018 ShowingTime. January Pending Sales Bozeman & Belgrade & Three Forks & Big Sky 0 20 40 60 80 100 120 140 2016 2017 2018 85 113 118 +32.9% +4.4% 23 37 30 +60.9% -18.9% 2 3 6 +50.0% +100.0% 24 28 25 +16.7% -10.7% Bozeman Belgrade Three Forks Big Sky
  • 4. Office: (832) 326-5787 Courtney@CourtneyFoster.com www.ReferredRealtyMT.com Courtney Foster Referred Realty Group Each data point is one month of activity. Data is from February 5, 2018. All data from Big Sky Country MLS, a subsidiary of the Gallatin Association of REALTORS®. InfoSparks © 2018 ShowingTime. January Closed Sales Bozeman & Belgrade & Three Forks & Big Sky 0 20 40 60 80 100 120 2016 2017 2018 83 99 80 +19.3% -19.2% 23 26 16 +13.0% -38.5% 0 1 6 –– +500.0% 8 10 13 +25.0% +30.0% Bozeman Belgrade Three Forks Big Sky
  • 5. Office: (832) 326-5787 Courtney@CourtneyFoster.com www.ReferredRealtyMT.com Courtney Foster Referred Realty Group Each data point is one month of activity. Data is from February 5, 2018. All data from Big Sky Country MLS, a subsidiary of the Gallatin Association of REALTORS®. InfoSparks © 2018 ShowingTime. January Average Sales Price Bozeman & Belgrade & Three Forks & Big Sky $0 $0.2M $0.4M $0.6M $0.8M $1.0M $1.2M $1.4M 2016 2017 2018 $341,212 $491,826 $448,990 +44.1% -8.7% $320,907 $320,959 $272,555 0.0% -15.1% $30,000 $209,900 –– +599.7% $1,201,609 $623,325 $443,254 -48.1% -28.9% Bozeman Belgrade Three Forks Big Sky
  • 6. Office: (832) 326-5787 Courtney@CourtneyFoster.com www.ReferredRealtyMT.com Courtney Foster Referred Realty Group Each data point is one month of activity. Data is from February 5, 2018. All data from Big Sky Country MLS, a subsidiary of the Gallatin Association of REALTORS®. InfoSparks © 2018 ShowingTime. January Months Supply of Homes for Sale Bozeman & Belgrade & Three Forks & Big Sky 0.0 5.0 2.5 7.5 10.0 12.5 15.0 2016 2017 2018 3.6 2.2 2.1 -38.9% -4.5% 2.3 1.5 1.7 -34.8% +13.3% 5.4 4.2 3.0 -22.2% -28.6% 13.6 9.7 8.9 -28.7% -8.2% Bozeman Belgrade Three Forks Big Sky
  • 7. Office: (832) 326-5787 Courtney@CourtneyFoster.com www.ReferredRealtyMT.com Courtney Foster Referred Realty Group Each data point is one month of activity. Data is from February 5, 2018. All data from Big Sky Country MLS, a subsidiary of the Gallatin Association of REALTORS®. InfoSparks © 2018 ShowingTime. January Median Days on Market Bozeman & Belgrade & Three Forks & Big Sky 0 100 200 300 400 500 600 2016 2017 2018 66 52 43 -21.2% -17.3% 24 33 42 +37.5% +27.3% 496 27 –– -94.6% 336 166 99 -50.6% -40.4% Bozeman Belgrade Three Forks Big Sky
  • 8. Office: (832) 326-5787 Courtney@CourtneyFoster.com www.ReferredRealtyMT.com Courtney Foster Referred Realty Group Each data point is one month of activity. Data is from February 5, 2018. All data from Big Sky Country MLS, a subsidiary of the Gallatin Association of REALTORS®. InfoSparks © 2018 ShowingTime. January Average Price Per Square Foot Bozeman & Belgrade & Three Forks & Big Sky $0 $50 $100 $150 $200 $250 $300 $350 2016 2017 2018 $166 $209 $218 +25.9% +4.3% $152 $161 $159 +5.9% -1.2% $54 $167 –– +209.3% $312 $313 $305 +0.3% -2.6% Bozeman Belgrade Three Forks Big Sky
  • 9. Local Market Update – December 2017 This is a research tool provided by the Big Sky Country MLS Bozeman City Limits Single Family December Year to Date Key Metrics 2016 2017 % Change Thru 12-2016 Thru 12-2017 % Change New Listings 21 21 0.0% 669 638 - 4.6% Pending Sales 26 25 - 3.8% 600 564 - 6.0% Closed Sales 39 39 0.0% 588 565 - 3.9% Days on Market Until Sale 50 75 + 50.0% 64 58 - 9.4% Median Sales Price* $330,000 $390,000 + 18.2% $359,250 $381,500 + 6.2% Average Sales Price* $349,198 $433,783 + 24.2% $399,724 $425,992 + 6.6% Percent of List Price Received* 98.8% 99.2% + 0.4% 99.0% 99.2% + 0.2% Inventory of Homes for Sale 101 87 - 13.9% –– –– –– Months Supply of Inventory 2.0 1.9 - 5.0% –– –– –– Condo/Townhouse December Year to Date Key Metrics 2016 2017 % Change Thru 12-2016 Thru 12-2017 % Change New Listings 20 20 0.0% 458 533 + 16.4% Pending Sales 22 19 - 13.6% 459 440 - 4.1% Closed Sales 31 50 + 61.3% 448 447 - 0.2% Days on Market Until Sale 79 39 - 50.6% 60 59 - 1.7% Median Sales Price* $268,025 $227,795 - 15.0% $240,000 $260,000 + 8.3% Average Sales Price* $291,851 $269,745 - 7.6% $261,915 $297,958 + 13.8% Percent of List Price Received* 98.2% 99.4% + 1.2% 98.9% 99.6% + 0.7% Inventory of Homes for Sale 52 88 + 69.2% –– –– –– Months Supply of Inventory 1.4 2.4 + 71.4% –– –– –– * Does not account for sale concessions and/or downpayment assistance. | Percent changes are calculated using rounded figures and can sometimes look extreme due to small sample size. A rolling 12-month calculation represents the current month and the 11 months prior in a single data point. If no activity occurred during a month, the line extends to the next available data point. Median Sales Price - Single Family Rolling 12-Month Calculation Gallatin County Bozeman City Limits 1-2003 1-2005 1-2007 1-2009 1-2011 1-2013 1-2015 1-2017 $150,000 $200,000 $250,000 $300,000 $350,000 $400,000 Median Sales Price - Condo Rolling 12-Month Calculation Gallatin County Bozeman City Limits 1-2003 1-2005 1-2007 1-2009 1-2011 1-2013 1-2015 1-2017 $100,000 $150,000 $200,000 $250,000 $300,000 Current as of January 10, 2018. All data from Big Sky Country Multiple Listing Service®. Report © 2018 ShowingTime.
  • 10. Local Market Update – December 2017 This is a research tool provided by the Big Sky Country MLS Belgrade Single Family December Year to Date Key Metrics 2016 2017 % Change Thru 12-2016 Thru 12-2017 % Change New Listings 12 17 + 41.7% 358 405 + 13.1% Pending Sales 20 16 - 20.0% 303 358 + 18.2% Closed Sales 28 24 - 14.3% 299 358 + 19.7% Days on Market Until Sale 61 24 - 60.7% 41 37 - 9.8% Median Sales Price* $291,525 $288,300 - 1.1% $255,000 $287,250 + 12.6% Average Sales Price* $292,145 $345,131 + 18.1% $284,281 $322,039 + 13.3% Percent of List Price Received* 97.4% 98.7% + 1.3% 99.1% 99.0% - 0.1% Inventory of Homes for Sale 50 49 - 2.0% –– –– –– Months Supply of Inventory 2.0 1.6 - 20.0% –– –– –– Condo/Townhouse December Year to Date Key Metrics 2016 2017 % Change Thru 12-2016 Thru 12-2017 % Change New Listings 2 2 0.0% 83 91 + 9.6% Pending Sales 1 1 0.0% 87 84 - 3.4% Closed Sales 5 6 + 20.0% 92 84 - 8.7% Days on Market Until Sale 35 24 - 31.4% 45 26 - 42.2% Median Sales Price* $159,000 $190,950 + 20.1% $167,750 $189,450 + 12.9% Average Sales Price* $162,080 $202,050 + 24.7% $165,962 $187,290 + 12.9% Percent of List Price Received* 99.5% 99.5% 0.0% 99.5% 99.5% 0.0% Inventory of Homes for Sale 8 10 + 25.0% –– –– –– Months Supply of Inventory 1.1 1.4 + 27.3% –– –– –– * Does not account for sale concessions and/or downpayment assistance. | Percent changes are calculated using rounded figures and can sometimes look extreme due to small sample size. A rolling 12-month calculation represents the current month and the 11 months prior in a single data point. If no activity occurred during a month, the line extends to the next available data point. Median Sales Price - Single Family Rolling 12-Month Calculation Gallatin County Belgrade 1-2003 1-2005 1-2007 1-2009 1-2011 1-2013 1-2015 1-2017 $100,000 $150,000 $200,000 $250,000 $300,000 $350,000 $400,000 Median Sales Price - Condo Rolling 12-Month Calculation Gallatin County Belgrade 1-2003 1-2005 1-2007 1-2009 1-2011 1-2013 1-2015 1-2017 $50,000 $100,000 $150,000 $200,000 $250,000 $300,000 Current as of January 10, 2018. All data from Big Sky Country Multiple Listing Service®. Report © 2018 ShowingTime.
  • 11. Local Market Update – December 2017 This is a research tool provided by the Big Sky Country MLS Greater Big Sky Single Family December Year to Date Key Metrics 2016 2017 % Change Thru 12-2016 Thru 12-2017 % Change New Listings 5 11 + 120.0% 108 118 + 9.3% Pending Sales 7 2 - 71.4% 63 79 + 25.4% Closed Sales 4 10 + 150.0% 63 80 + 27.0% Days on Market Until Sale 158 215 + 36.1% 228 207 - 9.2% Median Sales Price* $920,000 $1,437,500 + 56.3% $1,050,000 $1,160,000 + 10.5% Average Sales Price* $885,000 $1,584,814 + 79.1% $1,486,482 $1,381,248 - 7.1% Percent of List Price Received* 93.1% 94.2% + 1.2% 95.3% 94.6% - 0.7% Inventory of Homes for Sale 81 72 - 11.1% –– –– –– Months Supply of Inventory 14.1 10.9 - 22.7% –– –– –– Condo/Townhouse December Year to Date Key Metrics 2016 2017 % Change Thru 12-2016 Thru 12-2017 % Change New Listings 7 31 + 342.9% 223 226 + 1.3% Pending Sales 9 7 - 22.2% 171 174 + 1.8% Closed Sales 13 10 - 23.1% 174 167 - 4.0% Days on Market Until Sale 119 107 - 10.1% 171 136 - 20.5% Median Sales Price* $525,000 $379,750 - 27.7% $335,000 $365,000 + 9.0% Average Sales Price* $658,370 $487,130 - 26.0% $421,239 $450,943 + 7.1% Percent of List Price Received* 98.1% 96.7% - 1.4% 95.8% 96.5% + 0.7% Inventory of Homes for Sale 123 120 - 2.4% –– –– –– Months Supply of Inventory 8.6 8.3 - 3.5% –– –– –– * Does not account for sale concessions and/or downpayment assistance. | Percent changes are calculated using rounded figures and can sometimes look extreme due to small sample size. A rolling 12-month calculation represents the current month and the 11 months prior in a single data point. If no activity occurred during a month, the line extends to the next available data point. Median Sales Price - Single Family Rolling 12-Month Calculation Gallatin County Greater Big Sky 1-2003 1-2005 1-2007 1-2009 1-2011 1-2013 1-2015 1-2017 $0 $500,000 $1,000,000 $1,500,000 $2,000,000 Median Sales Price - Condo Rolling 12-Month Calculation Gallatin County Greater Big Sky 1-2003 1-2005 1-2007 1-2009 1-2011 1-2013 1-2015 1-2017 $0 $100,000 $200,000 $300,000 $400,000 $500,000 $600,000 Current as of January 10, 2018. All data from Big Sky Country Multiple Listing Service®. Report © 2018 ShowingTime.
  • 12. Local Market Update – December 2017 This is a research tool provided by the Big Sky Country MLS Livingston City Limits Single Family December Year to Date Key Metrics 2016 2017 % Change Thru 12-2016 Thru 12-2017 % Change New Listings 4 5 + 25.0% 176 169 - 4.0% Pending Sales 4 5 + 25.0% 129 157 + 21.7% Closed Sales 9 8 - 11.1% 136 153 + 12.5% Days on Market Until Sale 51 24 - 52.9% 62 50 - 19.4% Median Sales Price* $223,000 $274,500 + 23.1% $199,950 $230,000 + 15.0% Average Sales Price* $204,944 $270,648 + 32.1% $206,064 $235,252 + 14.2% Percent of List Price Received* 95.4% 96.5% + 1.2% 96.3% 97.2% + 0.9% Inventory of Homes for Sale 45 27 - 40.0% –– –– –– Months Supply of Inventory 4.2 2.1 - 50.0% –– –– –– Condo/Townhouse December Year to Date Key Metrics 2016 2017 % Change Thru 12-2016 Thru 12-2017 % Change New Listings 0 0 –– 19 31 + 63.2% Pending Sales 0 0 –– 10 25 + 150.0% Closed Sales 1 3 + 200.0% 12 22 + 83.3% Days on Market Until Sale 13 44 + 238.5% 26 26 0.0% Median Sales Price* $115,000 $219,000 + 90.4% $163,250 $176,000 + 7.8% Average Sales Price* $115,000 $219,333 + 90.7% $154,463 $197,112 + 27.6% Percent of List Price Received* 96.6% 96.9% + 0.3% 97.9% 97.0% - 0.9% Inventory of Homes for Sale 7 6 - 14.3% –– –– –– Months Supply of Inventory 4.2 1.9 - 54.8% –– –– –– * Does not account for sale concessions and/or downpayment assistance. | Percent changes are calculated using rounded figures and can sometimes look extreme due to small sample size. A rolling 12-month calculation represents the current month and the 11 months prior in a single data point. If no activity occurred during a month, the line extends to the next available data point. Median Sales Price - Single Family Rolling 12-Month Calculation Gallatin County Livingston City Limits 1-2003 1-2005 1-2007 1-2009 1-2011 1-2013 1-2015 1-2017 $50,000 $100,000 $150,000 $200,000 $250,000 $300,000 $350,000 $400,000 Median Sales Price - Condo Rolling 12-Month Calculation Gallatin County Livingston City Limits 1-2003 1-2005 1-2007 1-2009 1-2011 1-2013 1-2015 1-2017 $50,000 $100,000 $150,000 $200,000 $250,000 $300,000 Current as of January 10, 2018. All data from Big Sky Country Multiple Listing Service®. Report © 2018 ShowingTime.