Pi Financials Mar 2 2009
•
0 gostou•224 visualizações

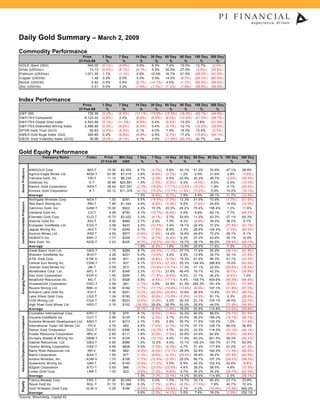
The document provides a daily summary of commodity and index performance as of February 27, 2009. It includes the price and 1-day, 7-day, 14-day, 30-day, 60-day, 90-day, 180-day and 360-day percentage changes for various commodities including gold, silver, platinum and base metals. It also provides the same price and percentage change data for stock market indexes and various gold mining company equities. The summary seeks to analyze recent performance trends in commodities, markets and gold mining stocks.

Recomendados
Mais conteúdo relacionado
Mais procurados
Mais procurados (20)
Destaque
Destaque (20)
Semelhante a Pi Financials Mar 2 2009
Semelhante a Pi Financials Mar 2 2009 (20)
Mais de Christopher R Anderson
Mais de Christopher R Anderson (20)
Último
Último (20)
Pi Financials Mar 2 2009
- 1. Daily Gold Summary – March 2, 2009 Commodity Performance Price 1 Da y 7 Da y 14 Da y 30 Da y 60 Da y 90 Da y 180 Da y 360 Da y 27-Fe b-09 % % % % % % % % GOLD (Spot USD) 945.05 (0.1% ) (4.8% ) 0.4% 6.5% 7.4% 15.5% 13.7% (2.0% ) Silver (USD/oz) 13.13 (0.0% ) (9.1% ) (4.1% ) 9.3% 20.5% 27.5% (3.5% ) (33.6% ) Platinum (USD/oz) 1,071.00 1.7% (1.1% ) 0.6% 12.0% 16.7% 21.5% (28.0% ) (51.9% ) Copper (USD/lb) 1.48 0.0% 0.0% 0.0% 0.0% 14.0% (9.7% ) (56.3% ) (60.0% ) Nickel (USD/lb) 4.53 0.0% 5.9% (2.7% ) (14.7% ) 4.0% (1.1% ) (50.5% ) (69.4% ) Zinc (USD/lb) 0.51 0.0% 3.2% (1.6% ) (1.3% ) (1.3% ) (7.9% ) (38.9% ) (59.4% ) Index Performance 1 Da y 7 Da y 14 Da y 30 Da y 60 Da y 90 Da y 180 Da y 360 Da y Price % % % % % % % % 27-Fe b-09 S&P 500 735.09 (2.4% ) (4.5% ) (11.1% ) (15.9% ) (15.5% ) (18.0% ) (42.7% ) (44.6% ) S&P/TSX Composite 8,123.02 (0.8% ) 2.2% (6.4% ) (8.8% ) (6.0% ) (12.4% ) (41.0% ) (39.7% ) S&P/TSX Global Gold Index 2,543.86 (0.1% ) (11.2% ) (9.8% ) 0.4% (5.4% ) 12.2% 3.8% (21.5% ) S&P/TSX Diversified Mining Index 2,488.90 (0.3% ) (9.6% ) (9.5% ) 0.4% (3.1% ) 13.1% (19.2% ) (35.0% ) SPDR Gold Trust (GLD) 92.63 (0.5% ) (5.3% ) 0.1% 6.0% 7.3% 15.3% 13.4% (2.7% ) AMEX Gold Bugs Index (HUI) 289.85 0.4% (9.8% ) (6.8% ) 0.5% (2.7% ) 17.2% (15.8% ) (40.1% ) CBOE Gold Volatillity Index (GVZ) 39.06 (2.2% ) (4.1% ) 4.1% 3.4% (11.9% ) (20.0% ) 42.7% n/a Gold Equity Performance Com pa ny Na m e Ticke r Price Mkt Ca p 1 Da y 7 Da y 14 Da y 30 Da y 60 Da y 90 Da y % 180 Da y 360 Da y 27-Fe b-09 USD % % % % % % % Senior Producers IAMGOLD Corp. IMG-T 10.30 $2,300 6.7% (3.7% ) 5.6% 30.1% 41.3% 74.9% 47.1% 28.8% Agnico-Eagle Mines Ltd. AEM-T 63.95 $7,519 3.6% (6.6% ) (3.7% ) 1.2% 2.9% 31.6% 4.9% (7.6% ) Yamana Gold, Inc. YRI-T 11.12 $6,239 2.7% (3.3% ) 0.5% 20.9% 20.2% 48.7% (3.6% ) (39.5% ) Goldcorp Inc. G-T 36.96 $20,881 1.5% (7.6% ) (5.5% ) 9.4% (4.0% ) 5.6% 2.4% (13.0% ) Barrick Gold Corporation ABX-T 38.45 $27,351 (2.3% ) (16.6% ) (17.7% ) (12.6% ) (15.2% ) 1.9% 4.1% (24.5% ) Kinross Gold Corporation K-T 20.12 $11,378 (4.1% ) (15.2% ) (13.7% ) (1.9% ) (10.6% ) 5.9% 15.0% (19.1% ) 1.3% (8.8% ) (5.7% ) 7.9% 5.8% 28.1% 11.7% (12.5% ) Ave ra ge Northgate Minerals Corp. NGX-T 1.53 $291 5.5% (14.5% ) (7.3% ) 13.3% 51.5% 73.9% (7.3% ) (51.0% ) Junior/Intermediate Producers Red Back Mining Inc. RBI-T 7.85 $1,344 4.9% (4.8% ) (3.9% ) 9.5% (7.6% ) 25.8% 14.6% (10.6% ) Gammon Gold, Inc. GAM-T 10.00 $922 4.2% 10.3% 20.5% 28.2% 70.4% 156.4% 1.2% 11.6% Centerra Gold Inc. CG-T 4.59 $750 4.1% (10.7% ) (6.9% ) 5.5% 9.8% 82.1% 7.7% (68.7% ) Eldorado Gold Corp. ELD-T 10.73 $3,022 3.3% (4.7% ) 2.7% 20.6% 11.2% 43.3% 27.1% 63.3% Alamos Gold Inc. AGI-T 8.50 $689 2.7% 2.4% 7.3% 8.3% (4.9% ) 39.3% 38.2% 9.7% European Goldfields Ltd. EGU-T 3.06 $423 2.0% (10.5% ) 3.4% 18.1% 22.4% 37.2% (27.8% ) (47.7% ) Jaguar Mining Inc. JAG-T 7.18 $359 0.7% (7.4% ) 8.6% 3.3% 28.9% 124.4% (1.0% ) (43.3% ) Aurizon Mines Ltd. ARZ-T 4.92 $577 (0.6% ) (1.8% ) 14.4% 16.6% 24.6% 73.2% 49.1% 9.1% SEMAFO Inc. SMF-T 1.77 $329 (1.7% ) (9.7% ) (9.2% ) 9.3% 37.2% 53.9% 35.1% 14.9% New Gold, Inc. NGD-T 2.43 $425 (4.3% ) (19.0% ) (10.3% ) 19.7% 38.1% 80.0% (56.6% ) (65.1% ) 1.9% (6.4% ) 1.8% 13.9% 25.6% 71.8% 7.3% (16.2% ) Ave ra ge Great Basin Gold Ltd. GBG-T 1.75 $288 6.7% (20.5% ) (11.2% ) 27.7% 17.4% 50.9% (36.1% ) (47.8% ) W estern Goldfields Inc. W GI-T 2.29 $231 5.0% (14.6% ) 3.2% 8.5% 13.9% 34.7% 33.1% (37.8% ) ATW Gold Corp. ATW -V 0.68 $31 4.6% (6.8% ) (9.3% ) 19.3% 61.9% 86.3% 51.1% (33.3% ) Central Sun Mining Inc. CSM-T 0.77 $37 4.1% (23.0% ) (21.4% ) 20.3% 148.4% 396.8% 10.0% (60.9% ) Emerging Producers Jinshan Gold Mines Inc. JIN-T 0.59 $73 3.5% (10.6% ) (15.7% ) 11.3% 31.1% 22.9% (55.6% ) (78.4% ) Minefinders Corp. Ltd. MFL-T 7.67 $348 2.3% (0.1% ) 27.8% 48.4% 19.7% 42.3% (8.7% ) (35.8% ) San Gold Corporation SGR-V 1.55 $284 1.3% (11.4% ) (9.9% ) 9.2% 21.1% 46.2% (6.6% ) 1.3% NovaGold Resources Inc. NG-T 3.72 $528 0.5% (6.8% ) (17.1% ) 5.4% 106.7% 409.6% (45.9% ) (64.8% ) OceanaGold Corporation OGC-T 0.59 $91 (1.7% ) 3.5% 22.9% 51.3% 293.3% 181.0% (9.2% ) (77.8% ) Rusoro Mining Ltd. RML-V 0.58 $182 (1.7% ) (17.1% ) (19.4% ) (13.4% ) (6.5% ) 107.1% (31.8% ) (67.0% ) Kirkland Lake Gold Inc. KGI-T 5.35 $251 (2.0% ) (22.5% ) (20.6% ) 10.8% 26.5% 13.8% (27.9% ) (49.3% ) Lake Shore Gold Corp. LSG-T 1.34 $190 (2.9% ) (6.9% ) (13.5% ) (2.9% ) (4.3% ) 81.1% 2.3% (29.8% ) CGA Mining Ltd. CGA-T 1.60 $333 (3.0% ) (4.2% ) 3.2% 20.3% 23.1% 105.1% 29.0% (22.0% ) High River Gold Mines Ltd. HRG-T 0.18 $102 (18.2% ) 28.6% 56.5% 50.0% 28.6% 44.0% (73.9% ) (94.5% ) (0.1% ) (8.0% ) (1.8% ) 19.0% 55.8% 115.8% (12.2% ) (49.8% ) Ave ra ge Crystallex International Corp. KRY-T 0.36 $76 9.1% (6.5% ) (1.4% ) 33.3% 80.0% 89.5% (74.1% ) (81.9% ) Advanced Exploration and Development Guyana Goldfields Inc. GUY-T 2.89 $125 7.4% (2.4% ) 2.1% 23.5% 56.2% 189.0% (14.7% ) (58.7% ) Anatolia Minerals Development Ltd. ANO-T 2.47 $213 4.7% 1.2% 2.9% 30.7% 71.5% 135.2% 1.2% (31.8% ) International Tower Hill Mines Ltd. ITH-V 2.76 $92 4.5% (7.4% ) (2.1% ) 12.7% 57.7% 128.1% 89.0% 56.8% Detour Gold Corporation DGC-T 10.63 $366 2.4% (10.3% ) 3.7% 24.2% 33.5% 114.3% (23.1% ) (44.1% ) Exeter Resource Corporation XRC-V 2.85 $111 1.8% (5.0% ) (7.8% ) 20.8% 23.9% 62.9% (5.9% ) (39.6% ) Dynasty Metals & Mining Inc. DMM-T 4.70 $129 1.3% (12.1% ) 4.4% 11.9% 40.3% 261.5% 59.3% (40.2% ) Gabriel Resources, Ltd. GBU-T 2.95 $586 1.0% 12.2% 5.4% 10.1% 109.2% 100.7% 31.7% 63.9% Osisko Mining Corporation OSK-T 4.66 $608 0.0% (7.5% ) (4.5% ) 4.7% 31.3% 117.8% 41.2% (21.5% ) Rainy River Resources Ltd. RR-V 1.85 $82 (0.5% ) (8.4% ) (13.1% ) 25.0% 52.9% 164.3% (11.9% ) (62.2% ) Banro Corporation BAA-T 1.55 $77 (1.3% ) (8.8% ) (4.3% ) (29.5% ) 39.6% 58.2% (57.9% ) (83.9% ) Andina Minerals, Inc. ADM-V 1.70 $108 (1.7% ) (12.4% ) (2.9% ) 25.0% 66.7% 107.3% (29.2% ) (59.3% ) Queenston Mining Inc. QMI-T 3.40 $145 (2.9% ) (11.2% ) 0.0% 6.9% 28.3% 102.4% 53.8% (6.8% ) B2gold Corporation BTO-T 0.65 $86 (3.0% ) (23.5% ) (23.5% ) 4.8% 38.3% 58.5% 4.8% (70.5% ) Linear Gold Corp. LRR-T 1.02 $23 (3.8% ) (7.3% ) (5.6% ) 9.7% 34.2% 34.2% (29.7% ) (62.2% ) 1.3% (7.3% ) (3.1% ) 14.2% 50.9% 114.9% 2.3% (36.1% ) Ave ra ge Franco-Nevada Corp. FNV-T 27.00 $2,056 3.5% 0.0% 1.3% 14.7% 30.1% 60.2% 27.7% 23.8% Royalty Royal Gold Inc. RGL-T 51.72 $1,398 0.3% (7.7% ) (2.8% ) (6.3% ) (11.6% ) 7.8% 40.7% 72.4% Gold W heaton Gold Corp. GLW -V 0.25 $184 (2.0% ) (2.0% ) (10.9% ) 2.1% 4.3% (10.9% ) (73.9% ) 600.0% 0.6% (3.2% ) (4.1% ) 3.5% 7.6% 19.0% (1.9% ) 232.1% Ave ra ge Source: Bloomberg, Capital IQ
- 2. Relative Valuation – Enterprise Value per Ounce Au In-Situ Company Name Ticker Price 30 day Performance (%) Enterprise Value Ounces Au Enterprise Value per Ounce Au 27-Feb-09 USD (MM)* (MM)** Senior Producers Agnico-Eagle Mines Ltd. AEM-T 63.95 1.2% $7,616 24.2 $314.63 Goldcorp Inc. G-T 36.96 9.4% $20,673 92.4 $223.81 Barrick Gold Corporation ABX-T 38.45 (12.6%) $30,652 183.0 $167.54 Kinross Gold Corporation K-T 20.12 (1.9%) $11,853 83.6 $141.79 Yamana Gold, Inc. YRI-T 11.12 20.9% $6,656 45.3 $146.87 IAMGOLD Corp. IMG-T 10.30 30.1% $2,252 29.8 $75.69 7.9% $13,284 76.4 $178.39 Average-Senior Producers Red Back Mining Inc. RBI-T 7.85 9.5% $1,326 4.7 $282.12 Junior/Intermediate Producers Eldorado Gold Corp. ELD-T 10.73 20.6% $2,925 14.1 $206.77 Alamos Gold Inc. AGI-T 8.50 8.3% $660 4.1 $162.02 Aurizon Mines Ltd. ARZ-T 4.92 16.6% $589 4.9 $120.82 Gammon Gold, Inc. GAM-T 10.00 28.2% $947 10.3 $92.31 Jaguar Mining Inc. JAG-T 7.18 3.3% $396 5.6 $71.39 SEMAFO Inc. SMF-T 1.77 9.3% $370 6.8 $54.34 New Gold, Inc. NGD-T 2.43 19.7% $426 9.7 $44.08 Centerra Gold Inc. CG-T 4.59 5.5% $588 14.9 $39.61 Northgate Minerals Corp. NGX-T 1.53 13.3% $279 9.3 $30.09 European Goldfields Ltd. EGU-T 3.06 18.1% $270 11.3 $24.00 13.9% $798 8.7 $102.51 Average-Junior/Intermediate Producers San Gold Corporation SGR-V 1.55 9.2% $282 1.6 $176.23 Minefinders Corp. Ltd. MFL-T 7.67 48.4% $435 3.8 $114.52 Lake Shore Gold Corp. LSG-T 1.34 (2.9%) $111 1.2 $90.91 CGA Mining Ltd. CGA-T 1.60 20.3% $398 5.1 $78.27 Kirkland Lake Gold Inc. KGI-T 5.35 10.8% $233 3.2 $73.70 Emerging Producers High River Gold Mines Ltd. HRG-T 0.18 50.0% $262 3.9 $66.74 Western Goldfields Inc. WGI-T 2.29 8.5% $271 4.5 $60.87 ATW Gold Corp. ATW-V 0.68 19.3% $32 0.7 $49.62 Great Basin Gold Ltd. GBG-T 1.75 27.7% $294 9.9 $29.72 NovaGold Resources Inc. NG-T 3.72 5.4% $782 27.0 $29.01 Central Sun Mining inc. CSM-T 0.77 20.3% $40 1.5 $27.39 OceanaGold Corporation OGC-T 0.59 51.3% $226 8.6 $26.22 Rusoro Mining Ltd. RML-V 0.58 (13.4%) $225 14.1 $15.96 Jinshan Gold Mines Inc. JIN-T 0.59 11.3% $107 7.4 $14.48 18.5% $275 6.6 $63.92 Average-Emerging Producers Queenston Mining Inc. QMI-T 3.40 6.9% $130 0.8 $155.90 Exeter Resource Corporation XRC-V 2.85 20.8% $90 1.3 $71.57 Advanced Exploration and Development Osisko Mining Corporation OSK-T 4.66 4.7% $544 8.4 $64.69 B2gold Corporation BTO-T 0.65 4.8% $37 1.0 $35.52 Anatolia Minerals Development Ltd. ANO-T 2.47 30.7% $198 6.0 $32.86 Gabriel Resources, Ltd. GBU-T 2.95 10.1% $521 17.6 $29.61 Detour Gold Corporation DGC-T 10.63 24.2% $360 13.2 $27.25 Rainy River Resources Ltd. RR-V 1.85 25.0% $69 3.6 $19.19 Dynasty Metals & Mining Inc. DMM-T 4.70 11.9% $113 6.9 $16.28 Guyana Goldfields Inc. GUY-T 2.89 23.5% $113 8.0 $14.08 International Tower Hill Mines Ltd. ITH-V 2.76 12.7% $87 6.8 $12.81 Andina Minerals, Inc. ADM-V 1.70 25.0% $91 9.9 $9.24 Banro Corporation BAA-T 1.55 (29.5%) $61 9.5 $6.43 Crystallex International Corp. KRY-T 0.36 33.3% $111 21.2 $5.24 Linear Gold Corp. LRR-T 1.02 9.7% $5 1.7 $2.65 12.0% $213 7.4 $42.26 Average - Exploration/Development Source: Capital IQ, Bloomberg, PI Financial * EV calculated as market cap less cash, plus total debt ** Ounces Au includes all resources (Measured, indicated and inferred), inclusive of reserves (proven and probable)
- 3. Financial Data and Forecasts Balance Sheet Data Income Statement Data Consensus Estimates Price 2008 2009 2010 Company Name Ticker Mkt Cap Cash & ST Working Cap. Debt (USD Enterprise Value TTM Revenue Gross margin TTM EBITDA TTM CFFO 27-Feb-09 USD (mm) P/CF*** P/CF*** P/CF*** Inv.(USD mm)* (USD mm)* mm)* (USD mm)** (USD mm)* (%)* (USD mm)* (USD mm)* Agnico-Eagle Mines Ltd. AEM-T 63.95 $7,519 $99 $178 $200 $7,616 $369 49% $95 $118 28.8 12.3 11.7 Senior Producers Barrick Gold Corporation ABX-T 38.45 $27,351 $1,437 $2,268 $4,556 $30,652 $7,913 48% $3,129 $2,206 10.1 10.1 10.4 Goldcorp Inc. G-T 36.96 $20,881 $272 $287 $5 $20,673 $2,420 52% $1,052 $866 21.9 18.3 16.0 IAMGOLD Corp. IMG-T 10.30 $2,300 $118 $105 $55 $2,252 $870 48% $342 $255 10.9 11.7 7.8 Kinross Gold Corporation K-T 20.12 $11,378 $525 $573 $951 $11,853 $1,617 52% $656 $444 11.8 11.7 14.7 Yamana Gold, Inc. YRI-T 11.12 $6,239 $126 $138 $580 $6,656 $1,159 58% $597 $405 12.0 10.5 9.7 Average-Senior Producers 15.9 12.4 11.7 Alamos Gold Inc. AGI-T 8.50 $689 $35 $55 $0 $660 $121 51% $50 $59 13.0 10.3 10.0 Junior/Intermediate Producers Aurizon Mines Ltd. ARZ-T 4.92 $577 $12 $18 $24 $589 $110 50% $40 $48 12.6 10.0 9.3 Centerra Gold Inc. CG-T 4.59 $750 $167 $336 $0 $588 $636 48% $239 $166 3.6 3.1 3.1 Eldorado Gold Corp. ELD-T 10.73 $3,022 $105 $185 $0 $2,925 $278 67% $143 $105 20.8 15.7 15.4 European Goldfields Ltd. EGU-T 3.06 $423 $188 $209 $0 $270 $70 33% $1 $8 43.7 53.4 13.4 Gammon Gold, Inc. GAM-T 10.00 $922 $5 $12 $35 $947 $204 32% $43 $49 18.3 11.1 9.4 Jaguar Mining Inc. JAG-T 7.18 $359 $41 $45 $86 $396 $81 42% $10 $8 40.3 7.5 5.9 New Gold, Inc. NGD-T 2.43 $425 $251 $260 $253 $426 $196 32% $36 $15 8.6 8.2 8.1 Northgate Minerals Corp. NGX-T 1.53 $291 $72 $13 $57 $279 $420 27% $61 $90 3.1 2.4 2.3 Red Back Mining Inc. RBI-T 7.85 $1,344 $50 $39 $28 $1,326 $195 48% $80 -$8 11.8 8.3 6.6 SEMAFO Inc. SMF-T 1.77 $329 $11 -$2 $61 $370 $143 42% $49 $34 5.8 4.6 3.8 Average-Junior/Intermediate Producers 16.5 12.2 7.9 ATW Gold Corp. ATW-V 0.68 $31 $5 $4 $6 $32 n/a n/a -$4 -$3 n/a n/a n/a Central Sun Mining inc. CSM-T 0.77 $37 $3 $1 $8 $40 $34 2% -$18 -$20 n/a 16.4 2.3 CGA Mining Ltd. LRR-T 1.60 $333 $31 $8 $102 $398 $3 100% -$12 -$5 n/a n/a n/a Great Basin Gold Ltd. GBG-T 1.75 $288 $5 $3 $10 $294 $6 45% -$88 -$77 n/a n/a n/a High River Gold Mines Ltd. HRG-T 0.18 $102 $7 -$68 $152 $262 $122 26% $9 -$1 n/a n/a n/a Emerging Producers Jinshan Gold Mines Inc. JIN-T 0.59 $73 $21 $30 $61 $107 $13 42% -$6 -$14 n/a n/a n/a Kirkland Lake Gold Inc. KGI-T 5.35 $251 $18 $14 $0 $233 $31 0% -$5 $0 n/a n/a n/a Lake Shore Gold Corp. LSG-T 1.34 $190 $80 $75 $0 $111 n/a n/a -$5 -$4 n/a 18.6 5.0 Minefinders Corp. Ltd. MFL-T 7.67 $348 $2 $2 $107 $435 n/a n/a -$17 -$16 n/a 10.0 5.4 NovaGold Resources Inc. NG-T 3.72 $528 $18 $6 $45 $782 $1 n/a $29 -$56 8.1 8.5 n/a OceanaGold Corporation OGC-T 0.59 $91 $10 -$43 $157 $226 $217 36% $64 $48 n/a n/a n/a Rusoro Mining Ltd. RML-V 0.58 $182 $20 $6 $73 $225 $53 -5% -$59 -$23 n/a n/a n/a San Gold Corporation SGR-V 1.55 $284 $9 $2 $6 $282 $5 n/a -$31 -$25 n/a 10.1 6.2 Western Goldfields Inc. WGI-T 2.29 $231 $38 $49 $86 $271 $72 33% $15 -$12 9.9 6.4 4.5 Average-Emerging Producers 9.0 11.7 4.7 Anatolia Minerals Development Ltd. ANO-T 2.47 $213 $86 $84 $69 $198 n/a n/a -$16 -$14 n/a n/a n/a Andina Minerals, Inc. ADM-V 1.70 $108 $20 $19 $0 $91 n/a n/a -$2 -$4 n/a n/a n/a Advanced Exploration and Development B2gold Corporation BTO-T 0.65 $86 $61 $57 $3 $37 n/a n/a -$10 -$7 n/a n/a n/a Banro Corporation BAA-T 1.55 $77 $19 $12 $0 $61 n/a n/a -$7 -$3 n/a n/a n/a Crystallex International Corp. KRY-T 0.36 $76 $45 $40 $86 $111 n/a n/a -$22 -$28 n/a n/a n/a Detour Gold Corporation DGC-T 10.63 $366 $6 $45 $0 $360 n/a n/a -$28 -$24 n/a n/a n/a Dynasty Metals & Mining Inc. DMM-T 4.70 $129 $16 $16 $0 $113 n/a n/a -$2 -$1 n/a n/a n/a Exeter Resource Corporation XRC-V 2.85 $111 $21 $18 $0 $90 n/a n/a -$20 -$15 n/a n/a n/a Gabriel Resources, Ltd. GBU-T 2.95 $586 $65 $40 $0 $521 n/a n/a -$9 -$17 n/a n/a n/a Guyana Goldfields Inc. GUY-T 2.89 $125 $12 $11 $0 $113 n/a n/a -$2 $1 n/a n/a n/a International Tower Hill Mines Ltd. ITH-V 2.76 $92 $5 $5 $0 $87 n/a n/a -$3 -$2 n/a n/a n/a Linear Gold Corp. LRR-T 1.02 $23 $19 $20 $0 $5 $0 100% -$2 -$1 4.0 2.5 3.2 Osisko Mining Corporation OSK-T 4.66 $608 $83 $99 $19 $544 n/a n/a -$6 -$3 n/a n/a n/a Queenston Mining Inc. QMI-T 3.40 $145 $15 $15 $0 $130 n/a n/a $1 -$7 n/a n/a n/a Rainy River Resources Ltd. RR-V 1.85 $82 $13 $21 $0 $69 n/a n/a -$2 $0 n/a n/a n/a Average - Exploration/Development n/a n/a n/a Royal Gold Inc. RGL-T 51.72 $1,398 $55 $51 $19 $1,374 $70 94% $56 $44 26.2 20.5 n/a Royalty Franco-Nevada Corp. FNV-T 27.00 $2,056 $318 $334 $0 $1,791 $92 95% -$64 $23 19.3 20.2 17.1 Gold Wheaton Gold Corp. GLW-V 0.25 $184 $67 $72 $0 $167 $9 52% $0 -$2 n/a 6.6 4.3 Average - Royalty Companies 22.8 15.8 10.7 Source: Bloomberg, Capital IQ, PI Financial * Data from most recently filed quarterly financial statements, sourced through Capital IQ ** EV calculated as market cap less cash, plus total debt *** Reuters estimates sourced through Capital IQ
- 4. Analyst Opinions Com pa ny Na m e Ticke r Price Mkt Ca p Tota l Me dia n Tg. Re turn Buy OP Hold UP Se ll 27-Fe b-09 USD (MM) Ana lysts Px . ove r ta rge t Kinross Gold Corporation K-T 20.12 $11,378 21 27.00 34% Senior Producers 4 8 9 0 0 Barrick Gold Corporation ABX-T 38.45 $27,351 28 50.89 32% 8 5 13 2 0 Goldcorp Inc. G-T 36.96 $20,881 23 46.00 24% 8 6 9 0 0 Yamana Gold, Inc. YRI-T 11.12 $6,239 21 13.72 23% 7 8 5 0 1 Agnico-Eagle Mines Ltd. AEM-T 63.95 $7,519 21 78.88 23% 8 3 9 0 1 IAMGOLD Corp. IMG-T 10.30 $2,300 16 10.18 -1% 3 6 7 0 0 23% Ave ra ge -Se nior Produce rs European Goldfields Ltd. EGU-T 3.06 $423 5 5.09 66% 3 2 0 0 0 Junior/Intermidiate Producers Jaguar Mining Inc. JAG-T 7.18 $359 3 10.53 47% 1 2 0 0 0 Red Back Mining Inc. RBI-T 7.85 $1,344 11 11.45 46% 3 8 0 0 0 SEMAFO Inc. SMF-T 1.77 $329 6 2.48 40% 3 2 1 0 0 Centerra Gold Inc. CG-T 4.59 $750 9 6.36 39% 2 1 6 0 0 New Gold, Inc. NGD-T 2.43 $425 6 3.00 23% 0 2 3 0 1 Northgate Minerals Corp. NGX-T 1.53 $291 8 1.84 20% 3 0 4 1 0 Alamos Gold Inc. AGI-T 8.50 $689 12 9.98 17% 5 4 3 0 0 Aurizon Mines Ltd. ARZ-T 4.92 $577 6 5.50 12% 3 3 0 0 0 Eldorado Gold Corp. ELD-T 10.73 $3,022 22 11.61 8% 5 7 9 0 1 Gammon Gold, Inc. GAM-T 10.00 $922 6 8.22 -18% 1 0 3 2 0 27% Ave ra ge -Junior/Inte rm e dia te Produce rs High River Gold Mines Ltd. HRG-T 0.18 $102 5 0.70 289% 1 1 0 2 1 OceanaGold Corporation OGC-T 0.59 $91 3 1.91 224% 1 1 1 0 0 CGA Mining Ltd. LSG-T 1.60 $333 1 3.10 94% 0 1 0 0 0 Kirkland Lake Gold Inc. KGI-T 5.35 $251 1 9.00 68% 0 1 0 0 0 Lake Shore Gold Corp. LSG-T 1.34 $190 3 2.20 64% 2 1 0 0 0 Emerging Producers San Gold Corporation SGR-V 1.55 $284 5 2.23 44% 2 3 0 0 0 Great Basin Gold Ltd. GBG-T 1.75 $288 2 2.48 41% 0 1 1 0 0 Minefinders Corp. Ltd. MFL-T 7.67 $348 4 9.83 28% 2 1 0 0 1 W estern Goldfields Inc. W GI-T 2.29 $231 5 2.75 20% 2 2 1 0 0 NovaGold Resources Inc. NG-T 3.72 $528 3 3.00 -19% 0 1 0 1 1 Central Sun Mining inc. CSM-T 0.77 $37 1 0.55 -29% 0 0 1 0 0 ATW Gold Corp. ATW -V 0.68 $31 0 n/a n/a 0 0 0 0 0 Rusoro Mining Ltd. RML-V 0.58 $182 0 n/a n/a 0 0 0 0 0 Jinshan Gold Mines Inc. JIN-T 0.59 $73 0 n/a n/a 0 0 0 0 0 75% Ave ra ge -Em e rging Produce rs Guyana Goldfields Inc. GUY-T 2.89 $125 2 8.75 203% 0 2 0 0 0 Rainy River Resources Ltd. RR-V 1.85 $82 4 4.00 116% 2 2 0 0 0 Advanced Exploration and Development Crystallex International Corp. KRY-T 0.36 $76 1 0.73 102% 0 0 1 0 0 Linear Gold Corp. LRR-T 1.02 $23 1 2.00 96% 0 1 0 0 0 Anatolia Minerals Development Ltd. ANO-T 2.47 $213 6 4.09 66% 3 3 0 0 0 International Tower Hill Mines Ltd. ITH-V 2.76 $92 2 4.50 63% 2 0 0 0 0 Andina Minerals, Inc. ADM-V 1.70 $108 4 2.75 62% 3 0 1 0 0 B2gold Corporation BTO-T 0.65 $86 1 0.95 46% 1 0 0 0 0 Dynasty Metals & Mining Inc. DMM-T 4.70 $129 2 6.40 36% 1 1 0 0 0 Osisko Mining Corporation OSK-T 4.66 $608 8 6.25 34% 3 5 0 0 0 Detour Gold Corporation DGC-T 10.63 $366 9 13.30 25% 3 5 1 0 0 Exeter Resource Corporation XRC-V 2.85 $111 1 3.53 24% 1 0 0 0 0 Banro Corporation BAA-T 1.55 $77 1 1.57 1% 0 0 1 0 0 Gabriel Resources, Ltd. GBU-T 2.95 $586 7 2.25 -24% 0 1 3 3 0 Queenston Mining Inc. QMI-T 3.40 $145 0 n/a n/a 0 0 0 0 0 61% Ave ra ge - Ex plora tion/De ve lopm e nt Gold W heaton Gold Corp. GLW -V 0.25 $184 4 0.65 165% 1 3 0 0 0 Royalty Franco-Nevada Corp. FNV-T 27.00 $2,056 9 28.22 5% 1 5 3 0 0 Royal Gold Inc. RGL-T 51.72 $1,398 4 53.43 3% 0 0 0 3 1 58% Ave ra ge - Roya lty Com pa nie s Source: Bloomberg, Capital IQ, PI Financial
- 5. Disclaimer PI Financial Corp. www.pifinancialcorp.com Head Office Calgary Office Victoria Office Suite 1560, 300 5th Avenue SW Suite 1900, 666 Burrard Street Suite 620, 880 Douglas Street Vancouver, BC, Canada V6C 3N1 Calgary, AB, Canada T2P 3C4 Victoria, BC, Canada V8W 2B7 ph: 604.664.2900 ph: 403.543.2900 ph: 250.405.2900 fx: 604.664.2666 fx: 403.543.2800 fx: 250.405.2911 Members: All major Canadian Stock Exchanges, Investment Industry Regulatory Organization of Canada, Canadian Investor Protection Fund and Interna- tional Financial Centre (British Columbia). Estimates and projections contained herein are our own and are based on assumptions which we believe to be reasonable. Information presented herein, while obtained from sources we believe to be reliable, is not guaranteed either as to accuracy or completeness, nor in providing it does PI Financial Corp. assume any responsibility or liability. This information is given as of the date appearing on this report, and PI Financial Corp. assumes no obligation to update the information or advise on further developments relating to securities. PI Financial Corp. and its affili- ates, as well as their respective partners, directors, shareholders, and employees may have a position in the securities mentioned herein and may make purchases and/or sales from time to time. PI Financial Corp. may act, or may have acted in the past, as a financial advisor, fiscal agent or underwriter for certain of the companies mentioned herein and may receive, or may have received, a remuneration for their services from those companies. This report is not to be construed as an offer to sell, or the solicitation of an offer to buy, securities and is intended for distribution only in those jurisdictions where PI Financial Corp. is registered as an advisor or a dealer in securities. Any distribution or dissemination of this report in any other jurisdiction is strictly prohibited. For further disclosure information, reader is referred to the disclosure section of our website.