Apidays New York 2024 - Accelerating FinTech Innovation by Vasa Krishnan, Fin...
Piper Jaffray Google+ and Yelp reviews comparison study
1. C O M P A N Y N O T E
A p r i l 1 6 , 2 0 1 4
Yelp, Inc. (YELP) Neutral
Introducing Review Growth for Yelp vs. Google Plus
PRICE: US$63.06
TARGET: US$80.00
(10.5x FY15E EV/revenue)
Gene Munster
Sr Research Analyst, Piper Jaffray & Co.
612 303-6452, gene.a.munster@pjc.com
Douglas J. Clinton
Research Analyst, Piper Jaffray & Co.
212 284-9488, douglas.j.clinton@pjc.com
Travis S. Jakel
Analytics Specialist, Piper Jaffray & Co.
Changes Previous Current
Rating — Neutral
Price Tgt — US$80.00
FY14E Rev (mil) — US$355.6
FY15E Rev (mil) — US$489.9
FY14E EPS — US$(0.04)
FY15E EPS — US$0.22
52-Week High / Low US$101.75 / US$24.75
Shares Out (mil) 68.9
Market Cap. (mil) US$4,344.8
Avg Daily Vol (000) 4,180
Book Value/Share US$7.06
Net Cash Per Share US$5.56
Debt to Total Capital 0%
Yield 0.00%
Fiscal Year End Dec
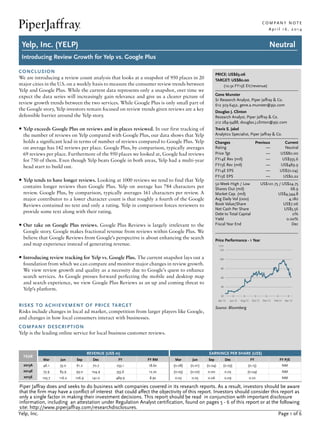
Price Performance - 1 Year
Apr-13 Jun-13 Aug-13 Oct-13 Dec-13 Feb-14 Apr-14
120
100
80
60
40
20
USD
Source: Bloomberg
CONCLUSION
We are introducing a review count analysis that looks at a snapshot of 950 places in 20
major cities in the U.S. on a weekly basis to measure the consumer review trends between
Yelp and Google Plus. While the current data represents only a snapshot, over time we
expect the data series will increasingly gain relevance and give us a clearer picture of
review growth trends between the two services. While Google Plus is only small part of
the Google story, Yelp investors remain focused on review trends given reviews are a key
defensible barrier around the Yelp story.
• Yelp exceeds Google Plus on reviews and in places reviewed. In our first tracking of
the number of reviews on Yelp compared with Google Plus, our data shows that Yelp
holds a significant lead in terms of number of reviews compared to Google Plus. Yelp
on average has 142 reviews per place. Google Plus, by comparison, typically averages
69 reviews per place. Furthermore of the 950 places we looked at, Google had reviews
for 750 of them. Even though Yelp beats Google in both areas, Yelp had a multi-year
head start to build out.
• Yelp tends to have longer reviews. Looking at 1000 reviews we tend to find that Yelp
contains longer reviews than Google Plus. Yelp on average has 784 characters per
review. Google Plus, by comparison, typically averages 161 characters per review. A
major contributor to a lower character count is that roughly a fourth of the Google
Reviews contained no text and only a rating. Yelp in comparison forces reviewers to
provide some text along with their rating.
• Our take on Google Plus reviews. Google Plus Reviews is largely irrelevant to the
Google story. Google makes fractional revenue from reviews within Google Plus. We
believe that Google Reviews from Google's perspective is about enhancing the search
and map experience instead of generating revenue.
• Introducing review tracking for Yelp vs. Google Plus. The current snapshot lays out a
foundation from which we can compare and monitor major changes in review growth.
We view review growth and quality as a necessity due to Google’s quest to enhance
search services. As Google presses forward perfecting the mobile and desktop map
and search experience, we view Google Plus Reviews as an up and coming threat to
Yelp's platform.
RISKS TO ACHIEVEMENT OF PRICE TARGET
Risks include changes in local ad market, competition from larger players like Google,
and changes in how local consumers interact with businesses.
COMPANY DESCRIPTION
Yelp is the leading online service for local business customer reviews.
YEAR
2013A
2014E
2015E
REVENUE (US$ m)
Mar Jun Sep Dec FY FY RM
46.1 55.0 61.2 70.7 233.1 18.6x
73.9 83.9 93.0 104.9 355.6 12.2x
105.7 116.2 126.9 141.0 489.9 8.9x
EARNINGS PER SHARE (US$)
Mar Jun Sep Dec FY FY P/E
(0.08) (0.01) (0.04) (0.03) (0.15) NM
(0.05) (0.02) 0.00 0.03 (0.04) NM
0.03 0.05 0.06 0.09 0.22 NM
Page 1 of 6Yelp, Inc.
Piper Jaffray does and seeks to do business with companies covered in its research reports. As a result, investors should be aware
that the firm may have a conflict of interest that could affect the objectivity of this report. Investors should consider this report as
only a single factor in making their investment decisions. This report should be read in conjunction with important disclosure
information, including an attestation under Regulation Analyst certification, found on pages 5 - 6 of this report or at the following
site: http://www.piperjaffray.com/researchdisclosures.
2. C O M P A N Y N O T E
A p r i l 1 6 , 2 0 1 4
Google Reviews vs. Yelp Snapshot of the number of reviews for 950 locations in 20 major cities across the United States.
Comparison of the 750 places they both have:
Total # of Reviews
Google Reviews 51561
Yelp Reviews 106660
Comparison of Yelp 50 places vs. Google 50 places:
Total # of Reviews
Google Reviews 51561
Yelp Reviews 126174
Sources: Yelp, Google, Piper Jaffray research
Page 2 of 6Yelp, Inc.
3. C O M P A N Y N O T E
A p r i l 1 6 , 2 0 1 4
Categorical Breakdown of Reviews:
Google Reviews and Yelp
Below is a categorical breakdown of the 750 places where they both have reviews and what
percent each category contributed to the total.
Google Number of Reviews
Category 4/15/2014 % of Total
Restaurants 24919 48.3%
Shopping 3629 7.0%
Local Services 3884 7.5%
Arts & Entertainment 5526 10.7%
Beauty & Spas 7184 13.9%
Bars / Nightlife 1501 2.9%
Automotive 305 0.6%
Health & Medical 171 0.3%
Public Services & Government 1490 2.9%
Home Services 1984 3.8%
Active Life 535 1.0%
Hotels & Travel 355 0.7%
Education 13 0.0%
Professtional Services 0 0.0%
Professional Services 33 0.1%
Religious Organizations 32 0.1%
Financial Services 0 0.0%
Yelp Number of Reviews
Category 4/15/2014 % of Total
Restaurants 48391 45.4%
Shopping 18515 17.4%
Local Services 6365 6.0%
Arts & Entertainment 12332 11.6%
Beauty & Spas 4351 4.1%
Bars / Nightlife 4721 4.4%
Automotive 3535 3.3%
Health & Medical 1282 1.2%
Public Services & Government 4689 4.4%
Home Services 446 0.4%
Active Life 620 0.6%
Hotels & Travel 820 0.8%
Education 259 0.2%
Professional Services 310 0.3%
Religious Organizations 24 0.0%
Financial Services 0 0.0%
Sources: Yelp, Google, Piper Jaffray research.
Page 3 of 6Yelp, Inc.
5. C O M P A N Y N O T E
A p r i l 1 6 , 2 0 1 4
IMPORTANT RESEARCH DISCLOSURES
Notes: The boxes on the Rating and Price Target History chart above indicate the date of the Research Note, the rating, and the price target. Each
box represents a date on which an analyst made a change to a rating or price target, except for the first box, which may only represent the first Note
written during the past three years.
Legend:
I: Initiating Coverage
R: Resuming Coverage
T: Transferring Coverage
D: Discontinuing Coverage
S: Suspending Coverage
OW: Overweight
N: Neutral
UW: Underweight
NA: Not Available
UR: Under Review
Distribution of Ratings/IB Services
Piper Jaffray
IB Serv./Past 12 Mos.
Rating Count Percent Count Percent
BUY [OW] 354 60.00 83 23.45
HOLD [N] 215 36.44 21 9.77
SELL [UW] 21 3.56 0 0.00
Note: Distribution of Ratings/IB Services shows the number of companies currently in each rating category from which Piper Jaffray and its affiliates
received compensation for investment banking services within the past 12 months. FINRA rules require disclosure of which ratings most closely
correspond with "buy," "hold," and "sell" recommendations. Piper Jaffray ratings are not the equivalent of buy, hold or sell, but instead represent
recommended relative weightings. Nevertheless, Overweight corresponds most closely with buy, Neutral with hold and Underweight with sell. See
Stock Rating definitions below.
Analyst Certification — Gene Munster, Sr Research Analyst
Analyst Certification — Douglas J. Clinton, Research Analyst
The views expressed in this report accurately reflect my personal views about the subject company and the subject security. In addition, no part of
my compensation was, is, or will be directly or indirectly related to the specific recommendations or views contained in this report.
Page 5 of 6Yelp, Inc.
6. C O M P A N Y N O T E
A p r i l 1 6 , 2 0 1 4
Research Disclosures
Piper Jaffray was making a market in the securities of Yelp, Inc. at the time this research report was published. Piper Jaffray will buy and sell Yelp,
Inc. securities on a principal basis.
Piper Jaffray research analysts receive compensation that is based, in part, on overall firm revenues, which include investment banking revenues.
Rating Definitions
Stock Ratings: Piper Jaffray ratings are indicators of expected total return (price appreciation plus dividend) within the next 12 months. At times
analysts may specify a different investment horizon or may include additional investment time horizons for specific stocks. Stock performance
is measured relative to the group of stocks covered by each analyst. Lists of the stocks covered by each are available at www.piperjaffray.com/
researchdisclosures. Stock ratings and/or stock coverage may be suspended from time to time in the event that there is no active analyst opinion
or analyst coverage, but the opinion or coverage is expected to resume. Research reports and ratings should not be relied upon as individual
investment advice. As always, an investor’s decision to buy or sell a security must depend on individual circumstances, including existing holdings,
time horizons and risk tolerance. Piper Jaffray sales and trading personnel may provide written or oral commentary, trade ideas, or other
information about a particular stock to clients or internal trading desks reflecting different opinions than those expressed by the research
analyst. In addition, Piper Jaffray technical research products are based on different methodologies and may contradict the opinions contained
in fundamental research reports.
• Overweight (OW): Anticipated to outperform relative to the median of the group of stocks covered by the analyst.
• Neutral (N): Anticipated to perform in line relative to the median of the group of stocks covered by the analyst.
• Underweight (UW): Anticipated to underperform relative to the median of the group of stocks covered by the analyst.
Other Important Information
The material regarding the subject company is based on data obtained from sources we deem to be reliable; it is not guaranteed as to accuracy and
does not purport to be complete. This report is solely for informational purposes and is not intended to be used as the primary basis of investment
decisions. Piper Jaffray has not assessed the suitability of the subject company for any person. Because of individual client requirements, it is not, and
it should not be construed as, advice designed to meet the particular investment needs of any investor. This report is not an offer or the solicitation
of an offer to sell or buy any security. Unless otherwise noted, the price of a security mentioned in this report is the market closing price as of the
end of the prior business day. Piper Jaffray does not maintain a predetermined schedule for publication of research and will not necessarily update
this report. Piper Jaffray policy generally prohibits research analysts from sending draft research reports to subject companies; however, it should be
presumed that the analyst(s) who authored this report has had discussions with the subject company to ensure factual accuracy prior to publication,
and has had assistance from the company in conducting diligence, including visits to company sites and meetings with company management and
other representatives.
Notice to customers: This material is not directed to, or intended for distribution to or use by, any person or entity if Piper Jaffray is prohibited or
restricted by any legislation or regulation in any jurisdiction from making it available to such person or entity. Customers in any of the jurisdictions
where Piper Jaffray and its affiliates do business who wish to effect a transaction in the securities discussed in this report should contact their local
Piper Jaffray representative. Europe: This material is for the use of intended recipients only and only for distribution to professional and institutional
investors, i.e. persons who are authorised persons or exempted persons within the meaning of the Financial Services and Markets Act 2000 of
the United Kingdom, or persons who have been categorised by Piper Jaffray Ltd. as professional clients under the rules of the Financial Conduct
Authority. United States: This report is distributed in the United States by Piper Jaffray & Co., member SIPC, FINRA and NYSE, Inc., which accepts
responsibility for its contents. The securities described in this report may not have been registered under the U.S. Securities Act of 1933 and, in such
case, may not be offered or sold in the United States or to U.S. persons unless they have been so registered, or an exemption from the registration
requirements is available.
This report is produced for the use of Piper Jaffray customers and may not be reproduced, re-distributed or passed to any other person or published
in whole or in part for any purpose without the prior consent of Piper Jaffray & Co. Additional information is available upon request.
Copyright 2014 Piper Jaffray. All rights reserved.
Page 6 of 6Yelp, Inc.