2014 Auto Liability Trends
•
0 gostou•3,426 visualizações

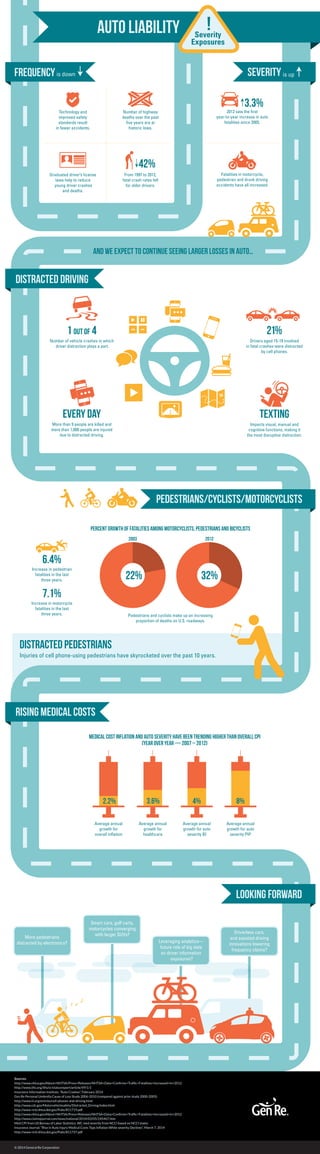
Auto liability claims have taken an interesting turn. The headlining trend: frequency has fallen and should continue to fall. Meanwhile, auto severity has increased on the back of rising medical costs. Between 2007 and 2012 auto severity grew at a faster rate than economic inflation for the same period. View three highlighting trends (including distracted driving) in this infographic. Read the full blog post here: http://www.genre.com/knowledge/blog/whats-driving-larger-auto-liability-losses.html
Recomendados

Recomendados
Mais conteúdo relacionado
Mais procurados
Mais procurados (20)
Semelhante a 2014 Auto Liability Trends
Semelhante a 2014 Auto Liability Trends (20)
Mais de Gen Re
Mais de Gen Re (20)
Último
Último (20)
2014 Auto Liability Trends
- 1. Sources: http://www.nhtsa.gov/About+NHTSA/Press+Releases/NHTSA+Data+Confirms+Traffic+Fatalities+Increased+In+2012 http://www.iihs.org/iihs/sr/statusreport/article/49/1/1 Insurance Information Institute, “Auto Crashes”, February 2014 Gen Re Personal Umbrella Cause of Loss Study 2006-2010 (compared against prior study 2000-2005) http://www.iii.org/articles/cell-phones-and-driving.html http://www.cdc.gov/Motorvehiclesafety/Distracted_Driving/index.html http://www-nrd.nhtsa.dot.gov/Pubs/811719.pdf http://www.nhtsa.gov/About+NHTSA/Press+Releases/NHTSA+Data+Confirms+Traffic+Fatalities+Increased+In+2012 http://www.claimsjournal.com/news/national/2014/03/05/245467.htm Med CPI from US Bureau of Labor Statistics, WC med severity from NCCI based on NCCI states Insurance Journal, “Rise in Auto Injury Medical Costs Tops Inflation While severity Declines”, March 7, 2014 http://www-nrd.nhtsa.dot.gov/Pubs/811737.pdf auto liability Distracted pedestrians driving Technology and improved safety standards result in fewer accidents. 2012 saw the first year-to-year increase in auto fatalities since 2005. Fatalities in motorcycle, pedestrian and drunk driving accidents have all increased. Number of highway deaths over the past five years are at historic lows. Graduated driver’s license laws help to reduce young driver crashes and deaths. Percent growth of fatalities among motorcyclists, pedestrians and bicyclists 6.4% Increase in pedestrian fatalities in the last three years. 7.1% Increase in motorcycle fatalities in the last three years. Pedestrians and cyclists make up an increasing proportion of deaths on U.S. roadways. From 1997 to 2012, fatal crash rates fell for older drivers. 3.3% 42% 32%22% 2003 2012 Injuries of cell phone-using pedestrians have skyrocketed over the past 10 years. !Severity Exposures Frequencyis down distracted driving pedestrians/cyclists/motorcyclists rising medical costs looking forward and we expect to continue seeing larger losses in auto… 1 out of 4 Number of vehicle crashes in which driver distraction plays a part. 21% Drivers aged 15-19 involved in fatal crashes were distracted by cell phones. Texting Impacts visual, manual and cognitive functions, making it the most disruptive distraction. every day More than 9 people are killed and more than 1,000 people are injured due to distracted driving. © 2014 General Re Corporation severity is up More pedestrians distracted by electronics? Smart cars, golf carts, motorcycles converging with larger SUVs? Driverless cars, and assisted driving innovations lowering frequency claims? Leveraging analytics— future role of big data on driver information exposures? MEDICAL COST INFLATION AND AUTO SEVERITY HAVE BEEN TRENDING HIGHER THAN OVERALL CPI (YEAR OVER YEAR — 2007 – 2012) Average annual growth for healthcare Average annual growth for overall inflation 3.6%2.2% Average annual growth for auto severity PIP Average annual growth for auto severity BI 8%4%