SlideShare uma empresa Scribd logo
1 de 15
Ishikawa fishbone
diagram
Ishikawa diagram are causal diagrams created by Kaoru
Ishikawa that show the potential causes of a specific event.
Common uses of the Ishikawa diagram are product design and
quality defect prevention to identify potential factors causing
an overall effect. Each cause or reason for imperfection is a
source of variation. Causes are usually grouped into major
categories to identify and classify these sources of variation.
Introduction
This diagram looks like a fish skeleton; the head is the
problem and the causes are connected with the spine;
therefore, many experts call it a fishbone or herringbone
diagram, or Fishikawa, for the same reason.
Since this tool helps you find the cause of the problem,
it got the name cause and effect diagram.
What is fishbone diagram
If you have any problem with your process or product,
you should know the cause before thinking about any
solution.
A fishbone diagram helps you to find the cause of the
problem. It gives you a comprehensive list of causes to
find the root of the problem.
This tool provides you with a better understanding of
the problem and makes sure you don’t just partially
solve a problem.
The fishbone diagram uses a brainstorming technique to
collect the causes and show them graphically.
Sometimes, the most apparent cause turns out to be
minor, and the one that was thought to be minor is
causing the issue. This diagram gives you an
opportunity to think thoroughly about the root cause,
which leads to a healthy and long-lasting resolution.
The fishbone diagram considers all possible causes of a
problem, instead of focusing on the obvious one, and
groups causes to identify the source of the variation.
The defect is shown as the fish's head, facing to the right,
with the causes extending to the left as fishbone; the ribs
branch off the backbone for major causes, with sub-
branches for root-causes, to as many levels as required.
Ishikawa diagrams were popularized in the 1960s by
Kaoru Ishikawa, who pioneered quality management
processes in the Kawasaki shipyards, and in the process
became one of the founding fathers of modern
management.
Overview
The basic concept was first used in the 1920s, and is
considered one of the seven basic tools of quality
control. It is known as a fishbone diagram because of its
shape, similar to the side view of a fish skeleton.
Mazda Motors famously used an Ishikawa diagram in
the development of the Miata (MX5) sports car.
Advantages
•Highly visual brainstorming tool which can spark further examples
of root causes
•Quickly identify if the root cause is found multiple times in the same
or different causal tree
•Allows one to see all causes simultaneously
•Good visualization for presenting issues to stakeholders
Disadvantages
•Complex defects might yield a lot of causes which might become
visually cluttering
•Interrelationships between causes are not easily identifiable.
These following are the steps to draw a cause
and effect diagram:
1.Identify the Problem
2.Identify and Categorize Causes
3.Brainstorm Possible Causes
4.Analyze the Diagram
How to Draw fishbone
•Man / mind power (physical or knowledge work, includes:
kaizens, suggestions)
•Machine (equipment, technology)
•Material (includes raw material, consumables, and
information)
•Method (process)
•Measurement / medium (inspection, environment)
Originating with lean manufacturing and the Toyota Production
System, the 5 Ms is one of the most common frameworks for
root-cause analysis
The 5Ms
•Product (or service)
•Price
•Place
•Promotion
•People (personnel)
•Process
•Physical evidence
•Performance
This common model for identifying crucial attributes for
planning in product marketing is often also used in root-cause
analysis as categories for the Ishikawa diagram
The 8Ps
An alternative used for service industries, uses four
categories of possible cause
•Surroundings
•Suppliers
•Systems
•Skill
The 4Ss
A fishbone diagram is a vital tool in identifying the root
cause of a problem. Although using it is time-
consuming, the benefits are enormous. This tool helps
you remove the root cause of the problem and develop
an understanding among team members. You use the
fishbone diagram with a critical problem because you
cannot spend much time on every small issue.
Summary
Ishikawa fishbone diagram

Mais conteúdo relacionado

Mais procurados

Cause and effect diagram
Cause and effect diagramCause and effect diagram
Cause and effect diagram
Lizzette Danan
 
7 qc tools training material[1]
7 qc tools training material[1]7 qc tools training material[1]
7 qc tools training material[1]
gurmukh singh
 
SIX SIGMA Green Belt Training
SIX SIGMA Green Belt TrainingSIX SIGMA Green Belt Training
SIX SIGMA Green Belt Training
chaudhryshailja
 
8D _ Problem Solving
8D _ Problem Solving 8D _ Problem Solving
8D _ Problem Solving
Senthil kumar
 

Mais procurados (20)

5 why analysis training presentaion
5 why analysis training presentaion5 why analysis training presentaion
5 why analysis training presentaion
 
7 qc tools
7 qc tools7 qc tools
7 qc tools
 
Fish Bone Diagram
Fish Bone DiagramFish Bone Diagram
Fish Bone Diagram
 
5-Why Training
5-Why Training5-Why Training
5-Why Training
 
Root Cause Analysis - Tools, Tips and Tricks to Get to the Bottom of Root Cause
Root Cause Analysis - Tools, Tips and Tricks to Get to the Bottom of Root CauseRoot Cause Analysis - Tools, Tips and Tricks to Get to the Bottom of Root Cause
Root Cause Analysis - Tools, Tips and Tricks to Get to the Bottom of Root Cause
 
Root cause analysis using 5 whys
Root cause analysis using 5 whysRoot cause analysis using 5 whys
Root cause analysis using 5 whys
 
Fishbone diagram and six thinking hats
Fishbone diagram and six thinking hatsFishbone diagram and six thinking hats
Fishbone diagram and six thinking hats
 
7 qc tools
7 qc tools7 qc tools
7 qc tools
 
Cause and effect diagram
Cause and effect diagramCause and effect diagram
Cause and effect diagram
 
7 qc tools training material[1]
7 qc tools training material[1]7 qc tools training material[1]
7 qc tools training material[1]
 
5 why’s technique and cause and effect analysis
5 why’s technique and cause and effect analysis5 why’s technique and cause and effect analysis
5 why’s technique and cause and effect analysis
 
SIX SIGMA Green Belt Training
SIX SIGMA Green Belt TrainingSIX SIGMA Green Belt Training
SIX SIGMA Green Belt Training
 
7QC Tools
7QC Tools7QC Tools
7QC Tools
 
Fish Bone
Fish BoneFish Bone
Fish Bone
 
Visual Management by Operational Excellence Consulting
Visual Management by Operational Excellence ConsultingVisual Management by Operational Excellence Consulting
Visual Management by Operational Excellence Consulting
 
Root Cause Analysis
Root Cause AnalysisRoot Cause Analysis
Root Cause Analysis
 
Root cause analysis 1
Root cause analysis 1Root cause analysis 1
Root cause analysis 1
 
5S Training
5S Training5S Training
5S Training
 
8D _ Problem Solving
8D _ Problem Solving 8D _ Problem Solving
8D _ Problem Solving
 
5 whys
5 whys5 whys
5 whys
 

Semelhante a Ishikawa fishbone diagram

Fishbone analysis (edited)
Fishbone analysis (edited)Fishbone analysis (edited)
Fishbone analysis (edited)
Izzah Ros
 
9 basic seven tools of quality
9 basic seven tools of quality9 basic seven tools of quality
9 basic seven tools of quality
goldenbull268
 

Semelhante a Ishikawa fishbone diagram (20)

Fishbone Diagram.pptx
Fishbone Diagram.pptxFishbone Diagram.pptx
Fishbone Diagram.pptx
 
Ishikawa diagram
Ishikawa diagramIshikawa diagram
Ishikawa diagram
 
Quality improvement tools
Quality improvement tools Quality improvement tools
Quality improvement tools
 
Cause & Effect Diagrams
Cause & Effect DiagramsCause & Effect Diagrams
Cause & Effect Diagrams
 
Fishbone analysis (edited)
Fishbone analysis (edited)Fishbone analysis (edited)
Fishbone analysis (edited)
 
Cause and effect diagram
Cause and effect diagramCause and effect diagram
Cause and effect diagram
 
Cause & Effect Diagrams
Cause & Effect DiagramsCause & Effect Diagrams
Cause & Effect Diagrams
 
Cause & effect diagrams
Cause & effect diagramsCause & effect diagrams
Cause & effect diagrams
 
Cause & effect diagrams
Cause & effect diagramsCause & effect diagrams
Cause & effect diagrams
 
Ishikawa
IshikawaIshikawa
Ishikawa
 
Fish bone examples ppt
Fish bone examples pptFish bone examples ppt
Fish bone examples ppt
 
Dit yvol2iss21
Dit yvol2iss21Dit yvol2iss21
Dit yvol2iss21
 
ABCi Skills for Improvement- Fishbone Diagram
ABCi Skills for Improvement- Fishbone DiagramABCi Skills for Improvement- Fishbone Diagram
ABCi Skills for Improvement- Fishbone Diagram
 
9 basic seven tools of quality
9 basic seven tools of quality9 basic seven tools of quality
9 basic seven tools of quality
 
Fishbone Diagram
Fishbone DiagramFishbone Diagram
Fishbone Diagram
 
Ishikawa .pptx
Ishikawa .pptxIshikawa .pptx
Ishikawa .pptx
 
K10947 Vikas opc
K10947 Vikas opcK10947 Vikas opc
K10947 Vikas opc
 
FISHBONE.pptx
FISHBONE.pptxFISHBONE.pptx
FISHBONE.pptx
 
Fishbone diagam guide
Fishbone diagam guideFishbone diagam guide
Fishbone diagam guide
 
Cause & Effect Diagram.pdf
Cause & Effect Diagram.pdfCause & Effect Diagram.pdf
Cause & Effect Diagram.pdf
 

Mais de garvsuthar

Mais de garvsuthar (20)

Tetralogy of fallot
Tetralogy of fallotTetralogy of fallot
Tetralogy of fallot
 
Skin care medical
Skin care medicalSkin care medical
Skin care medical
 
Depression psychiatry
Depression psychiatryDepression psychiatry
Depression psychiatry
 
Bipolar disorder
Bipolar disorderBipolar disorder
Bipolar disorder
 
Arterial hypertension
Arterial hypertensionArterial hypertension
Arterial hypertension
 
Cerebro Spinal Fluid
Cerebro Spinal FluidCerebro Spinal Fluid
Cerebro Spinal Fluid
 
Small intestine surgery
Small intestine surgerySmall intestine surgery
Small intestine surgery
 
The pancrease
The pancrease The pancrease
The pancrease
 
Coronary artery disease
Coronary artery diseaseCoronary artery disease
Coronary artery disease
 
Ovarian cancer
Ovarian cancerOvarian cancer
Ovarian cancer
 
Ectopic pregnancy
Ectopic pregnancyEctopic pregnancy
Ectopic pregnancy
 
Asthma
AsthmaAsthma
Asthma
 
Chromosomal disorders
Chromosomal disordersChromosomal disorders
Chromosomal disorders
 
Realism
RealismRealism
Realism
 
Protein
ProteinProtein
Protein
 
Materlism
MaterlismMaterlism
Materlism
 
Krebs cycle
Krebs cycleKrebs cycle
Krebs cycle
 
Idealism
IdealismIdealism
Idealism
 
Health promotion
Health promotionHealth promotion
Health promotion
 
Health promotion & education
Health promotion & educationHealth promotion & education
Health promotion & education
 

Último

The basics of sentences session 3pptx.pptx
The basics of sentences session 3pptx.pptxThe basics of sentences session 3pptx.pptx
The basics of sentences session 3pptx.pptx
heathfieldcps1
 
Salient Features of India constitution especially power and functions
Salient Features of India constitution especially power and functionsSalient Features of India constitution especially power and functions
Salient Features of India constitution especially power and functions
KarakKing
 

Último (20)

This PowerPoint helps students to consider the concept of infinity.
This PowerPoint helps students to consider the concept of infinity.This PowerPoint helps students to consider the concept of infinity.
This PowerPoint helps students to consider the concept of infinity.
 
HMCS Max Bernays Pre-Deployment Brief (May 2024).pptx
HMCS Max Bernays Pre-Deployment Brief (May 2024).pptxHMCS Max Bernays Pre-Deployment Brief (May 2024).pptx
HMCS Max Bernays Pre-Deployment Brief (May 2024).pptx
 
The basics of sentences session 3pptx.pptx
The basics of sentences session 3pptx.pptxThe basics of sentences session 3pptx.pptx
The basics of sentences session 3pptx.pptx
 
Fostering Friendships - Enhancing Social Bonds in the Classroom
Fostering Friendships - Enhancing Social Bonds  in the ClassroomFostering Friendships - Enhancing Social Bonds  in the Classroom
Fostering Friendships - Enhancing Social Bonds in the Classroom
 
On_Translating_a_Tamil_Poem_by_A_K_Ramanujan.pptx
On_Translating_a_Tamil_Poem_by_A_K_Ramanujan.pptxOn_Translating_a_Tamil_Poem_by_A_K_Ramanujan.pptx
On_Translating_a_Tamil_Poem_by_A_K_Ramanujan.pptx
 
80 ĐỀ THI THỬ TUYỂN SINH TIẾNG ANH VÀO 10 SỞ GD – ĐT THÀNH PHỐ HỒ CHÍ MINH NĂ...
80 ĐỀ THI THỬ TUYỂN SINH TIẾNG ANH VÀO 10 SỞ GD – ĐT THÀNH PHỐ HỒ CHÍ MINH NĂ...80 ĐỀ THI THỬ TUYỂN SINH TIẾNG ANH VÀO 10 SỞ GD – ĐT THÀNH PHỐ HỒ CHÍ MINH NĂ...
80 ĐỀ THI THỬ TUYỂN SINH TIẾNG ANH VÀO 10 SỞ GD – ĐT THÀNH PHỐ HỒ CHÍ MINH NĂ...
 
Towards a code of practice for AI in AT.pptx
Towards a code of practice for AI in AT.pptxTowards a code of practice for AI in AT.pptx
Towards a code of practice for AI in AT.pptx
 
TỔNG ÔN TẬP THI VÀO LỚP 10 MÔN TIẾNG ANH NĂM HỌC 2023 - 2024 CÓ ĐÁP ÁN (NGỮ Â...
TỔNG ÔN TẬP THI VÀO LỚP 10 MÔN TIẾNG ANH NĂM HỌC 2023 - 2024 CÓ ĐÁP ÁN (NGỮ Â...TỔNG ÔN TẬP THI VÀO LỚP 10 MÔN TIẾNG ANH NĂM HỌC 2023 - 2024 CÓ ĐÁP ÁN (NGỮ Â...
TỔNG ÔN TẬP THI VÀO LỚP 10 MÔN TIẾNG ANH NĂM HỌC 2023 - 2024 CÓ ĐÁP ÁN (NGỮ Â...
 
Wellbeing inclusion and digital dystopias.pptx
Wellbeing inclusion and digital dystopias.pptxWellbeing inclusion and digital dystopias.pptx
Wellbeing inclusion and digital dystopias.pptx
 
Sensory_Experience_and_Emotional_Resonance_in_Gabriel_Okaras_The_Piano_and_Th...
Sensory_Experience_and_Emotional_Resonance_in_Gabriel_Okaras_The_Piano_and_Th...Sensory_Experience_and_Emotional_Resonance_in_Gabriel_Okaras_The_Piano_and_Th...
Sensory_Experience_and_Emotional_Resonance_in_Gabriel_Okaras_The_Piano_and_Th...
 
Unit 3 Emotional Intelligence and Spiritual Intelligence.pdf
Unit 3 Emotional Intelligence and Spiritual Intelligence.pdfUnit 3 Emotional Intelligence and Spiritual Intelligence.pdf
Unit 3 Emotional Intelligence and Spiritual Intelligence.pdf
 
Python Notes for mca i year students osmania university.docx
Python Notes for mca i year students osmania university.docxPython Notes for mca i year students osmania university.docx
Python Notes for mca i year students osmania university.docx
 
How to Add New Custom Addons Path in Odoo 17
How to Add New Custom Addons Path in Odoo 17How to Add New Custom Addons Path in Odoo 17
How to Add New Custom Addons Path in Odoo 17
 
Exploring_the_Narrative_Style_of_Amitav_Ghoshs_Gun_Island.pptx
Exploring_the_Narrative_Style_of_Amitav_Ghoshs_Gun_Island.pptxExploring_the_Narrative_Style_of_Amitav_Ghoshs_Gun_Island.pptx
Exploring_the_Narrative_Style_of_Amitav_Ghoshs_Gun_Island.pptx
 
COMMUNICATING NEGATIVE NEWS - APPROACHES .pptx
COMMUNICATING NEGATIVE NEWS - APPROACHES .pptxCOMMUNICATING NEGATIVE NEWS - APPROACHES .pptx
COMMUNICATING NEGATIVE NEWS - APPROACHES .pptx
 
REMIFENTANIL: An Ultra short acting opioid.pptx
REMIFENTANIL: An Ultra short acting opioid.pptxREMIFENTANIL: An Ultra short acting opioid.pptx
REMIFENTANIL: An Ultra short acting opioid.pptx
 
Accessible Digital Futures project (20/03/2024)
Accessible Digital Futures project (20/03/2024)Accessible Digital Futures project (20/03/2024)
Accessible Digital Futures project (20/03/2024)
 
Jamworks pilot and AI at Jisc (20/03/2024)
Jamworks pilot and AI at Jisc (20/03/2024)Jamworks pilot and AI at Jisc (20/03/2024)
Jamworks pilot and AI at Jisc (20/03/2024)
 
UGC NET Paper 1 Mathematical Reasoning & Aptitude.pdf
UGC NET Paper 1 Mathematical Reasoning & Aptitude.pdfUGC NET Paper 1 Mathematical Reasoning & Aptitude.pdf
UGC NET Paper 1 Mathematical Reasoning & Aptitude.pdf
 
Salient Features of India constitution especially power and functions
Salient Features of India constitution especially power and functionsSalient Features of India constitution especially power and functions
Salient Features of India constitution especially power and functions
 

Ishikawa fishbone diagram

  • 2. Ishikawa diagram are causal diagrams created by Kaoru Ishikawa that show the potential causes of a specific event. Common uses of the Ishikawa diagram are product design and quality defect prevention to identify potential factors causing an overall effect. Each cause or reason for imperfection is a source of variation. Causes are usually grouped into major categories to identify and classify these sources of variation. Introduction
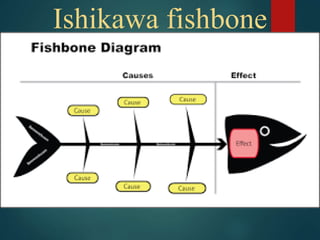
  • 3. This diagram looks like a fish skeleton; the head is the problem and the causes are connected with the spine; therefore, many experts call it a fishbone or herringbone diagram, or Fishikawa, for the same reason. Since this tool helps you find the cause of the problem, it got the name cause and effect diagram.
  • 4. What is fishbone diagram If you have any problem with your process or product, you should know the cause before thinking about any solution. A fishbone diagram helps you to find the cause of the problem. It gives you a comprehensive list of causes to find the root of the problem. This tool provides you with a better understanding of the problem and makes sure you don’t just partially solve a problem.
  • 5. The fishbone diagram uses a brainstorming technique to collect the causes and show them graphically. Sometimes, the most apparent cause turns out to be minor, and the one that was thought to be minor is causing the issue. This diagram gives you an opportunity to think thoroughly about the root cause, which leads to a healthy and long-lasting resolution. The fishbone diagram considers all possible causes of a problem, instead of focusing on the obvious one, and groups causes to identify the source of the variation.
  • 6. The defect is shown as the fish's head, facing to the right, with the causes extending to the left as fishbone; the ribs branch off the backbone for major causes, with sub- branches for root-causes, to as many levels as required. Ishikawa diagrams were popularized in the 1960s by Kaoru Ishikawa, who pioneered quality management processes in the Kawasaki shipyards, and in the process became one of the founding fathers of modern management. Overview
  • 7. The basic concept was first used in the 1920s, and is considered one of the seven basic tools of quality control. It is known as a fishbone diagram because of its shape, similar to the side view of a fish skeleton. Mazda Motors famously used an Ishikawa diagram in the development of the Miata (MX5) sports car.
  • 8. Advantages •Highly visual brainstorming tool which can spark further examples of root causes •Quickly identify if the root cause is found multiple times in the same or different causal tree •Allows one to see all causes simultaneously •Good visualization for presenting issues to stakeholders Disadvantages •Complex defects might yield a lot of causes which might become visually cluttering •Interrelationships between causes are not easily identifiable.
  • 9. These following are the steps to draw a cause and effect diagram: 1.Identify the Problem 2.Identify and Categorize Causes 3.Brainstorm Possible Causes 4.Analyze the Diagram How to Draw fishbone
  • 10.
  • 11. •Man / mind power (physical or knowledge work, includes: kaizens, suggestions) •Machine (equipment, technology) •Material (includes raw material, consumables, and information) •Method (process) •Measurement / medium (inspection, environment) Originating with lean manufacturing and the Toyota Production System, the 5 Ms is one of the most common frameworks for root-cause analysis The 5Ms
  • 12. •Product (or service) •Price •Place •Promotion •People (personnel) •Process •Physical evidence •Performance This common model for identifying crucial attributes for planning in product marketing is often also used in root-cause analysis as categories for the Ishikawa diagram The 8Ps
  • 13. An alternative used for service industries, uses four categories of possible cause •Surroundings •Suppliers •Systems •Skill The 4Ss
  • 14. A fishbone diagram is a vital tool in identifying the root cause of a problem. Although using it is time- consuming, the benefits are enormous. This tool helps you remove the root cause of the problem and develop an understanding among team members. You use the fishbone diagram with a critical problem because you cannot spend much time on every small issue. Summary