SlideShare uma empresa Scribd logo
1 de 56
Japan’s Present = US Future?
To figure out where the US is heading in terms of economic & demographic growth,
and Government policies it is informative to look at the contemporary situation in
Japan. At times, the relevant trends do appear to converge with a lag (US lagging
behind Japan).
In other areas such as health and education, the two countries are very divergent.
Gaetan Lion, November 16, 2021
Demographic section
2
Notice that both countries’
fertility rate has been much
below replacement rate (green
line at 2.1 child per woman) for
several years for the US and
several decades for Japan.
The US fertility rate at 1.71 in
2019 is very close to Japan at
1.72 back in 1986.
Japan’s fertility rate in 2019 is
1.36.
The US fertility rate has dropped
from 2.12 in 2007 to 1.71 in 2019.
If current trend continues, the
U.S. fertility rate could very well
reach Japan’s current level within
a couple of decades.
Source: World Bank
3
US
Japan
The US population growth rate in 2020 based
on a 10 year CAGR was 0.8%; the same as
Japan was in 1985.
Japan’s population growth rate, as specified,
was flat starting in 2012 and became negative
in 2016.
The US population growth rate, as specified
was 1.6% in 2001 and 0.8% in 2020.
Source: World Bank
4
US
Japan
Old Age Dependency Ratio (> 64/15-64)
5
Japan’s society has aged very rapidly since the early 1980s. The US appears to be on a similar aging path around
2010. And, the US aging trend as defined by this Old Age Dependency Ratio is accelerating. By mid- or late-
century, the US Old Age Dependency Ratio may well approach Japan’s current levels.
Japan
US
Gray areas denote US recessions
Age Dependency Ratio ( < 15 + > 64)/(15 – 64)
6
The current Age Dependency Ratio (< 15 + > 64)/(15 – 64) is around 55% for the US and 70% for Japan. The US mentioned
ratio is expected to reach Japan’s current level by 2070, according to the United Nations – Population Division.
US
Japan
7
Population by Age Group
Looking at population by age group over time, the US population age group mix in 2020 is similar to Japan’s in mid 90s (red
vertical dashed line) . Japan’s population aging after the mid 90s accelerated (mixture of rising life span, declining fertility
rate). We can expect the US population to continue aging, but not as rapidly as Japan because of declining US health trends
(rising BMI, etc.) and the US higher net immigration rate.
US Japan
Life Expectancy
8
Japan
US
In 1965, both countries had a life expectancy of 70 years. By 2019, Japan’s life expectancy had risen to 84.35
years and the US to 78.78 years (same as Japan in 1989).
Gray areas denote US recessions
Population growth projections
9
Japan
US
Population projections reflect the impact of ongoing population aging, lower fertility rates, and differential in net migration
rates. In 2020, Japan’s population has already peaked and is starting to decline. Notice the already very rapid decline in
Japan’s youth population (< 15, and < 5). For the US, the slow down in population growth is not that pronounced. Out to
2100, the US population is still expecting to continue rising, albeit at a much lower speed. Notice the rather flat trend in US
youth population growth.
Net migration
10
Japan
US
The main reason the US population growth is not slowing down as rapidly as Japan’s is the US far higher net migration. Net
migration to the US amounts to around 5 million individuals coming into the country every year vs only 500,000 for Japan.
This corresponds to a boost in yearly population growth of about 1.5% for the US vs. only 0.4% for Japan.
Gray areas denote US recessions
11
Population growth is result of fertility rate
and net migration rate
Combining a fertility rate of 1.4 with a net positive migration
per annum of 0.5%, assuming a generation has a length of 30
years, results in a yearly change in population of – 0.8%. That
is pretty much where Japan is heading (red cell). The US
situation is associated with a fertility rate of 1.7 with a net
positive migration of 1.5% resulting in a yearly change in
population of + 0.8%.
If we assume the generation length to be 25 years. The
mentioned yearly change in population decreases to – 1.1%
for Japan and + 0.6% for the US.
This framework pretty much explains the respective
population projections shown earlier.
Economics section
12
The explanatory commentary for this slide is very
similar to the one on the previous slide.
The main difference is that the US economic growth
is still quite a bit faster than Japan’s. And, this is due
to the US population growth rate being higher than
Japan’s because of the the US much higher positive
net immigration.
As the US population growth rate keeps on
declining, its economic growth rate will also decline.
However, it may always lag behind the steeper
decline in Japan’s economic growth rate.
13
Source: World Bank, OECD
Japan
US
14
US
Japan
Investment/GDP
15
The two measures are not entirely comparable. And, the data for Japan was unavailable after 2010. Over the reviewed
years, accepting the data caveats it appears that Japan’s investment to GDP was much higher than in the US. I
understand that in more recent years, this gap has narrowed materially.
US
Japan
Gray areas denote US recessions
16
US
Japan
17
US
Japan
Growth rate of real
GDP per employed
person is again
different between the
two countries. Over
the reviewed period,
the Japanese measure
is far more volatile.
It is not unlikely that in
the near future, the
two countries will
converge somewhat
on such measures.
Labor Productivity
18
Japan
US
The two countries’ respective changes in labor productivity are different. At times, the two time series seem
negatively correlated. Nevertheless, notice how during US recessions (gray areas), Japan’s labor productivity drops a
lot more than the US. This is especially the case during the three most recent recessions.
Gray areas denote US recessions
19
US
Japan
Source: World Bank, OECD
Both countries have experienced a long term decline in
constant GDP per capita growth rate.
Japan’s decline has been more pronounced because in
the early years, Japan was still in a post WWII catch-up
economic boom mode, which phased out over time.
Additionally, Japan experienced the pop of the Japan’s
Bubble (stock market and real estate) in the late 1980s
to early 1990s which further accelerated the decline in
constant GDP per capita growth rate.
As shown, the current respective growth rates of both
countries have already converged much after the Great
Recession. The US mentioned growth rate is only
marginally higher than Japan’s.
20
US
Japan
21
Source: International Federation of Robotics
Japan is one of the World leaders in robotization. Notice
that its number of robots installed per 10,000 employees is
close to 60% greater than in the US.
Between 217 and 2019, Japan has increased its robot
installation by 18% compared to 14% for the US.
Robotization is a viable way for Japan to partly overcome its
prospective decline in labor force over the next several
decades. And, it may contribute to Japan’s GDP per capita
growth.
RGDP & RGDP p.c. CAGR forecasts over 2020 – 2060
22
US GDP is anticipated to grow much faster than
Japan because of much faster population
growth due to its higher net migration rate that
compensates for a fertility rate much below
replacement rate.
When scaling economic growth on a per capita
basis, Japan is expected to grow faster than the
US. This is due to Japan’s decreasing population
(lowering the denominator) and potentially its
higher level of robotization.
Monetary policy section
23
24
The Federal Reserve Bank Quantitative Easing (QE)
activity whereby the Fed buys a huge amount of
securities (Treasuries, MBS) to inject liquidity in the
financial system, lower long term interest rates, and
stimulate the economy is a very recent phenomenon.
Between 1970 and the early 2000s, the Fed had
managed the economy without any QE activity. And,
the Fed’s balance sheet remained steadily between
5% to 7% of GDP (upper chart). Over this period, the
US economy had experienced numerous severe
downturns associated with several oil shocks,
stagflation, Y2K, etc. (see lower chart gray areas).
Starting with the Great Recession in late 2007, the
Fed implemented massive QE activity on an
unprecedented scale. During the Great Recession,
the mentioned QE activities caused the Fed’s balance
sheet to nearly triple from just above 5% to over 15%
of GDP. During the COVID Recession, the Fed
abruptly increased its balance sheet (through QE
activities) from 20% to over 35% of GDP.
Gray areas denote US recessions
QE Activity. Japan vs. US
25
Source: FRED, Federal Reserve, Bank of Japan
The Bank of Japan (BOJ) was a pioneer in
mounting huge QE activities. The BOJ assets
level already represented over 15% of GDP
back in 1998. The US Federal Reserve will
only reach that level in early 2009 during the
Great Recession.
Within the US, the recent bump up to 35% of
GDP during the COVID Recession seemed like
a giant leap. However, this QE effort is
dwarfed by the ongoing BOJ QE activities
mounted since the Great Recession. BOJ
assets currently represent a staggering 132%
of GDP vs. 34% for the US Fed.
Japan
US
Central Bank Policy Rate
26
Japan
US
The BOJ was also a pioneer in setting policy interest rates close to 0%. They have been at that level since 1995. The Fed only
implemented such low rates in 2009 during the Great Recession.
Gray areas denote US recessions
Monetary policy considerations
27
The Federal Reserve QE interventions have reached ever rising and unprecedented scale since the Great
Recession. Yet, their respective scale appears diminutive vs. Japan.
Nevertheless, the Japan ongoing very large QE efforts have not contributed to inflation. The most recent
figures indicate that Japan’s inflation has remained pretty much flat over the past 12 months at + 0.2%.
Meanwhile, in the US inflation has surged by 6.2% over the same period (Source: The Economist issue of
November 13th – 19th, 2021).
Fiscal policy section
28
US Budget Deficit as % of GDP
29
Gray areas denote US recessions
Since the aftermath of the Dot.com Bubble recession in the early 2000s, the following recessions have steadily resulted
in massive increase in fiscal stimulus associated with ever larger Budget Deficits (as a % of GDP).
Budget Deficit comparison: Japan vs. US
30
Japan
US
Gray areas denote US recessions
Even though the Japanese data is incomplete, it again denotes that Japanese fiscal stimulus undertaking have often been far
larger than the US.
Central Government Debt/GDP
31
US
Japan
Source: IMF
The two countries had the same level
of Central Government Debt/GDP in
the early 1990s. Since then, Japan’s
ratio has more than tripled to 200%.
Meanwhile, the US more than
doubled from just above 40% before
the Great Recession to over 90% in
2019. My understanding is that most
recent US data would indicate that
this ratio is now much above 100%.
32
General Government Debt/GDP
Japan
US
Source: IMF
Directionally, same comment as
on the previous slide.
Notice that the most recent data
disclosed by the IMF is as of
2019. If updated to 2021, both
ratios would be substantially
higher.
Fiscal policy considerations
33
Since the Great Recession, the US Government has embarked on an ever rapidly increasing debt
leveraging with increasing Budget Deficits even during economic expansions (relative to earlier
expansions), resulting in ever increasing Public Debt/GDP.
Given current legislation passed regarding ongoing fiscal stimuli in the $trillions, both ongoing Budget
Deficits and Public Debt/GDP ratios are likely to continue rising rapidly over the next few years.
However, when we compare the US public debt leveraging with Japan, the former is dwarfed by the
latter.
Nevertheless, the Japan ongoing very large fiscal stimulus and debt leveraging has not contributed to
inflation. The most recent figures indicate that Japan’s inflation has remained pretty much flat over
the past 12 months at + 0.2%. Meanwhile, in the US inflation has surged by 6.2% over the same
period (Source: The Economist issue of November 13th – 19th, 2021).
Health section
34
35
Source: OECD
US
$10,900 per year
Japan
$4,700 per year
36
Source: OECD
Japan
11% of GDP
US
16.8% of GDP
37
Source: OECD
Japan
$810
US
$1,380
38
BMI = > 25
Japan 27.5%
US 73%
Source: OECD
39
Obesity rate among adults:
Japan 3.7%
US 38.2%
40
Source: OECD
Japan
16 days at hospital
US
5.5 days at hospital
41
42
The US costs are inflated
because they include cost
of hospital, administrative,
physician, and diagnostic
procedure.
Meanwhile for the other
countries, the costs only
include the cost of the
procedure.
But, even if we multiplied
Japan’s costs as specified
by 4 times, in most cases,
they still would be a lot
lower than the US ones.
43
Source: Fropky.com
US consumption of soft drink p.c. = 10 x Japan’s!
44
Source: Fropky.com
US TV watching is more than 2 x Japan’s.
45
Source: Fropky.com, daitips.com
School year: 210 days School year: 180 days
* World Data sources: the intelligence quotients by countries are taken from the studies conducted by Richard Lynn and Tatu Vanhanen
(2002), Heiner Rindermann (2007), Khaleefa and Lynn (2008), Ahmad, Khanum and Riaz (2008), Lynn, Abdalla and Al-Shahomee (2008), Lynn
and Meisenberg (2010), as well as the PISA tests in 2003, 2006, and 2009. More recent results were weighted higher.
46
Obesity Rate
Japan 3.7%
US 38.2%
Life Expectancy
Japan 84.4
US 78.8
Health Care Cost
Japan 11% of GDP
US 16.8% of GDP
An intriguing Causal Model
Causal
variable
Causal
variable
School Year
Japan 210 days
US 180 days
Causal variable
RGDP p.c. forecast
Japan 1.8%
US 1.4%
Health considerations
47
It is unclear how the US could ever bridge the vast difference in lifestyle, nutrition,
overall health status, and life expectancy with Japan. In combination those factors
contribute directly to much higher health care costs for the US relative to Japan.
Additionally, health care costs in the US are further boosted by malpractice
liabilities, for profit industry structure, and ill conceived regulations (i.e. US
Medicare not allowed to negotiate lower drug prices).
Education section
48
49
Program for International Student
Assessment (PISA)
(15 years old)
Japan
US
Japan
Japan
US
US
Over time, reading scores between Japan and
the US are not so far apart. Japan’s are just a
lot more volatile.
On the other hand, in both math and science,
Japan performs well above the US and the
OECD average. Meanwhile, the US is below
the OECD average in math, and just about at
the OECD average in science.
Regarding those PISA country scores, one
could advance the respective average IQ of
the countries plays a role. As we will see in
the following slides, the standard deviation of
IQ may be an underlying confounding variable
that is also influential on the shown
outcomes.
50
Source: American Institute of Physics, National Science Board
Japan
US
These figures should be
adjusted for respective
countries’ population size.
Nevertheless, we can see that
over the reviewed period, the
US is experiencing a reasonably
rapid upward trend from 500K
to around 750K degrees.
Meanwhile, Japan’s trend is
actually slightly downward.
Adjusted for population size,
Japan’s figures would still be
higher than the US. But, if
current trends continue, it
would not be the case for long.
51
Source: American Institute of Physics, National Science Board
US total
US temporary visa
US citizens and permanent residents
Japan
Even if we adjusted the
figures for population size,
the US (during most recent
years) would be faring better
than Japan on this one
count.
52
Source: American Institute of Physics, National Science Board
On this count to, the US is
faring well relative to Japan.
Remember the consideration
between average IQ and its
standard deviation. It seems
to be playing out here.
53
Source: The Center for World
University Ranking (CWUR),
2021- 2022 edition
Among the top 20
universities in the
World:
US 16
Japan 1
54
Source: The Center for World University Ranking (CWUR), 2021- 2022 edition
Among top 10 universities in Japan, only 2 are in the top 50 in the World.
Top 10 universities in Japan
55
The top 10 universities in US all rank among the top 12 in the World.
Source: The Center for World University Ranking (CWUR), 2021- 2022 edition
Top 10 universities in US
Education considerations
56
Japan’s primary education performance is far superior to the US, and is likely to remain
so. The US primary school system is unlikely to ever bridge the gap in school year-days
(180 in US vs. 210 in Japan). Also, qualitative factors we have not explored like rigor in
math and science curricula are likely to remain a differentiating factor between the two
countries.
At the university level, it appears the roles are reversed with top US universities being far
superior to Japanese ones. And, the US comparing favorably in the number of university
degrees conferred in science and engineering, and in the number of publications within
those same fields.
It seems like an ideal education path would be for one to grow up in Japan to get a world
class primary education. And, then to emigrate to the US to go to university. Apparently,
many top Asian students (Japan, China, India) follow a similar path. And, they contribute
to the number of science and engineering degrees and published articles in the US.

Mais conteĂșdo relacionado

Mais procurados

Perspectives on Global and Spanish Economy Q3-2018 Circulo de Empresarios
Perspectives on Global and Spanish Economy Q3-2018 Circulo de EmpresariosPerspectives on Global and Spanish Economy Q3-2018 Circulo de Empresarios
Perspectives on Global and Spanish Economy Q3-2018 Circulo de EmpresariosCĂ­rculo de Empresarios
 
Saez U Stopincomes 2007
Saez U Stopincomes 2007Saez U Stopincomes 2007
Saez U Stopincomes 2007Breaking news
 
Individual College Fed Challenge Paper
Individual College Fed Challenge PaperIndividual College Fed Challenge Paper
Individual College Fed Challenge PaperFeras Zarea
 
High uncertainty weighing on global growth OECD interim economic outlook pres...
High uncertainty weighing on global growth OECD interim economic outlook pres...High uncertainty weighing on global growth OECD interim economic outlook pres...
High uncertainty weighing on global growth OECD interim economic outlook pres...OECD, Economics Department
 
Quarterly Economic Update from Cornerstone Wealth Management.
Quarterly Economic Update from Cornerstone Wealth Management.Quarterly Economic Update from Cornerstone Wealth Management.
Quarterly Economic Update from Cornerstone Wealth Management.Cornerstone Wealth Management MWP
 
Adecco Job Market Perspective 2009
Adecco Job Market Perspective 2009Adecco Job Market Perspective 2009
Adecco Job Market Perspective 2009hakie101
 
Vertex annual state of the construction industry presentation 2018
Vertex annual state of the construction industry presentation   2018Vertex annual state of the construction industry presentation   2018
Vertex annual state of the construction industry presentation 2018The Vertex Companies, LLC
 
VERTEX Annual State of the Construction Industry 2018
VERTEX Annual State of the Construction Industry 2018VERTEX Annual State of the Construction Industry 2018
VERTEX Annual State of the Construction Industry 2018The Vertex Companies, LLC
 
Taking a long view
Taking a long viewTaking a long view
Taking a long viewWesley Fogel
 
Economic Outlook 2016
Economic Outlook 2016Economic Outlook 2016
Economic Outlook 2016Bizcover
 
Macro themes 2020
Macro themes 2020Macro themes 2020
Macro themes 2020Amir Khan
 
2018 Global Outlook Webinar
2018 Global Outlook Webinar2018 Global Outlook Webinar
2018 Global Outlook WebinarDun & Bradstreet
 
Deloitte - Global Economic Outlook 2015
Deloitte - Global Economic Outlook 2015Deloitte - Global Economic Outlook 2015
Deloitte - Global Economic Outlook 2015SYGroup
 
Quarterly Report Perspectives Spanish and Global Economy Q3-2020
Quarterly Report Perspectives Spanish and Global Economy Q3-2020Quarterly Report Perspectives Spanish and Global Economy Q3-2020
Quarterly Report Perspectives Spanish and Global Economy Q3-2020CĂ­rculo de Empresarios
 
Advance G20 release of OECD Economic Outlook
Advance G20 release of OECD Economic OutlookAdvance G20 release of OECD Economic Outlook
Advance G20 release of OECD Economic OutlookOECD, Economics Department
 
Market Outlook- 2019
Market Outlook- 2019Market Outlook- 2019
Market Outlook- 2019Shreya Gulati
 
Quarterly Update - June 2009
Quarterly Update - June 2009Quarterly Update - June 2009
Quarterly Update - June 2009Peter Ho
 

Mais procurados (20)

Perspectives on Global and Spanish Economy Q3-2018 Circulo de Empresarios
Perspectives on Global and Spanish Economy Q3-2018 Circulo de EmpresariosPerspectives on Global and Spanish Economy Q3-2018 Circulo de Empresarios
Perspectives on Global and Spanish Economy Q3-2018 Circulo de Empresarios
 
Saez U Stopincomes 2007
Saez U Stopincomes 2007Saez U Stopincomes 2007
Saez U Stopincomes 2007
 
Individual College Fed Challenge Paper
Individual College Fed Challenge PaperIndividual College Fed Challenge Paper
Individual College Fed Challenge Paper
 
High uncertainty weighing on global growth OECD interim economic outlook pres...
High uncertainty weighing on global growth OECD interim economic outlook pres...High uncertainty weighing on global growth OECD interim economic outlook pres...
High uncertainty weighing on global growth OECD interim economic outlook pres...
 
Quarterly Economic Update from Cornerstone Wealth Management.
Quarterly Economic Update from Cornerstone Wealth Management.Quarterly Economic Update from Cornerstone Wealth Management.
Quarterly Economic Update from Cornerstone Wealth Management.
 
Q2-2019 Market Review | Financial Synergies Wealth Advisors
Q2-2019 Market Review | Financial Synergies Wealth AdvisorsQ2-2019 Market Review | Financial Synergies Wealth Advisors
Q2-2019 Market Review | Financial Synergies Wealth Advisors
 
Adecco Job Market Perspective 2009
Adecco Job Market Perspective 2009Adecco Job Market Perspective 2009
Adecco Job Market Perspective 2009
 
Vertex annual state of the construction industry presentation 2018
Vertex annual state of the construction industry presentation   2018Vertex annual state of the construction industry presentation   2018
Vertex annual state of the construction industry presentation 2018
 
VERTEX Annual State of the Construction Industry 2018
VERTEX Annual State of the Construction Industry 2018VERTEX Annual State of the Construction Industry 2018
VERTEX Annual State of the Construction Industry 2018
 
Taking a long view
Taking a long viewTaking a long view
Taking a long view
 
Economic Outlook 2016
Economic Outlook 2016Economic Outlook 2016
Economic Outlook 2016
 
Macro themes 2020
Macro themes 2020Macro themes 2020
Macro themes 2020
 
2018 Global Outlook Webinar
2018 Global Outlook Webinar2018 Global Outlook Webinar
2018 Global Outlook Webinar
 
Deloitte - Global Economic Outlook 2015
Deloitte - Global Economic Outlook 2015Deloitte - Global Economic Outlook 2015
Deloitte - Global Economic Outlook 2015
 
Covid 19- a macroeconomic perspective
Covid 19- a macroeconomic perspectiveCovid 19- a macroeconomic perspective
Covid 19- a macroeconomic perspective
 
Quarterly Report Perspectives Spanish and Global Economy Q3-2020
Quarterly Report Perspectives Spanish and Global Economy Q3-2020Quarterly Report Perspectives Spanish and Global Economy Q3-2020
Quarterly Report Perspectives Spanish and Global Economy Q3-2020
 
Advance G20 release of OECD Economic Outlook
Advance G20 release of OECD Economic OutlookAdvance G20 release of OECD Economic Outlook
Advance G20 release of OECD Economic Outlook
 
Market Outlook- 2019
Market Outlook- 2019Market Outlook- 2019
Market Outlook- 2019
 
Quarterly Update - June 2009
Quarterly Update - June 2009Quarterly Update - June 2009
Quarterly Update - June 2009
 
2015 Year End Outlook
2015 Year End Outlook2015 Year End Outlook
2015 Year End Outlook
 

Semelhante a Japan vs. US comparison on numerous dimensions

Money printing
Money printingMoney printing
Money printinggloriasimmon
 
Lange Lost Decade Fertility
Lange Lost Decade Fertility Lange Lost Decade Fertility
Lange Lost Decade Fertility Mitchel Lange
 
The Leadership Of The Liberal Democratic Party Of Japan
The Leadership Of The Liberal Democratic Party Of JapanThe Leadership Of The Liberal Democratic Party Of Japan
The Leadership Of The Liberal Democratic Party Of JapanKelly Ratkovic
 
Japanese debt crisis
Japanese debt crisisJapanese debt crisis
Japanese debt crisisChirayu Mehta
 
Is japan's ecomomy facing another lost decade or is it ready to boom
Is japan's ecomomy facing another lost decade or is it ready to boomIs japan's ecomomy facing another lost decade or is it ready to boom
Is japan's ecomomy facing another lost decade or is it ready to boomvilord
 
Annual report eng 2015 mhlw jpn
Annual report eng 2015 mhlw jpnAnnual report eng 2015 mhlw jpn
Annual report eng 2015 mhlw jpnGo Tsuyoshi Ota
 
Are Japan's Deflationary Clouds Lifting?
Are Japan's Deflationary Clouds Lifting?Are Japan's Deflationary Clouds Lifting?
Are Japan's Deflationary Clouds Lifting?Tyche Group Ltd
 
Government spends we lose 9.6.10
Government spends we lose 9.6.10Government spends we lose 9.6.10
Government spends we lose 9.6.10lineofsight
 
Is the us economy out of the dark woods.
Is the us economy out of the dark woods.Is the us economy out of the dark woods.
Is the us economy out of the dark woods.Ziad K Abdelnour
 
The Impact of High Government Debt on the Country’s Economic Growth: An Empir...
The Impact of High Government Debt on the Country’s Economic Growth: An Empir...The Impact of High Government Debt on the Country’s Economic Growth: An Empir...
The Impact of High Government Debt on the Country’s Economic Growth: An Empir...Dr. Kelly YiYu Lin
 
Gdp ranked by country 2019
Gdp ranked by country 2019Gdp ranked by country 2019
Gdp ranked by country 2019RiazHussainChandio
 
The demographic dividend
The demographic dividendThe demographic dividend
The demographic dividendTariqCarrimjee
 
Module 2 Lecture - GDP A Measure Of Total Production And Income (.docx
Module 2 Lecture - GDP A Measure Of Total Production And Income (.docxModule 2 Lecture - GDP A Measure Of Total Production And Income (.docx
Module 2 Lecture - GDP A Measure Of Total Production And Income (.docxkendalfarrier
 
Government Spends = We Lose 8.12.09
Government Spends = We Lose 8.12.09Government Spends = We Lose 8.12.09
Government Spends = We Lose 8.12.09ALineofSight
 
The uk economy at a glance (1990 2010)
The uk economy at a glance (1990 2010) The uk economy at a glance (1990 2010)
The uk economy at a glance (1990 2010) Eva Do
 
MEET INDIA
MEET INDIAMEET INDIA
MEET INDIAavidas
 
Balance between GDP and life expectancy
Balance between GDP and life expectancyBalance between GDP and life expectancy
Balance between GDP and life expectancyAaron Cheung
 

Semelhante a Japan vs. US comparison on numerous dimensions (20)

CNN.com - Transcripts
CNN.com - TranscriptsCNN.com - Transcripts
CNN.com - Transcripts
 
Money printing
Money printingMoney printing
Money printing
 
Lange Lost Decade Fertility
Lange Lost Decade Fertility Lange Lost Decade Fertility
Lange Lost Decade Fertility
 
The Leadership Of The Liberal Democratic Party Of Japan
The Leadership Of The Liberal Democratic Party Of JapanThe Leadership Of The Liberal Democratic Party Of Japan
The Leadership Of The Liberal Democratic Party Of Japan
 
Japanese debt crisis
Japanese debt crisisJapanese debt crisis
Japanese debt crisis
 
Is japan's ecomomy facing another lost decade or is it ready to boom
Is japan's ecomomy facing another lost decade or is it ready to boomIs japan's ecomomy facing another lost decade or is it ready to boom
Is japan's ecomomy facing another lost decade or is it ready to boom
 
Annual report eng 2015 mhlw jpn
Annual report eng 2015 mhlw jpnAnnual report eng 2015 mhlw jpn
Annual report eng 2015 mhlw jpn
 
Are Japan's Deflationary Clouds Lifting?
Are Japan's Deflationary Clouds Lifting?Are Japan's Deflationary Clouds Lifting?
Are Japan's Deflationary Clouds Lifting?
 
Government spends we lose 9.6.10
Government spends we lose 9.6.10Government spends we lose 9.6.10
Government spends we lose 9.6.10
 
Economic growth
Economic growthEconomic growth
Economic growth
 
Economic growth
Economic growthEconomic growth
Economic growth
 
Is the us economy out of the dark woods.
Is the us economy out of the dark woods.Is the us economy out of the dark woods.
Is the us economy out of the dark woods.
 
The Impact of High Government Debt on the Country’s Economic Growth: An Empir...
The Impact of High Government Debt on the Country’s Economic Growth: An Empir...The Impact of High Government Debt on the Country’s Economic Growth: An Empir...
The Impact of High Government Debt on the Country’s Economic Growth: An Empir...
 
Gdp ranked by country 2019
Gdp ranked by country 2019Gdp ranked by country 2019
Gdp ranked by country 2019
 
The demographic dividend
The demographic dividendThe demographic dividend
The demographic dividend
 
Module 2 Lecture - GDP A Measure Of Total Production And Income (.docx
Module 2 Lecture - GDP A Measure Of Total Production And Income (.docxModule 2 Lecture - GDP A Measure Of Total Production And Income (.docx
Module 2 Lecture - GDP A Measure Of Total Production And Income (.docx
 
Government Spends = We Lose 8.12.09
Government Spends = We Lose 8.12.09Government Spends = We Lose 8.12.09
Government Spends = We Lose 8.12.09
 
The uk economy at a glance (1990 2010)
The uk economy at a glance (1990 2010) The uk economy at a glance (1990 2010)
The uk economy at a glance (1990 2010)
 
MEET INDIA
MEET INDIAMEET INDIA
MEET INDIA
 
Balance between GDP and life expectancy
Balance between GDP and life expectancyBalance between GDP and life expectancy
Balance between GDP and life expectancy
 

Mais de Gaetan Lion

DRU projections testing.pptx
DRU projections testing.pptxDRU projections testing.pptx
DRU projections testing.pptxGaetan Lion
 
Climate Change in 24 US Cities
Climate Change in 24 US CitiesClimate Change in 24 US Cities
Climate Change in 24 US CitiesGaetan Lion
 
Compact Letter Display (CLD). How it works
Compact Letter Display (CLD).  How it worksCompact Letter Display (CLD).  How it works
Compact Letter Display (CLD). How it worksGaetan Lion
 
CalPERS pensions vs. Social Security
CalPERS pensions vs. Social SecurityCalPERS pensions vs. Social Security
CalPERS pensions vs. Social SecurityGaetan Lion
 
Recessions.pptx
Recessions.pptxRecessions.pptx
Recessions.pptxGaetan Lion
 
Inequality in the United States
Inequality in the United StatesInequality in the United States
Inequality in the United StatesGaetan Lion
 
Housing Price Models
Housing Price ModelsHousing Price Models
Housing Price ModelsGaetan Lion
 
Global Aging.pdf
Global Aging.pdfGlobal Aging.pdf
Global Aging.pdfGaetan Lion
 
Cryptocurrencies as an asset class
Cryptocurrencies as an asset classCryptocurrencies as an asset class
Cryptocurrencies as an asset classGaetan Lion
 
Can you Deep Learn the Stock Market?
Can you Deep Learn the Stock Market?Can you Deep Learn the Stock Market?
Can you Deep Learn the Stock Market?Gaetan Lion
 
Can Treasury Inflation Protected Securities predict Inflation?
Can Treasury Inflation Protected Securities predict Inflation?Can Treasury Inflation Protected Securities predict Inflation?
Can Treasury Inflation Protected Securities predict Inflation?Gaetan Lion
 
How overvalued is the Stock Market?
How overvalued is the Stock Market? How overvalued is the Stock Market?
How overvalued is the Stock Market? Gaetan Lion
 
The relationship between the Stock Market and Interest Rates
The relationship between the Stock Market and Interest RatesThe relationship between the Stock Market and Interest Rates
The relationship between the Stock Market and Interest RatesGaetan Lion
 
Life expectancy
Life expectancyLife expectancy
Life expectancyGaetan Lion
 
Comparing R vs. Python for data visualization
Comparing R vs. Python for data visualizationComparing R vs. Python for data visualization
Comparing R vs. Python for data visualizationGaetan Lion
 
Standardization
StandardizationStandardization
StandardizationGaetan Lion
 
Is Tom Brady the greatest quarterback?
Is Tom Brady the greatest quarterback?Is Tom Brady the greatest quarterback?
Is Tom Brady the greatest quarterback?Gaetan Lion
 
Regularization why you should avoid them
Regularization why you should avoid themRegularization why you should avoid them
Regularization why you should avoid themGaetan Lion
 
Basketball the 3 pt game
Basketball the 3 pt gameBasketball the 3 pt game
Basketball the 3 pt gameGaetan Lion
 
Climate change model forecast global temperature out to 2100
Climate change model forecast global temperature out to 2100Climate change model forecast global temperature out to 2100
Climate change model forecast global temperature out to 2100Gaetan Lion
 

Mais de Gaetan Lion (20)

DRU projections testing.pptx
DRU projections testing.pptxDRU projections testing.pptx
DRU projections testing.pptx
 
Climate Change in 24 US Cities
Climate Change in 24 US CitiesClimate Change in 24 US Cities
Climate Change in 24 US Cities
 
Compact Letter Display (CLD). How it works
Compact Letter Display (CLD).  How it worksCompact Letter Display (CLD).  How it works
Compact Letter Display (CLD). How it works
 
CalPERS pensions vs. Social Security
CalPERS pensions vs. Social SecurityCalPERS pensions vs. Social Security
CalPERS pensions vs. Social Security
 
Recessions.pptx
Recessions.pptxRecessions.pptx
Recessions.pptx
 
Inequality in the United States
Inequality in the United StatesInequality in the United States
Inequality in the United States
 
Housing Price Models
Housing Price ModelsHousing Price Models
Housing Price Models
 
Global Aging.pdf
Global Aging.pdfGlobal Aging.pdf
Global Aging.pdf
 
Cryptocurrencies as an asset class
Cryptocurrencies as an asset classCryptocurrencies as an asset class
Cryptocurrencies as an asset class
 
Can you Deep Learn the Stock Market?
Can you Deep Learn the Stock Market?Can you Deep Learn the Stock Market?
Can you Deep Learn the Stock Market?
 
Can Treasury Inflation Protected Securities predict Inflation?
Can Treasury Inflation Protected Securities predict Inflation?Can Treasury Inflation Protected Securities predict Inflation?
Can Treasury Inflation Protected Securities predict Inflation?
 
How overvalued is the Stock Market?
How overvalued is the Stock Market? How overvalued is the Stock Market?
How overvalued is the Stock Market?
 
The relationship between the Stock Market and Interest Rates
The relationship between the Stock Market and Interest RatesThe relationship between the Stock Market and Interest Rates
The relationship between the Stock Market and Interest Rates
 
Life expectancy
Life expectancyLife expectancy
Life expectancy
 
Comparing R vs. Python for data visualization
Comparing R vs. Python for data visualizationComparing R vs. Python for data visualization
Comparing R vs. Python for data visualization
 
Standardization
StandardizationStandardization
Standardization
 
Is Tom Brady the greatest quarterback?
Is Tom Brady the greatest quarterback?Is Tom Brady the greatest quarterback?
Is Tom Brady the greatest quarterback?
 
Regularization why you should avoid them
Regularization why you should avoid themRegularization why you should avoid them
Regularization why you should avoid them
 
Basketball the 3 pt game
Basketball the 3 pt gameBasketball the 3 pt game
Basketball the 3 pt game
 
Climate change model forecast global temperature out to 2100
Climate change model forecast global temperature out to 2100Climate change model forecast global temperature out to 2100
Climate change model forecast global temperature out to 2100
 

Último

The Economic History of the U.S. Lecture 26.pdf
The Economic History of the U.S. Lecture 26.pdfThe Economic History of the U.S. Lecture 26.pdf
The Economic History of the U.S. Lecture 26.pdfGale Pooley
 
Call US 📞 9892124323 ✅ Kurla Call Girls In Kurla ( Mumbai ) secure service
Call US 📞 9892124323 ✅ Kurla Call Girls In Kurla ( Mumbai ) secure serviceCall US 📞 9892124323 ✅ Kurla Call Girls In Kurla ( Mumbai ) secure service
Call US 📞 9892124323 ✅ Kurla Call Girls In Kurla ( Mumbai ) secure servicePooja Nehwal
 
05_Annelore Lenoir_Docbyte_MeetupDora&Cybersecurity.pptx
05_Annelore Lenoir_Docbyte_MeetupDora&Cybersecurity.pptx05_Annelore Lenoir_Docbyte_MeetupDora&Cybersecurity.pptx
05_Annelore Lenoir_Docbyte_MeetupDora&Cybersecurity.pptxFinTech Belgium
 
Stock Market Brief Deck (Under Pressure).pdf
Stock Market Brief Deck (Under Pressure).pdfStock Market Brief Deck (Under Pressure).pdf
Stock Market Brief Deck (Under Pressure).pdfMichael Silva
 
Indore Real Estate Market Trends Report.pdf
Indore Real Estate Market Trends Report.pdfIndore Real Estate Market Trends Report.pdf
Indore Real Estate Market Trends Report.pdfSaviRakhecha1
 
00_Main ppt_MeetupDORA&CyberSecurity.pptx
00_Main ppt_MeetupDORA&CyberSecurity.pptx00_Main ppt_MeetupDORA&CyberSecurity.pptx
00_Main ppt_MeetupDORA&CyberSecurity.pptxFinTech Belgium
 
(DIYA) Bhumkar Chowk Call Girls Just Call 7001035870 [ Cash on Delivery ] Pun...
(DIYA) Bhumkar Chowk Call Girls Just Call 7001035870 [ Cash on Delivery ] Pun...(DIYA) Bhumkar Chowk Call Girls Just Call 7001035870 [ Cash on Delivery ] Pun...
(DIYA) Bhumkar Chowk Call Girls Just Call 7001035870 [ Cash on Delivery ] Pun...ranjana rawat
 
03_Emmanuel Ndiaye_Degroof Petercam.pptx
03_Emmanuel Ndiaye_Degroof Petercam.pptx03_Emmanuel Ndiaye_Degroof Petercam.pptx
03_Emmanuel Ndiaye_Degroof Petercam.pptxFinTech Belgium
 
Solution Manual for Principles of Corporate Finance 14th Edition by Richard B...
Solution Manual for Principles of Corporate Finance 14th Edition by Richard B...Solution Manual for Principles of Corporate Finance 14th Edition by Richard B...
Solution Manual for Principles of Corporate Finance 14th Edition by Richard B...ssifa0344
 
02_Fabio Colombo_Accenture_MeetupDora&Cybersecurity.pptx
02_Fabio Colombo_Accenture_MeetupDora&Cybersecurity.pptx02_Fabio Colombo_Accenture_MeetupDora&Cybersecurity.pptx
02_Fabio Colombo_Accenture_MeetupDora&Cybersecurity.pptxFinTech Belgium
 
The Economic History of the U.S. Lecture 22.pdf
The Economic History of the U.S. Lecture 22.pdfThe Economic History of the U.S. Lecture 22.pdf
The Economic History of the U.S. Lecture 22.pdfGale Pooley
 
The Economic History of the U.S. Lecture 18.pdf
The Economic History of the U.S. Lecture 18.pdfThe Economic History of the U.S. Lecture 18.pdf
The Economic History of the U.S. Lecture 18.pdfGale Pooley
 
The Economic History of the U.S. Lecture 30.pdf
The Economic History of the U.S. Lecture 30.pdfThe Economic History of the U.S. Lecture 30.pdf
The Economic History of the U.S. Lecture 30.pdfGale Pooley
 
Top Rated Pune Call Girls Viman Nagar ⟟ 6297143586 ⟟ Call Me For Genuine Sex...
Top Rated  Pune Call Girls Viman Nagar ⟟ 6297143586 ⟟ Call Me For Genuine Sex...Top Rated  Pune Call Girls Viman Nagar ⟟ 6297143586 ⟟ Call Me For Genuine Sex...
Top Rated Pune Call Girls Viman Nagar ⟟ 6297143586 ⟟ Call Me For Genuine Sex...Call Girls in Nagpur High Profile
 
06_Joeri Van Speybroek_Dell_MeetupDora&Cybersecurity.pdf
06_Joeri Van Speybroek_Dell_MeetupDora&Cybersecurity.pdf06_Joeri Van Speybroek_Dell_MeetupDora&Cybersecurity.pdf
06_Joeri Van Speybroek_Dell_MeetupDora&Cybersecurity.pdfFinTech Belgium
 
Vip Call US 📞 7738631006 ✅Call Girls In Sakinaka ( Mumbai )
Vip Call US 📞 7738631006 ✅Call Girls In Sakinaka ( Mumbai )Vip Call US 📞 7738631006 ✅Call Girls In Sakinaka ( Mumbai )
Vip Call US 📞 7738631006 ✅Call Girls In Sakinaka ( Mumbai )Pooja Nehwal
 
Gurley shaw Theory of Monetary Economics.
Gurley shaw Theory of Monetary Economics.Gurley shaw Theory of Monetary Economics.
Gurley shaw Theory of Monetary Economics.Vinodha Devi
 
The Economic History of the U.S. Lecture 23.pdf
The Economic History of the U.S. Lecture 23.pdfThe Economic History of the U.S. Lecture 23.pdf
The Economic History of the U.S. Lecture 23.pdfGale Pooley
 

Último (20)

The Economic History of the U.S. Lecture 26.pdf
The Economic History of the U.S. Lecture 26.pdfThe Economic History of the U.S. Lecture 26.pdf
The Economic History of the U.S. Lecture 26.pdf
 
Call US 📞 9892124323 ✅ Kurla Call Girls In Kurla ( Mumbai ) secure service
Call US 📞 9892124323 ✅ Kurla Call Girls In Kurla ( Mumbai ) secure serviceCall US 📞 9892124323 ✅ Kurla Call Girls In Kurla ( Mumbai ) secure service
Call US 📞 9892124323 ✅ Kurla Call Girls In Kurla ( Mumbai ) secure service
 
05_Annelore Lenoir_Docbyte_MeetupDora&Cybersecurity.pptx
05_Annelore Lenoir_Docbyte_MeetupDora&Cybersecurity.pptx05_Annelore Lenoir_Docbyte_MeetupDora&Cybersecurity.pptx
05_Annelore Lenoir_Docbyte_MeetupDora&Cybersecurity.pptx
 
Stock Market Brief Deck (Under Pressure).pdf
Stock Market Brief Deck (Under Pressure).pdfStock Market Brief Deck (Under Pressure).pdf
Stock Market Brief Deck (Under Pressure).pdf
 
Indore Real Estate Market Trends Report.pdf
Indore Real Estate Market Trends Report.pdfIndore Real Estate Market Trends Report.pdf
Indore Real Estate Market Trends Report.pdf
 
00_Main ppt_MeetupDORA&CyberSecurity.pptx
00_Main ppt_MeetupDORA&CyberSecurity.pptx00_Main ppt_MeetupDORA&CyberSecurity.pptx
00_Main ppt_MeetupDORA&CyberSecurity.pptx
 
(DIYA) Bhumkar Chowk Call Girls Just Call 7001035870 [ Cash on Delivery ] Pun...
(DIYA) Bhumkar Chowk Call Girls Just Call 7001035870 [ Cash on Delivery ] Pun...(DIYA) Bhumkar Chowk Call Girls Just Call 7001035870 [ Cash on Delivery ] Pun...
(DIYA) Bhumkar Chowk Call Girls Just Call 7001035870 [ Cash on Delivery ] Pun...
 
03_Emmanuel Ndiaye_Degroof Petercam.pptx
03_Emmanuel Ndiaye_Degroof Petercam.pptx03_Emmanuel Ndiaye_Degroof Petercam.pptx
03_Emmanuel Ndiaye_Degroof Petercam.pptx
 
Solution Manual for Principles of Corporate Finance 14th Edition by Richard B...
Solution Manual for Principles of Corporate Finance 14th Edition by Richard B...Solution Manual for Principles of Corporate Finance 14th Edition by Richard B...
Solution Manual for Principles of Corporate Finance 14th Edition by Richard B...
 
02_Fabio Colombo_Accenture_MeetupDora&Cybersecurity.pptx
02_Fabio Colombo_Accenture_MeetupDora&Cybersecurity.pptx02_Fabio Colombo_Accenture_MeetupDora&Cybersecurity.pptx
02_Fabio Colombo_Accenture_MeetupDora&Cybersecurity.pptx
 
The Economic History of the U.S. Lecture 22.pdf
The Economic History of the U.S. Lecture 22.pdfThe Economic History of the U.S. Lecture 22.pdf
The Economic History of the U.S. Lecture 22.pdf
 
The Economic History of the U.S. Lecture 18.pdf
The Economic History of the U.S. Lecture 18.pdfThe Economic History of the U.S. Lecture 18.pdf
The Economic History of the U.S. Lecture 18.pdf
 
The Economic History of the U.S. Lecture 30.pdf
The Economic History of the U.S. Lecture 30.pdfThe Economic History of the U.S. Lecture 30.pdf
The Economic History of the U.S. Lecture 30.pdf
 
VIP Call Girl Service Andheri West ⚡ 9920725232 What It Takes To Be The Best ...
VIP Call Girl Service Andheri West ⚡ 9920725232 What It Takes To Be The Best ...VIP Call Girl Service Andheri West ⚡ 9920725232 What It Takes To Be The Best ...
VIP Call Girl Service Andheri West ⚡ 9920725232 What It Takes To Be The Best ...
 
Top Rated Pune Call Girls Viman Nagar ⟟ 6297143586 ⟟ Call Me For Genuine Sex...
Top Rated  Pune Call Girls Viman Nagar ⟟ 6297143586 ⟟ Call Me For Genuine Sex...Top Rated  Pune Call Girls Viman Nagar ⟟ 6297143586 ⟟ Call Me For Genuine Sex...
Top Rated Pune Call Girls Viman Nagar ⟟ 6297143586 ⟟ Call Me For Genuine Sex...
 
06_Joeri Van Speybroek_Dell_MeetupDora&Cybersecurity.pdf
06_Joeri Van Speybroek_Dell_MeetupDora&Cybersecurity.pdf06_Joeri Van Speybroek_Dell_MeetupDora&Cybersecurity.pdf
06_Joeri Van Speybroek_Dell_MeetupDora&Cybersecurity.pdf
 
Vip Call US 📞 7738631006 ✅Call Girls In Sakinaka ( Mumbai )
Vip Call US 📞 7738631006 ✅Call Girls In Sakinaka ( Mumbai )Vip Call US 📞 7738631006 ✅Call Girls In Sakinaka ( Mumbai )
Vip Call US 📞 7738631006 ✅Call Girls In Sakinaka ( Mumbai )
 
Gurley shaw Theory of Monetary Economics.
Gurley shaw Theory of Monetary Economics.Gurley shaw Theory of Monetary Economics.
Gurley shaw Theory of Monetary Economics.
 
The Economic History of the U.S. Lecture 23.pdf
The Economic History of the U.S. Lecture 23.pdfThe Economic History of the U.S. Lecture 23.pdf
The Economic History of the U.S. Lecture 23.pdf
 
VIP Independent Call Girls in Bandra West đŸŒč 9920725232 ( Call Me ) Mumbai Esc...
VIP Independent Call Girls in Bandra West đŸŒč 9920725232 ( Call Me ) Mumbai Esc...VIP Independent Call Girls in Bandra West đŸŒč 9920725232 ( Call Me ) Mumbai Esc...
VIP Independent Call Girls in Bandra West đŸŒč 9920725232 ( Call Me ) Mumbai Esc...
 

Japan vs. US comparison on numerous dimensions

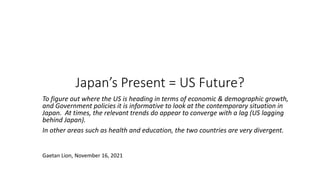
  • 1. Japan’s Present = US Future? To figure out where the US is heading in terms of economic & demographic growth, and Government policies it is informative to look at the contemporary situation in Japan. At times, the relevant trends do appear to converge with a lag (US lagging behind Japan). In other areas such as health and education, the two countries are very divergent. Gaetan Lion, November 16, 2021
  • 3. Notice that both countries’ fertility rate has been much below replacement rate (green line at 2.1 child per woman) for several years for the US and several decades for Japan. The US fertility rate at 1.71 in 2019 is very close to Japan at 1.72 back in 1986. Japan’s fertility rate in 2019 is 1.36. The US fertility rate has dropped from 2.12 in 2007 to 1.71 in 2019. If current trend continues, the U.S. fertility rate could very well reach Japan’s current level within a couple of decades. Source: World Bank 3 US Japan
  • 4. The US population growth rate in 2020 based on a 10 year CAGR was 0.8%; the same as Japan was in 1985. Japan’s population growth rate, as specified, was flat starting in 2012 and became negative in 2016. The US population growth rate, as specified was 1.6% in 2001 and 0.8% in 2020. Source: World Bank 4 US Japan
  • 5. Old Age Dependency Ratio (> 64/15-64) 5 Japan’s society has aged very rapidly since the early 1980s. The US appears to be on a similar aging path around 2010. And, the US aging trend as defined by this Old Age Dependency Ratio is accelerating. By mid- or late- century, the US Old Age Dependency Ratio may well approach Japan’s current levels. Japan US Gray areas denote US recessions
  • 6. Age Dependency Ratio ( < 15 + > 64)/(15 – 64) 6 The current Age Dependency Ratio (< 15 + > 64)/(15 – 64) is around 55% for the US and 70% for Japan. The US mentioned ratio is expected to reach Japan’s current level by 2070, according to the United Nations – Population Division. US Japan
  • 7. 7 Population by Age Group Looking at population by age group over time, the US population age group mix in 2020 is similar to Japan’s in mid 90s (red vertical dashed line) . Japan’s population aging after the mid 90s accelerated (mixture of rising life span, declining fertility rate). We can expect the US population to continue aging, but not as rapidly as Japan because of declining US health trends (rising BMI, etc.) and the US higher net immigration rate. US Japan
  • 8. Life Expectancy 8 Japan US In 1965, both countries had a life expectancy of 70 years. By 2019, Japan’s life expectancy had risen to 84.35 years and the US to 78.78 years (same as Japan in 1989). Gray areas denote US recessions
  • 9. Population growth projections 9 Japan US Population projections reflect the impact of ongoing population aging, lower fertility rates, and differential in net migration rates. In 2020, Japan’s population has already peaked and is starting to decline. Notice the already very rapid decline in Japan’s youth population (< 15, and < 5). For the US, the slow down in population growth is not that pronounced. Out to 2100, the US population is still expecting to continue rising, albeit at a much lower speed. Notice the rather flat trend in US youth population growth.
  • 10. Net migration 10 Japan US The main reason the US population growth is not slowing down as rapidly as Japan’s is the US far higher net migration. Net migration to the US amounts to around 5 million individuals coming into the country every year vs only 500,000 for Japan. This corresponds to a boost in yearly population growth of about 1.5% for the US vs. only 0.4% for Japan. Gray areas denote US recessions
  • 11. 11 Population growth is result of fertility rate and net migration rate Combining a fertility rate of 1.4 with a net positive migration per annum of 0.5%, assuming a generation has a length of 30 years, results in a yearly change in population of – 0.8%. That is pretty much where Japan is heading (red cell). The US situation is associated with a fertility rate of 1.7 with a net positive migration of 1.5% resulting in a yearly change in population of + 0.8%. If we assume the generation length to be 25 years. The mentioned yearly change in population decreases to – 1.1% for Japan and + 0.6% for the US. This framework pretty much explains the respective population projections shown earlier.
  • 13. The explanatory commentary for this slide is very similar to the one on the previous slide. The main difference is that the US economic growth is still quite a bit faster than Japan’s. And, this is due to the US population growth rate being higher than Japan’s because of the the US much higher positive net immigration. As the US population growth rate keeps on declining, its economic growth rate will also decline. However, it may always lag behind the steeper decline in Japan’s economic growth rate. 13 Source: World Bank, OECD Japan US
  • 15. Investment/GDP 15 The two measures are not entirely comparable. And, the data for Japan was unavailable after 2010. Over the reviewed years, accepting the data caveats it appears that Japan’s investment to GDP was much higher than in the US. I understand that in more recent years, this gap has narrowed materially. US Japan Gray areas denote US recessions
  • 17. 17 US Japan Growth rate of real GDP per employed person is again different between the two countries. Over the reviewed period, the Japanese measure is far more volatile. It is not unlikely that in the near future, the two countries will converge somewhat on such measures.
  • 18. Labor Productivity 18 Japan US The two countries’ respective changes in labor productivity are different. At times, the two time series seem negatively correlated. Nevertheless, notice how during US recessions (gray areas), Japan’s labor productivity drops a lot more than the US. This is especially the case during the three most recent recessions. Gray areas denote US recessions
  • 20. Source: World Bank, OECD Both countries have experienced a long term decline in constant GDP per capita growth rate. Japan’s decline has been more pronounced because in the early years, Japan was still in a post WWII catch-up economic boom mode, which phased out over time. Additionally, Japan experienced the pop of the Japan’s Bubble (stock market and real estate) in the late 1980s to early 1990s which further accelerated the decline in constant GDP per capita growth rate. As shown, the current respective growth rates of both countries have already converged much after the Great Recession. The US mentioned growth rate is only marginally higher than Japan’s. 20 US Japan
  • 21. 21 Source: International Federation of Robotics Japan is one of the World leaders in robotization. Notice that its number of robots installed per 10,000 employees is close to 60% greater than in the US. Between 217 and 2019, Japan has increased its robot installation by 18% compared to 14% for the US. Robotization is a viable way for Japan to partly overcome its prospective decline in labor force over the next several decades. And, it may contribute to Japan’s GDP per capita growth.
  • 22. RGDP & RGDP p.c. CAGR forecasts over 2020 – 2060 22 US GDP is anticipated to grow much faster than Japan because of much faster population growth due to its higher net migration rate that compensates for a fertility rate much below replacement rate. When scaling economic growth on a per capita basis, Japan is expected to grow faster than the US. This is due to Japan’s decreasing population (lowering the denominator) and potentially its higher level of robotization.
  • 24. 24 The Federal Reserve Bank Quantitative Easing (QE) activity whereby the Fed buys a huge amount of securities (Treasuries, MBS) to inject liquidity in the financial system, lower long term interest rates, and stimulate the economy is a very recent phenomenon. Between 1970 and the early 2000s, the Fed had managed the economy without any QE activity. And, the Fed’s balance sheet remained steadily between 5% to 7% of GDP (upper chart). Over this period, the US economy had experienced numerous severe downturns associated with several oil shocks, stagflation, Y2K, etc. (see lower chart gray areas). Starting with the Great Recession in late 2007, the Fed implemented massive QE activity on an unprecedented scale. During the Great Recession, the mentioned QE activities caused the Fed’s balance sheet to nearly triple from just above 5% to over 15% of GDP. During the COVID Recession, the Fed abruptly increased its balance sheet (through QE activities) from 20% to over 35% of GDP. Gray areas denote US recessions
  • 25. QE Activity. Japan vs. US 25 Source: FRED, Federal Reserve, Bank of Japan The Bank of Japan (BOJ) was a pioneer in mounting huge QE activities. The BOJ assets level already represented over 15% of GDP back in 1998. The US Federal Reserve will only reach that level in early 2009 during the Great Recession. Within the US, the recent bump up to 35% of GDP during the COVID Recession seemed like a giant leap. However, this QE effort is dwarfed by the ongoing BOJ QE activities mounted since the Great Recession. BOJ assets currently represent a staggering 132% of GDP vs. 34% for the US Fed. Japan US
  • 26. Central Bank Policy Rate 26 Japan US The BOJ was also a pioneer in setting policy interest rates close to 0%. They have been at that level since 1995. The Fed only implemented such low rates in 2009 during the Great Recession. Gray areas denote US recessions
  • 27. Monetary policy considerations 27 The Federal Reserve QE interventions have reached ever rising and unprecedented scale since the Great Recession. Yet, their respective scale appears diminutive vs. Japan. Nevertheless, the Japan ongoing very large QE efforts have not contributed to inflation. The most recent figures indicate that Japan’s inflation has remained pretty much flat over the past 12 months at + 0.2%. Meanwhile, in the US inflation has surged by 6.2% over the same period (Source: The Economist issue of November 13th – 19th, 2021).
  • 29. US Budget Deficit as % of GDP 29 Gray areas denote US recessions Since the aftermath of the Dot.com Bubble recession in the early 2000s, the following recessions have steadily resulted in massive increase in fiscal stimulus associated with ever larger Budget Deficits (as a % of GDP).
  • 30. Budget Deficit comparison: Japan vs. US 30 Japan US Gray areas denote US recessions Even though the Japanese data is incomplete, it again denotes that Japanese fiscal stimulus undertaking have often been far larger than the US.
  • 31. Central Government Debt/GDP 31 US Japan Source: IMF The two countries had the same level of Central Government Debt/GDP in the early 1990s. Since then, Japan’s ratio has more than tripled to 200%. Meanwhile, the US more than doubled from just above 40% before the Great Recession to over 90% in 2019. My understanding is that most recent US data would indicate that this ratio is now much above 100%.
  • 32. 32 General Government Debt/GDP Japan US Source: IMF Directionally, same comment as on the previous slide. Notice that the most recent data disclosed by the IMF is as of 2019. If updated to 2021, both ratios would be substantially higher.
  • 33. Fiscal policy considerations 33 Since the Great Recession, the US Government has embarked on an ever rapidly increasing debt leveraging with increasing Budget Deficits even during economic expansions (relative to earlier expansions), resulting in ever increasing Public Debt/GDP. Given current legislation passed regarding ongoing fiscal stimuli in the $trillions, both ongoing Budget Deficits and Public Debt/GDP ratios are likely to continue rising rapidly over the next few years. However, when we compare the US public debt leveraging with Japan, the former is dwarfed by the latter. Nevertheless, the Japan ongoing very large fiscal stimulus and debt leveraging has not contributed to inflation. The most recent figures indicate that Japan’s inflation has remained pretty much flat over the past 12 months at + 0.2%. Meanwhile, in the US inflation has surged by 6.2% over the same period (Source: The Economist issue of November 13th – 19th, 2021).
  • 35. 35 Source: OECD US $10,900 per year Japan $4,700 per year
  • 36. 36 Source: OECD Japan 11% of GDP US 16.8% of GDP
  • 38. 38 BMI = > 25 Japan 27.5% US 73% Source: OECD
  • 39. 39 Obesity rate among adults: Japan 3.7% US 38.2%
  • 40. 40 Source: OECD Japan 16 days at hospital US 5.5 days at hospital
  • 41. 41
  • 42. 42 The US costs are inflated because they include cost of hospital, administrative, physician, and diagnostic procedure. Meanwhile for the other countries, the costs only include the cost of the procedure. But, even if we multiplied Japan’s costs as specified by 4 times, in most cases, they still would be a lot lower than the US ones.
  • 43. 43 Source: Fropky.com US consumption of soft drink p.c. = 10 x Japan’s!
  • 44. 44 Source: Fropky.com US TV watching is more than 2 x Japan’s.
  • 45. 45 Source: Fropky.com, daitips.com School year: 210 days School year: 180 days * World Data sources: the intelligence quotients by countries are taken from the studies conducted by Richard Lynn and Tatu Vanhanen (2002), Heiner Rindermann (2007), Khaleefa and Lynn (2008), Ahmad, Khanum and Riaz (2008), Lynn, Abdalla and Al-Shahomee (2008), Lynn and Meisenberg (2010), as well as the PISA tests in 2003, 2006, and 2009. More recent results were weighted higher.
  • 46. 46 Obesity Rate Japan 3.7% US 38.2% Life Expectancy Japan 84.4 US 78.8 Health Care Cost Japan 11% of GDP US 16.8% of GDP An intriguing Causal Model Causal variable Causal variable School Year Japan 210 days US 180 days Causal variable RGDP p.c. forecast Japan 1.8% US 1.4%
  • 47. Health considerations 47 It is unclear how the US could ever bridge the vast difference in lifestyle, nutrition, overall health status, and life expectancy with Japan. In combination those factors contribute directly to much higher health care costs for the US relative to Japan. Additionally, health care costs in the US are further boosted by malpractice liabilities, for profit industry structure, and ill conceived regulations (i.e. US Medicare not allowed to negotiate lower drug prices).
  • 49. 49 Program for International Student Assessment (PISA) (15 years old) Japan US Japan Japan US US Over time, reading scores between Japan and the US are not so far apart. Japan’s are just a lot more volatile. On the other hand, in both math and science, Japan performs well above the US and the OECD average. Meanwhile, the US is below the OECD average in math, and just about at the OECD average in science. Regarding those PISA country scores, one could advance the respective average IQ of the countries plays a role. As we will see in the following slides, the standard deviation of IQ may be an underlying confounding variable that is also influential on the shown outcomes.
  • 50. 50 Source: American Institute of Physics, National Science Board Japan US These figures should be adjusted for respective countries’ population size. Nevertheless, we can see that over the reviewed period, the US is experiencing a reasonably rapid upward trend from 500K to around 750K degrees. Meanwhile, Japan’s trend is actually slightly downward. Adjusted for population size, Japan’s figures would still be higher than the US. But, if current trends continue, it would not be the case for long.
  • 51. 51 Source: American Institute of Physics, National Science Board US total US temporary visa US citizens and permanent residents Japan Even if we adjusted the figures for population size, the US (during most recent years) would be faring better than Japan on this one count.
  • 52. 52 Source: American Institute of Physics, National Science Board On this count to, the US is faring well relative to Japan. Remember the consideration between average IQ and its standard deviation. It seems to be playing out here.
  • 53. 53 Source: The Center for World University Ranking (CWUR), 2021- 2022 edition Among the top 20 universities in the World: US 16 Japan 1
  • 54. 54 Source: The Center for World University Ranking (CWUR), 2021- 2022 edition Among top 10 universities in Japan, only 2 are in the top 50 in the World. Top 10 universities in Japan
  • 55. 55 The top 10 universities in US all rank among the top 12 in the World. Source: The Center for World University Ranking (CWUR), 2021- 2022 edition Top 10 universities in US
  • 56. Education considerations 56 Japan’s primary education performance is far superior to the US, and is likely to remain so. The US primary school system is unlikely to ever bridge the gap in school year-days (180 in US vs. 210 in Japan). Also, qualitative factors we have not explored like rigor in math and science curricula are likely to remain a differentiating factor between the two countries. At the university level, it appears the roles are reversed with top US universities being far superior to Japanese ones. And, the US comparing favorably in the number of university degrees conferred in science and engineering, and in the number of publications within those same fields. It seems like an ideal education path would be for one to grow up in Japan to get a world class primary education. And, then to emigrate to the US to go to university. Apparently, many top Asian students (Japan, China, India) follow a similar path. And, they contribute to the number of science and engineering degrees and published articles in the US.