
Recomendados
Recomendados
Mais conteúdo relacionado
Mais procurados
Mais procurados (20)
Destaque
Semelhante a Odey absolute return enero 2014
Semelhante a Odey absolute return enero 2014 (20)
Mais de Frank Ragol
Mais de Frank Ragol (20)
Último
Último (20)
Odey absolute return enero 2014
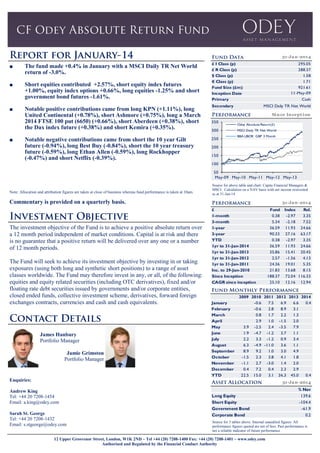
- 1. 31-Ja n -2014 ■ The fund made +0.4% in January with a MSCI Daily TR Net World return of -3.0%. ■ Short equities contributed +2.57%, short equity index futures +1.00%, equity index options +0.66%, long equities -1.25% and short government bond futures -1.61%. ■ ■ Notable positive contributions came from long KPN (+1.11%), long United Continental (+0.78%), short Ashmore (+0.75%), long a March 2014 FTSE 100 put (6650) (+0.66%), short Aberdeen (+0.38%), short the Dax index future (+0.38%) and short Kemira (+0.35%). Notable negative contributions came from short the 10 year Gilt future (-0.94%), long Best Buy (-0.84%), short the 10 year treasury future (-0.59%), long Ethan Allen (-0.59%), long Rockhopper (-0.47%) and short Netflix (-0.39%). £ I Class (p) £ R Class (p) $ Class (p) € Class (p) Fund Size (£m) Inception Date Primary Secondary 295.05 288.37 1.58 1.71 921.61 11-May-09 Cash MSCI Daily TR Net World Si n ce In cept i on 350 300 Odey Absolute Return(£) Odey Absolute Return(£) MSCI Daily TR Net World MSCI Daily TR Net World 250 BBA LIBOR GBP 3 Month BBA LIBOR GBP 3 Month 200 150 100 50 May-09 May-10 May-11 May-12 May-13 Note: Allocation and attribution figures are taken at close of business whereas fund performance is taken at 10am. Source for above table and chart: Capita Financial Managers & MSCI. Calculation on a NAV basis with net income reinvested as at 31-Jan-14. Commentary is provided on a quarterly basis. The investment objective of the Fund is to achieve a positive absolute return over a 12 month period independent of market conditions. Capital is at risk and there is no guarantee that a positive return will be delivered over any one or a number of 12 month periods. The Fund will seek to achieve its investment objective by investing in or taking exposures (using both long and synthetic short positions) to a range of asset classes worldwide. The Fund may therefore invest in any, or all, of the following: equities and equity related securities (including OTC derivatives), fixed and/or floating rate debt securities issued by governments and/or corporate entities, closed ended funds, collective investment scheme, derivatives, forward foreign exchanges contracts, currencies and cash and cash equivalents. James Hanbury Portfolio Manager Jamie Grimston Portfolio Manager Enquiries: 31-Ja n -2014 £ 1-month 3-month 1-year 3-year YTD 1yr to 31-Jan-2014 1yr to 31-Jan-2013 1yr to 31-Jan-2012 1yr to 31-Jan-2011 Inc. to 29-Jan-2010 Since Inception CAGR since inception January February March April May June July August September October November December YTD Fund 0.38 5.34 36.59 90.33 0.38 36.59 35.86 2.57 24.36 21.83 188.37 25.10 Index Rel. -2.97 3.35 -2.18 7.52 11.93 24.66 27.16 63.17 -2.97 3.35 11.93 24.66 15.41 20.45 -1.56 4.13 19.01 5.35 13.68 8.15 72.04 116.33 12.16 12.94 2009 2010 2011 2012 2013 2014 -0.6 7.5 6.9 6.6 0.4 -0.6 2.8 8.9 3.1 0.8 1.7 2.2 1.3 2.9 1.0 -1.5 2.0 3.9 -2.5 2.4 -3.5 7.9 1.9 -4.7 -1.2 3.7 1.1 2.2 3.3 -1.2 0.9 3.4 6.3 -4.9 -11.0 3.6 1.1 8.9 9.2 1.0 3.0 4.9 -1.5 2.3 3.8 4.1 1.8 -1.1 2.7 -3.0 1.4 2.0 0.4 7.2 0.4 2.3 2.9 22.5 15.0 3.1 36.3 45.0 0.4 31-Ja n -2014 Andrew King Tel: +44 20 7208-1454 Email: a.king@odey.com Sarah St. George Tel: +44 20 7208-1432 Email: s.stgeorge@odey.com Long Equity Short Equity Government Bond Corporate Bond % Nav 139.6 -104.4 -61.9 0.2 Source for 3 tables above: Internal unaudited figures. All performance figures quoted are net of fees. Past performance is not a reliable indicator of future performance 12 Upper Grosvenor Street, London, W1K 2ND ~ Tel +44 (20) 7208-1400 Fax: +44 (20) 7208-1401 ~ www.odey.com Authorised and Regulated by the Financial Conduct Authority
- 2. At 31-Jan-14 At 31-Jan-14 20 60 10 40 0 20 -10 0 -20 Long -30 Short Short -20 -40 -60 Virgin Islands - British US UK Switzerland Sweden Spain Russian Federation Netherlands Luxembourg Korea (South) Japan Israel Ireland Guernsey Gibraltar Germany France Finland European Countries Cyprus China Canada Bermuda Austria Australia Utilities Transport Telecommunications Technology Hardware Software & Services Retail Real Estate Others Mining & Metals Media Leisure & Hotels Insurance Index Household Goods Healthcare Food, Bev & Tobacco Engr. & Manufacturing Energy Construction Commercial Services Chemicals Business Services Banks & Finance Autos & Components -40 Long Internal unaudited figures Internal unaudited figures At 31-Jan-14 At 31-Jan-14 Rank 1 2 3 4 5 100.10 100 80 60 0.20 0.20 NOK CAD GBP -0.10 USD 0.10 SEK -0.60 EUR 0.10 AUD 20 -20 Strategy Notional Exposure (%) Long 7.1 Long 6.7 Long 5.2 Long 4.5 Long 4.3 Security US 10Yr Note (CBT Mar14 Long Gilt Future Mar14 DAX INDEX FUTURE FTSE 100 IDX FUT FTSE 100 Index Strategy Notional Exposure (%) Short 29.7 Short 29.6 Short 10.6 Short 8.9 Short 7.0 At 31-Jan-14 40 0 Security Regus Koninklijke KPN Sky Deutschland Toyota Industries Corp Samsung Electronics Co Rank 1 2 3 4 5 120 Currency exposure is shown net of all assets held by the fund, including any forward currency positions. Internal unaudited figures Internal unaudited figures At 31-Jan-14 At 31-Jan-14 Comparators Fund inception date Fund type Base currency Share classes Dealing / Valuation Front end fee Annual Management fee Performance fee basis Primary: Cash; Secondary: MSCI World TR Net 11 May, 2009 UK Long / Short UCITS IV £ £R, £I, €I & $I (Acc.) Daily forward to 10am / 10am Up to 4% (£R) 1.25% & (£I, €I & $I) 0.75% 20% of the increase in the value per share of the fund between the beginning and the end of the year. Fees crystallise annually. Losses carried forward. Anti-dilution fee May apply 0.75% to NAV on subs/reds Min. investment R £5,000; £I, €I & $I £100,000 Dividends Accumulation shares only Authorised Corporate Director (ACD) Capita Financial Managers Ltd Auditor Ernst and Young LLP Price reporting Prices published daily in FT ISIN R: GB00B55NGR79, £I: GB00B55NGS86 €I: GB00B3SX1S66, $:GB00B3Z00X80 SEDOL R: B55NGR7, £I: B55NGS8, €I: B3SX1S6, $:B3Z00X8 1-year 3-year 200 Fund annual s.dev. Inc. 6.82 11.84 12.68 150 Index annual s.dev. 10.27 10.96 12.82 100 alpha 2.37 1.34 1.21 beta 0.29 0.73 0.62 Correlation 0.47 0.69 0.64 Sharpe Ratio 4.59 1.83 1.75 Fund info Ratio 2.21 1.55 0.99 Fund tracking error 11.15 10.07 11.3 Treynor 125.1 31.87 37.91 ∞ 2.39 2.41 50 0 -50 -100 -150 May-09 Long Equity Exposure Short Equity Exposure Net Equity Exposure May-10 May-11 Internal unaudited figures May-12 May-13 Sortino Internal unaudited figures This is a marketing communication from Odey which is not intended to be viewed as a piece of independent investment research. © 2013 Odey Asset Management LLP (“OAM”) has approved this communication which is for private circulation only, and in the UK is directed to persons who are professional clients or eligible counterparties for the purposes of the FCA’s Conduct of Business Sourcebook and it is not intended for and must not be distributed to retail clients. It does not constitute an offer to sell or an invitation to buy or invest in any of the securities or funds mentioned herein and it does not constitute a personal recommendation or investment taxation or any other advice. The information and any opinions have been obtained from or are based on sources believed to be reliable, but accuracy cannot be guaranteed. Past performance does not guarantee future results and the value of all investments and the income derived therefrom can decrease as well as increase. Investments that have an exposure to currencies other than the base currency of the fund may be subject to exchange rate fluctuations. This communication and the information contained therein may constitute a financial promotion for the purposes of the Financial Services and Markets Act 2000 of the United Kingdom (the “Act”) and the rules of the FCA. This communication is not subject to any restrictions on dealing ahead. The distribution of this communication may, in some countries, be restricted by law or regulation. Accordingly, anyone who comes into possession of this communication should inform themselves of and observe these restrictions. OAM is not liable for a breach of such restrictions or for any losses relating to the accuracy, completeness or use of information in this communication, including any consequential loss. Please always refer to the fund’s prospectus. OAM whose company No. is OC302585 and whose registered office is at 12 Upper Grosvenor Street, London, W1K 2ND, is authorised and regulated by the Financial Conduct Authority. 12 Upper Grosvenor Street, London, W1K 2ND ~ Tel +44 (20) 7208-1400 Fax: +44 (20) 7208-1401 ~ www.odey.com Authorised and Regulated by the Financial Conduct Authority