Bluenose ei nov leaf
•
0 gostou•107 visualizações

The trading strategy incorporates fundamental and technical analysis to determine optimal entry and exit points for selling options premium on futures indexes. The strategy aims for monthly returns of 0.5-1% with an annualized return target of 6-8% and has achieved an annualized return of 6.56% since 2010 with monthly volatility of 3.39%. Downside risks have included a maximum drawdown of 15.11% from September to October 2014.

Recomendados
Mais conteúdo relacionado
Mais procurados
Mais procurados (20)
Semelhante a Bluenose ei nov leaf
Semelhante a Bluenose ei nov leaf (20)
Último
Último (20)
Bluenose ei nov leaf
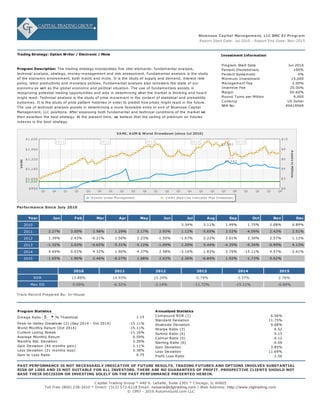
- 1. Trading Strategy: Option Writer / Electronic / Minis Program Description: The trading strategy incorporates five vital elements: fundamental analysis, technical analysis, strategy, money-management and risk assessment. Fundamental analysis is the study of the economic environment, both macro and micro. It is the study of supply and demand, interest rate policy, labor productivity and monetary policies. Fundamental analysis also considers the state of our economy as well as the global economic and political situation. The use of fundamentals assists in recognizing potential trading opportunities and aids in determining what the market is thinking and how it might react. Technical analysis is the study of price movement in the context of statistical and probability outcomes. It is the study of price pattern histories in order to predict how prices might react in the future. The use of technical analysis assists in determining a more favorable entry or exit of Bluenose Capital Management, LLC positions. After assessing both fundamental and technical conditions of the market we then ascertain the best strategy. At the present time, we believe that the selling of premium on futures indexes is the best strategy. Investment Information Program Start Date Jul-2010 Percent Discretionary 100% Percent Systematic 0% Minimum Investment 15,000 Management Fee 2.00% Incentive Fee 20.00% Margin 50-60% Round Turns per Million 9,400 Currency US Dollar NFA No: #0419569 Program Statistics Omega Ratio 5 % Threshold 1.15 Peak-to-Valley Drawdown (2) (Sep 2014 - Oct 2014) -15.11% Worst Monthly Return (Oct 2014) -15.11% Current Losing Streak -11.16% Average Monthly Return 0.59% Monthly Std. Deviation 3.39% Gain Deviation (44 months gain) 1.11% Loss Deviation (21 months loss) 3.38% Gain to Loss Ratio 0.75 Annualized Statistics Compound ROR (1) 6.56% Standard Deviation 11.75% Downside Deviation 9.68% Sharpe Ratio (3) 0.52 Sortino Ratio (4) 0.15 Calmar Ratio (5) -0.12 Sterling Ratio (6) -0.09 Gain Deviation 3.85% Loss Deviation 11.69% Profit Loss Ratio 1.56 Bluenose Capital Management, LLC BNC EI Program Report Start Date: Jul-2010 - Report End Date: Nov-2015 Performance Since July 2010 Year Jan Feb Mar Apr May Jun Jul Aug Sep Oct Nov Dec 2010 3.34% 3.11% 1.99% 1.75% 2.08% 0.89% 2011 2.27% 3.00% 2.98% 1.29% 2.17% 2.93% 1.12% -5.65% 3.52% -4.09% 2.43% 2.51% 2012 1.39% 2.43% -0.21% 1.50% 2.23% -1.50% -1.67% 2.22% 2.01% 2.30% 2.57% 1.12% 2013 -1.32% 3.03% -0.65% -5.31% -5.12% -1.09% 1.29% 5.44% -4.35% -0.34% -0.99% 4.13% 2014 4.69% 0.03% 4.32% 1.90% -4.37% 2.58% -3.16% 1.83% 3.79% -15.11% 4.57% -2.61% 2015 -1.65% 1.96% 2.46% -0.27% 1.68% 2.63% 2.36% -6.84% 1.92% -1.73% 0.62% 2010 2011 2012 2013 2014 2015 ROR 13.88% 14.93% 15.24% -5.79% -3.37% 2.76% Max DD 0.00% -6.32% -3.14% -11.72% -15.11% -6.84% Track Record Prepared By: In-House PAST PERFORMANCE IS NOT NECESSARILY INDICATIVE OF FUTURE RESULTS. TRADING FUTURES AND OPTIONS INVOLVES SUBSTANTIAL RISK OF LOSS AND IS NOT SUITABLE FOR ALL INVESTORS. THERE ARE NO GUARANTEES OF PROFIT. PROSPECTIVE CLIENTS SHOULD NOT BASE THEIR DECISION ON INVESTING SOLELY ON THE PAST PERFORMANCE PRESENTED HEREIN. Capital Trading Group * 440 S. LaSalle, Suite 2301 * Chicago, IL 60605 Toll Free (800) 238-2610 * Direct: (312) 572-6118 Email: nsloane@ctgtrading.com | Web Address: http://www.ctgtrading.com © 1997 - 2016 AutumnGold.com LLC Q3 Q4 Q1 Q2 Q3 Q4 Q1 Q2 Q3 Q4 Q1 Q2 Q3 Q4 Q1 Q2 Q3 Q4 Q1 Q2 Q3 Q4 VAMI, AUM & Worst Drawdown (since Jul 2010) $900 $0 $1,040 $1,180 $1,320 $1,460 $1,600 $2 $4 $6 $8 $10 2011 2012 2013 2014 2015 $1,000 $1,582 $1,343 VAMI AssetsinMillions A ssets U nder M anagement V A M I (Red Line Indicates M ax Drawdown)
- 2. Time Window Analysis Length Best Average Worst 1 mo 5.4% 0.6% -15.1% 3 mo 9.2% 1.7% -13.5% 6 mo 15.6% 3.3% -14.8% 12 mo 31.6% 5.4% -11.1% 18 mo 30.9% 8% -11.4% 24 mo 38.6% 11% -10.2% 36 mo 35.7% 14.7% -5.4% Historical Drawdown and Recoveries*** Start Depth Length Recovery End Oct-14 -15.11% 1 mo 13 mo n/a Mar-13 -11.72% 4 mo 9 mo Mar-14 Aug-11 -6.32% 3 mo 4 mo Feb-12 May-14 -5.00% 3 mo 2 mo Sep-14 Jun-12 -3.14% 2 mo 2 mo Sep-12 Jan-13 -1.32% 1 mo 1 mo Feb-13 Current Losing Streak = -11.16% Bluenose Capital Management, LLC BNC EI Program Report Start Date: Jul-2010 - Report End Date: Nov-2015 Comparisons Program AG CTA Index SP 500 TR Annualized Compound ROR (1) 6.56% 2.82% 16.28% Cumulative Return 41.09% 16.26% 126.37% Cumulative VAMI(7) 1411 1163 2264 Largest Monthly Gain 5.44% 4.14% 10.93% Largest Monthly Loss -15.11% -2.71% -7.03% Profit Loss Ratio 1.56 1.50 2.53 Correlation — 0.223 -0.098 Last Month 0.62% 1.84% 0.30% Last 12 Months 0.08% 0.41% 2.75% Last 36 Months -5.41% 7.16% 56.46% PAST PERFORMANCE IS NOT NECESSARILY INDICATIVE OF FUTURE RESULTS. TRADING FUTURES AND OPTIONS INVOLVES SUBSTANTIAL RISK OF LOSS AND IS NOT SUITABLE FOR ALL INVESTORS. THERE ARE NO GUARANTEES OF PROFIT. PROSPECTIVE CLIENTS SHOULD NOT BASE THEIR DECISION ON INVESTING SOLELY ON THE PAST PERFORMANCE PRESENTED HEREIN. Capital Trading Group * 440 S. LaSalle, Suite 2301 * Chicago, IL 60605 Toll Free (800) 238-2610 * Direct: (312) 572-6118 Email: nsloane@ctgtrading.com | Web Address: http://www.ctgtrading.com © 1997 - 2016 AutumnGold.com LLC Q3 Q4 Q1 Q2 Q3 Q4 Q1 Q2 Q3 Q4 Q1 Q2 Q3 Q4 Q1 Q2 Q3 Q4 Q1 Q2 Q3 Q4 Monthly Returns (since Jul 2010) -18% -12% -6% 6% 12% 2010 2011 2012 2013 2014 2015 0% Month/Year <-10 -10to-8 -8to-6 -6to-4 -4to-2 -2to0 0to2 2to4 4to6 6to8 8to10 >10 Distribution of Returns (since Jul 2010) 0 M os. 6 M os. 12 M os. 18 M os. 24 M os. 30 M os. Percent Return Q3 Q4 Q1 Q2 Q3 Q4 Q1 Q2 Q3 Q4 Q1 Q2 Q3 Q4 Q1 Q2 Q3 Q4 Q1 Q2 Q3 Q4 Growth of $1,000 VAMI - Program vs. Benchmarks (since Jul 2010) $0 $600 $1,200 $1,800 $2,400 $3,000 2011 2012 2013 2014 2015 $1,000 VAMI Program AG CTA Index SP 500 TR
- 3. Bluenose Capital Management, LLC BNC EI Program Report Start Date: Jul-2010 - Report End Date: Nov-2015 An Important Note on the Start Date and End Dates of this Report. If the Start Date of this Report Predates the Inception of the Program, the Maximum Drawdown from Inception may be larger than indicated in this report. The Inception of this program is Jul 2010 FOOTNOTES 1. The Compound Annual ROR is the average return of an investment over a number of years. It smoothes out returns by assuming constant growth. 2. Peak to Valley Drawdown ("Maximum Drawdown") is the worst drawdown % loss over the period of Jul-2010 to Nov-2015 3. Sharpe Ratio uses a 1% Risk Free ROR 4. Sortino Ratio uses a 5% Minimum Acceptable ROR 5. Calmar Ratio Uses last 36 months of Data 6. Sterling Ratio uses last 36 months of Data 7. The hypothetical growth of $1,000 8. The drawdown begins in the month listed as start. The length in months of the drawdown is listed under length. The recovery begins in the following month, and the length of the recovery period is listed under recovery. AG CTA Index: The Autumn Gold CTA Index is a Non-Investable Index comprised of the client performance of all CTA programs included in the AG database and does not represent the complete universe of CTAs. CTA programs with proprietary performance are not included. Monthly numbers are updated until 45 days after the end of the month. Investors should note that it is not possible to invest in this index. SP 500 TR: The S&P 500 indices are designed to reflect all sectors of the U.S. equity markets. The S&P 500 includes 500 blue chip, large cap stocks, which together represent about 75% of the total U.S. equities market. Companies eligible for addition to the S&P 500 have market capitalization of at least US$3.5 billion. The TR Index accounts for the reinvestment of dividends. This report has been prepared from information provided by the Trader and is believed to be reliable. This report should be read in conjunction with each Trader's Disclosure Document or Fund's Offering Document. PAST PERFORMANCE IS NOT NECESSARILY INDICATIVE OF FUTURE RESULTS. TRADING FUTURES AND OPTIONS INVOLVES SUBSTANTIAL RISK OF LOSS AND IS NOT SUITABLE FOR ALL INVESTORS. THERE ARE NO GUARANTEES OF PROFIT NO MATTER WHO IS MANAGING YOUR MONEY. THERE IS AN UNLIMITED RISK OF LOSS IN SELLING OPTIONS. YOU SHOULD CAREFULLY CONSIDER WHETHER COMMODITY FUTURES AND OPTIONS IS SUITABLE FOR YOU IN LIGHT OF YOUR FINANCIAL CONDITION. AN INVESTOR MUST READ AND UNDERSTAND THE MANAGER'S CURRENT DISCLOSURE DOCUMENT BEFORE INVESTING. Capital Trading Group * 440 S. LaSalle, Suite 2301 * Chicago, IL 60605 Toll Free (800) 238-2610 * Direct: (312) 572-6118 Email: nsloane@ctgtrading.com | Web Address: http://www.ctgtrading.com © 1997 - 2016 AutumnGold.com LLC