Property Investment Model
•
0 gostou•826 visualizações

This document outlines an investment model for acquiring, renovating, and renting out a residential property. Key aspects of the model include: - Acquiring a property for $50,500 including fees and renovating it for $28,800. - The renovated property will have 18 rental rooms and be rented out to generate income which increases 10% annually. - Operational costs also increase 10% per year and the property is expected to be sold after 10 years for $472,040, realizing a gain of $238,738. - Financial projections show the investment has a net present value of $685.60, internal rate of return of 30.22%, and pays back in

Recomendados
Mais conteúdo relacionado
Mais procurados
Mais procurados (19)
Semelhante a Property Investment Model
Semelhante a Property Investment Model (20)
Mais de Flevy.com Best Practices
Mais de Flevy.com Best Practices (20)
Último
Último (20)
Property Investment Model
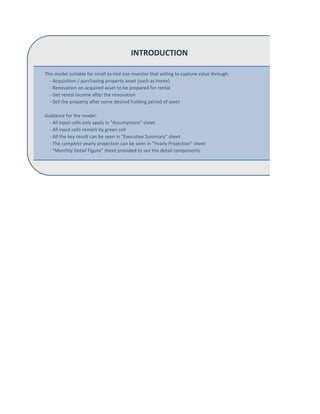
- 1. INTRODUCTION This model suitable for small to mid size investor that willing to capture value through: - Acquisition / purchasing property asset (such as home) - Renovation on acquired asset to be prepared for rental - Get rental income after the renovation - Sell the property after some desired holding period of asset Guidance for the model: - All input cells only apply in "Assumptions" sheet - All input cells remark by green cell - All the key result can be seen in "Executive Summary" sheet - The complete yearly projection can be seen in "Yearly Projection" sheet - "Monthly Detail Figure" sheet provided to see the detail components
- 3. General Assumptions Local Currency Standard Measurement Required rate of return Occupancy Rate Income Tax USD meter 30.00% 80.00% 25.00% Increase in Rental Income /Year Increase in Operational Cost /Year 10.00% 10.00% Acquisition of House (in local currency, unless stated) Market Price Other fees Total Acquisition Value 48,000.00 2,500.00 50,500.00 Using Mortgage for refinancing Mortgage Amount Interest Rate (Effective) Tenor (years) Equity Financing for acquisition Yes 48,000.00 9.00% 20.00 2,500.00 Renovation Figures Room Size 3 x 3 3 x 4 3 x 5 4 x 4 4 x 5 5 x 5 2 x 2 4 x 4 2 x 3 Type Mini Studio Regular Studio Large Studio One Bedroom - Type A One Bedroom - Type B One Bedroom - Type C Public Bathroom Free Space Terrace Number of Room 6 3 0 5 2 2 3 3 3 Rental Income / month (in local currency) Mini Studio Regular Studio Large Studio One Bedroom - Type A One Bedroom - Type B One Bedroom - Type C N/A N/A N/A Other Operating Income Other Operating Income Other Operating Income 100.00 150.00 200.00 250.00 300.00 350.00 - Non-Effective Area No No No No No No Yes Yes Yes Area Outside Building No No No No No No No No Yes
- 4. Operational Cost (in local currency, unless stated) Manpower Cleaning Service Receptionist Security Others Others Number of shift per day 2 1 2 0 0 Other Operational Expense Electricity Water Phone Advertising Stationery Maintenance Others Others Others Others Cost per month 100.00 50.00 10.00 30.00 10.00 10.00 - Number of person per shift 1 1 1 0 0 Salary per person 100.00 150.00 120.00 -
- 5. House specification as per Acquisition House specification after Building Renovation Address: Address: Orchad St #1 Orchad St #1 Land size (in square std measure) Building size (in square std measure) Number of Floor Number of Bedroom Electricity Fixed Line 106.00 175.00 2 floor 9 rooms 2,200 watts 1 line Land size (in square std measure) Building size (in square std measure) Number of Floor Number of Bedroom Electricity Fixed Line Other Notes: Other Notes: Own certificate and heading to the west Own certificate and heading to the west Construction Cost for Building Renovation (in local currency) Civil Works Mechanical & Air Ventilation Interior Design Other Costs Construction started at month Construction period (months) 35.00 35.00 10.00 10.00 1 6 Depreciation (years) Building Depreciation Period Renovation Amortization Period 20 20 Exit Strategy (in local currency, unless stated) Selling at month Cost of Sales Long Term Capital Gain Tax Recaptured Depreciation Tax 120 5.00% 10.00% 8.00% /square meter /square meter /square meter /square meter 106.00 320.00 3 floor 18 rooms 2,200 watts 1 line
- 6. Investment Figure Total Acquisition of Property Renovation of Property Total Investment Mortgage Financing Equity Investment 50,500.00 28,800.00 79,300.00 48,000.00 31,300.00 10-Years Operational Figures Income Statement Rental Income EBITDA EBIT after Other Income Net Profit after Extraordinary Items Cash Flow Statement Cash Flow from Operating Activities Cash Flow from Investing Activities Cash Flow from Financing Activities Net Cash Flow Ending Cash Balance Balance Sheet Total Asset Total Liability Total Equity Mortgage Schedule Mortgage Interest Payment Mortgage Total Payment Mortgage Ending Principal Balance Others Growth in NOI Capitalization Rate Selling Price (PSM* Total Building) Cost Basis after renov (PSM* Total Building) Cost Basis before renov (PSM* Total Building) 0 1 - 14,400.00 10,400.00 7,275.00 2,243.61 (50,500.00) 50,500.00 - 9,652.13 (28,800.00) 23,617.58 4,469.71 4,469.71 50,500.00 48,000.00 2,500.00 80,644.71 47,101.10 33,543.61 48,000.00 (4,283.52) (5,182.42) 47,101.10 0.00% 30.00% 157.81 288.57 0.00% 30.00% 260.00 247.81 288.57
- 7. Exit Figure Holding Period (years) Expected Property Value (Net of Cost of Sales) Realized Gain (Loss) on Property Sale Long-term capital gain on property sale Equity Reversion After Tax 2 10 279,558.28 238,737.86 277,217.44 254,914.90 3 4 5 6 38,016.00 27,456.00 23,491.00 14,468.85 41,817.60 30,201.60 26,236.60 16,597.23 45,999.36 33,221.76 29,256.76 18,938.01 50,599.30 36,543.94 32,578.94 21,512.40 55,659.23 40,198.33 36,233.33 24,343.73 22,633.05 (5,182.42) 17,450.63 21,920.34 24,669.19 (5,182.42) 19,486.77 41,407.11 26,909.09 (5,182.42) 21,726.67 63,133.77 29,373.13 (5,182.42) 24,190.71 87,324.49 32,083.75 (5,182.42) 26,901.33 114,225.82 94,130.34 46,117.87 48,012.46 109,652.11 45,042.42 64,609.69 127,413.77 43,866.08 83,547.70 147,639.49 42,579.38 105,060.10 170,575.82 41,171.99 129,403.83 (4,199.20) (5,182.42) 46,117.87 (4,106.96) (5,182.42) 45,042.42 (4,006.08) (5,182.42) 43,866.08 (3,895.73) (5,182.42) 42,579.38 (3,775.03) (5,182.42) 41,171.99 10.00% 20.00% 429.00 247.81 288.57 10.00% 20.00% 471.90 247.81 288.57 10.00% 20.00% 519.09 247.81 288.57 10.00% 20.00% 571.00 247.81 288.57 10.00% 20.00% 628.10 247.81 288.57
- 8. Feasibilty Figure Net Present Value (NPV) Internal Rate of Return (IRR) Payback Period (Years) Discounted Payback Period (Years) Cash Multiple 685.60 30.22% 4.67 9.96 8.78 7 8 9 10 61,225.15 44,218.16 40,253.16 27,457.62 67,347.66 48,639.98 44,674.98 30,882.29 74,082.43 53,503.98 49,538.98 34,648.75 74,699.78 53,949.84 50,315.26 249,647.78 35,065.62 (5,182.42) 29,883.20 144,109.02 38,345.88 (5,182.42) 33,163.46 177,272.48 41,954.39 (5,182.42) 36,771.97 214,044.46 42,098.75 254,914.90 (39,017.84) 257,995.80 472,040.26 196,494.02 39,632.58 156,861.45 225,692.48 37,948.75 187,743.73 258,499.46 36,106.98 222,392.48 472,040.26 472,040.26 (3,643.01) (5,182.42) 39,632.58 (3,498.60) (5,182.42) 37,948.75 (3,340.64) (5,182.42) 36,106.98 (2,910.87) (39,017.84) - 10.00% 20.00% 690.91 247.81 288.57 10.00% 20.00% 760.00 247.81 288.57 10.00% 20.00% 836.00 247.81 288.57 10.00% 20.00% 919.60 247.81 288.57
- 9. Year Reference 0 1 INCOME STATEMENT Revenue Operational Expense EBITDA Depreciation of Building Amortization of Renovation EBIT Before Other Income Other Income EBIT After Other Income Interest EBT Income Tax Net Profit Before Extraordinary Item Gain / Loss in Selling Property Long Term Capital Gain Tax Recaptured Depreciation Tax Net Profit After Extraordinary Item Note: EBITDA EBIT EBT - 14,400.00 (4,000.00) 10,400.00 (2,525.00) (600.00) 7,275.00 7,275.00 (4,283.52) 2,991.48 (747.87) 2,243.61 2,243.61 : Earnings Before Interest, Tax, Depreciation, and Amortization : Earnings Before Interest and Tax : Earnings Before Tax CASH FLOW STATEMENT Cash Flow from Operating Activities Cash Collection from Rental Income Cash Collection from Other Income Cash Payment for Operational Expense Cash Payment for Tax Total Cash Flow from Operating Activities Cash Flow from Investing Activities Cash Payment for Acquisition Cash Payment for Renovation Cash from Selling Property (Net of Tax) Cash Flow from Investing Activities Cash Flow from Financing Activities Mortgage Principal Borrowing Mortgage Principal Repayment Mortgage Interest Payment Equity Investment - 14,400.00 (4,000.00) (747.87) 9,652.13 (50,500.00) (50,500.00) (28,800.00) (28,800.00) 48,000.00 2,500.00 (898.90) (4,283.52) 28,800.00
- 10. Total Cash Flow from Financing Activities 50,500.00 23,617.58 Net Cash Flow - 4,469.71 Beginning Cash Balance Ending Cash Balance - 4,469.71 BALANCE SHEET Asset Cash Building Accum. Depr & Amort of Building Total Asset Liability Mortgage Total Liability Equity Equity Investment Retained Earning Total Equity Total Liability & Equity 50,500.00 50,500.00 4,469.71 79,300.00 (3,125.00) 80,644.71 48,000.00 48,000.00 47,101.10 47,101.10 2,500.00 2,500.00 50,500.00 OK 31,300.00 2,243.61 33,543.61 80,644.71 OK 48,000.00 48,000.00 OK 48,000.00 (898.90) (4,283.52) (5,182.42) 47,101.10 OK (50,500.00) (50,500.00) (28,800.00) (28,800.00) MORTGAGE SCHEDULE Beginning Principal Balance Principal Borrowing Principal Repayment Interest Payment Total Payment per month Ending Principal Balance PROPERTY VALUATION Investment Acquisition of Property Renovation Total Investment Income Tax Payable Rental Income Other Income Operational Expense True NOI Depreciation & Amortization - 14,400.00 (4,000.00) 10,400.00 (3,125.00)
- 11. Interest Taxable Income Income Tax Payable Cash Flow After Taxes (CFAT) True NOI Debt Service Pretax Cash Flow Income Tax Payable Cash Flow After Taxes (CFAT) Growth in NOI Capitalization Rate Recaptured Depr & LT Cap Gain on Property Sale Selling Price (Fair Value) Cost of Sale Net Selling Price Cost Basis (Land, Building, & Renovation) Accumulated Depreciation Book Value of Property Realized Gain (Loss) on Property Sale Recaptured Depreciation Long-term capital gain on property sale Selling Price (PSM* Total Building) Cost Basis after renov (PSM* Total Building) Cost Basis before renov (PSM* Total Building) *PSM = Per Standard Measure Tax due on Property Sale Tax on Recaptured Depreciation Tax on Long-term capital gain Total tax due on property sale - (4,283.52) 2,991.48 (747.87) - 10,400.00 (5,182.42) 5,217.58 (747.87) 4,469.71 0.00% 30.00% 0.00% 30.00% 50,500.00 50,500.00 (50,500.00) (50,500.00) 83,200.00 (4,160.00) 79,040.00 79,300.00 (3,125.00) 76,175.00 2,865.00 (2,865.00) - 157.81 288.57 260.00 247.81 288.57 5,050.00 5,050.00 (229.20) (229.20) Equity Reversion After Tax (ERAT) Net Selling Price (Fair Value) Outstanding Mortgage Balance Before Tax sales proceeds Taxes due on property sale Equity Reversion After Taxes (ERAT) (48,000.00) (48,000.00) 5,050.00 (42,950.00) 79,040.00 (47,101.10) 31,938.90 (229.20) 31,709.70 Total Cash Flow Accumulated Total Cash Flow Discounted Cash Flow Accumulated Discounted Cash Flow (50,500.00) (50,500.00) (50,500.00) (50,500.00) (24,330.29) (74,830.29) (18,715.61) (69,215.61)
- 12. Net Present Value (NPV) Internal Rate of Return (IRR) Payback Period (years) Discounted Payback Period (years) Cash Multiple 685.60 30.22% 4.67 9.96 8.78
- 33. Month Reference Year Reference 0 0 1 1 INCOME STATEMENT Revenue Mini Studio Regular Studio Large Studio One Bedroom - Type A One Bedroom - Type B One Bedroom - Type C N/A N/A N/A Total Revenue - - Operational Expense Salary Cleaning Service Receptionist Security Others Others Total Salary Electricity Water Phone Advertising Stationery Maintenance Others Others Others Others Total Other Op. Exp Total Op. Expense - - EBITDA - - Depreciation of Building Amortization of Renovation Total Depreciation & Amortization - (210.42) (210.42) EBIT before Other Income Other Operating Income Other Operating Income Other Operating Income Total Other Operating Income - (210.42) -
- 34. EBIT after Other Income - (210.42) Interest - (360.00) EBT - (570.42) Income Tax - 142.60 Net Profit before Extraordinary Item - (427.81) MORTGAGE SCHEDULE Beginning Principal Balance Principal Borrowing Principal Repayment Interest Payment Total Payment per month Ending Principal Balance 48,000.00 48,000.00 48,000.00 (71.87) (360.00) (431.87) 47,928.13 (50,500.00) (50,500.00) (4,800.00) (4,800.00) TOTAL INVESTMENT Acquisition of Property Property Renovation Total Investment