Digital Marketing Planning Spreadsheet
•
2 gostaram•679 visualizações

This Slideshare presentation is a partial preview of the full business document. To view and download the full document, please go here: http://flevy.com/browse/business-document/digital-marketing-planning-spreadsheet-1056 DESCRIPTION The spreadsheet model is designed to help you develop a budget model for campaigns or annual planning. It enables you to performa a "what-if" analysis for varying investment in digital media to see the impact on leads, sales and return on investment.

Recomendados
Mais conteúdo relacionado
Destaque
Destaque (13)
Mais de Flevy.com Best Practices
Mais de Flevy.com Best Practices (20)
Último
Último (20)
Digital Marketing Planning Spreadsheet
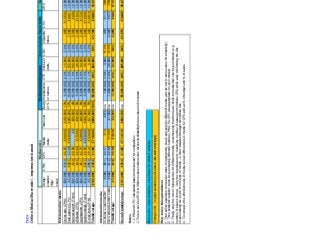
- 1. Home Online Media Mix model - impression based Setup/ creative /Mgt costs CPM CPC Media costs Total cost Budg et % Impressions or names CTR Clicks or visits CRO nOpportu nities CPO CRS nSales % of sales CPS (CPA) External online media Online ads (CPM) £20,000 £10.0 £6.25 £80,000 £100,000 12% 8,000,000 0.2% 16,000 5.0% 800 £125.00 10.0% 80 4% £1,250.0 Paid search (CPC) £5,000 £30.5 £2.00 £300,000 £305,000 37% 10,000,000 1.5% 150,000 5.0% 7,500 £40.67 10.0% 750 36% £406.7 Natural search (Fixed) £30,000 £3.0 £0.30 £0 £30,000 4% 10,000,000 1.0% 100,000 5.0% 5,000 £6.00 10.0% 500 24% £60.0 Affiliates (CPS) £20,000 £4.9 £0.82 £19,200 £39,200 5% 8,000,000 0.6% 48,000 5.0% 2,400 £16.33 10.0% 240 11% £80.0 Aggregators (CPS) £20,000 £6.1 £0.76 £28,800 £48,800 6% 8,000,000 0.8% 64,000 5.0% 3,200 £15.25 10.0% 320 15% £90.0 Sponsorships (Fixed) £10,000 £32.5 £6.50 £250,000 £260,000 32% 8,000,000 0.5% 40,000 5.0% 2,000 £130.00 10.0% 200 9% £1,300.0 E-mail lists (CPM) £5,000 £80.0 £8.41 £32,000 £37,000 5% 400,000 1.1% 4,400 5.0% 220 £168.18 10.0% 22 1% £1,681.8 Total/Average £110,000 £15.6 £1.94 £710,000 £820,000 100% 52,400,000 0.8% 422,400 5.0% 21,120 £38.83 10.0% 2,112 100% £388.3 Internal online media In-house e-mail list/DM £500 £0.1 £0.17 £10 £510 n/a 100,000 3.0% 3,000 15.0% 450 £1.13 30% 135 n/a £3.8 Own-site ads (other footfall) £500 £1.0 £0.08 £1,000 £1,500 n/a 1,000,000 2.0% 20,000 10.0% 2,000 £0.75 25% 500 n/a £3.0 Total/Average £1,000 £1.8 £0.09 £1,010 £2,010 n/a 1,100,000 2.1% 23,000 8.0% 2,450 £0.82 17.0% 635 n/a £3.2 Overall total/Average £111,000 £15.4 £1.85 £711,010 £822,010 n/a 53,500,000 0.8% 445,400 8.6% 23,570 £34.88 18.4% 2,747 n/a £299.2 Notes. 1. CPM and CPC calculated based on total cost for comparison 2. This is not a full ROI or lifetime value model since revnue/profitability/future value not included Media costs Conversion to Opportunity Conversion to SaleMedia volume/response Blue cells = input variables - vary these for 'what-if' analysis Orange cells = output variables (calculated - do not overtype) How to use this spreadsheet 1. First define expected conversion rates to opportunity (lead) and sale for different media (can be set to same value for simplicity). 2. Then establish realistic costs for purchasing different media (CPM,CPA,CPC) as appropriate for your market. 3. Finally vary the mix of impressions for different media, remembering that there are limits to media that can be purchased (e.g. number of search terms). Vary the impressions to maximise number of sales and minimise CPA while also minimising the risk of purchasing too much of one type of media - a more balanced budget diversifies risk. 4. To compare the effectiveness of media look at differences in media for CPS and as % of budget and % of sales.
- 2. Home Online Media Mix model - based on % budget - with example of 'average' clickthrough rates Overall budget £100,000 Average order value £50.00 Gross profit margin 30.0% Setup/ creative /Mgt costs CPM CPC Media costs Total cost Budget % Impressions or names CTR Clicks or visits CRO nOpportu nities CPO CRS nSales % of sales CPS (CPA) Total revenue Cost of goods sold Media costs Total costs (inc media) Profit Return on Investment External online media Online ad buys (CPM) £0 £10.0 £5.00 £10,000 £10,000 10% 1,000,000 0.2% 2,000 100.0% 2,000 £5.00 10.0% 200 1% £50.0 £10,000.00 £7,000 £10,000 £17,000 -£7,000.00 -41.2% Ad network (CPC) £0 £20.0 £1.00 £20,000 £20,000 20% 1,000,000 2.0% 20,000 100.0% 20,000 £1.00 10.0% 2,000 7% £10.0 £100,000.00 £70,000 £20,000 £90,000 £10,000.00 11.1% Paid search (CPC) £0 £4.0 £0.20 £30,000 £30,000 30% 7,500,000 2.0% 150,000 100.0% 150,000 £0.20 10.0% 15,000 52% £2.0 £750,000.00 £525,000 £30,000 £555,000 £195,000.00 35.1% Natural search (Fixed) £0 £0.5 £0.05 £5,000 £5,000 5% 10,000,000 1.0% 100,000 100.0% 100,000 £0.05 10.0% 10,000 35% £0.5 £500,000.00 £350,000 £5,000 £355,000 £145,000.00 40.8% Affiliates (CPS) £0 £10.0 £1.00 £5,000 £5,000 5% 500,000 1.0% 5,000 100.0% 5,000 £1.00 10.0% 500 2% £10.0 £25,000.00 £17,500 £5,000 £22,500 £2,500.00 11.1% Aggregators (CPS) £0 £0.0 £0.00 £0 £0 0% 0 1.0% 0 100.0% 0 £0.00 10.0% 0 0% £20.0 £0.00 £0 £0 £0 £0.00 #DIV/0! Sponsorships (Fixed) £0 £100.0 £33.33 £10,000 £10,000 10% 100,000 0.3% 300 100.0% 300 £33.33 10.0% 30 0% £333.3 £1,500.00 £1,050 £10,000 £11,050 -£9,550.00 -86.4% Online PR (Fixed) £0 £100.0 £10.00 £10,000 £10,000 10% 100,000 1.0% 1,000 100.0% 1,000 £10.00 10.0% 100 0% £100.0 £5,000.00 £3,500 £10,000 £13,500 -£8,500.00 -63.0% E-mail lists (CPM) £0 £10.0 £1.00 £10,000 £10,000 10% 1,000,000 1.0% 10,000 100.0% 10,000 £1.00 10.0% 1,000 3% £10.0 £50,000.00 £35,000 £10,000 £45,000 £5,000.00 11.1% Total/Average £0 £4.7 £0.35 £100,000 £100,000 100% 21,200,000 1.4% 288,300 100.0% 288,300 £0.35 10.0% 28,830 100% £3.5 £1,441,500.00 £1,009,050 £100,000 £1,109,050 £332,450.00 30.0% £0.00 #DIV/0! Internal online media £0.00 #DIV/0! In-house e-mail list/DM £1,000 £0.0 £0.33 £0 £1,000 n/a 100,000 3.0% 3,000 15.0% 450 £2.22 30% 135 n/a £7.4 £6,750.00 £4,725 £1,000 £5,725 £1,025.00 17.9% Own-site ads (other footfall) £1,000 £0.0 £0.05 £0 £1,000 n/a 1,000,000 2.0% 20,000 10.0% 2,000 £0.50 25% 500 n/a £2.0 £25,000.00 £17,500 £1,000 £18,500 £6,500.00 35.1% Total/Average £2,000 £1.8 £0.09 £0 £2,000 n/a 1,100,000 2.1% 23,000 70.8% 2,450 £0.82 15.8% 635 n/a £3.1 £31,750.00 £22,225 £2,000 £24,225 £7,525.00 31.1% £0.00 #DIV/0! Overall total/Average £2,000 £4.6 £0.33 £100,000 £102,000 n/a 22,300,000 1.4% 311,300 59.2% 290,750 £0.35 18.2% 29,465 n/a £3.5 £1,473,250.00 £1,031,275 £102,000 £1,133,275 £339,975.00 30.0% Notes. 1. CPM and CPC calculated based on total cost for comparison 2. This is not a full ROI or lifetime value model since revenue/profitability/future value not included 3. For SEO, budget is automatically placed into setup/creative costs and you have to estimate the number of clicks this will deliver. 4. For affiliate marketing, work back from Cost per sale to calculate sales, opportunities and clicks, so changing clickthrough and conversion rates impacts cells to left rather than right. 5. The blue cells indicate the main control parameters for each media which are important to improving cost effectiveness Media costs Conversion to Opportunity Conversion to SaleMedia volume/response Blue cells = input variables - vary these for 'what-if' analysis Orange cells = output variables (calculated - do not overtype) How to use this spreadsheet 1. First define expected conversion rates to opportunity (lead) and sale for different media (can be set to same value for simplicity). 2. Then establish realistic costs for purchasing different media (CPM,CPA,CPC) as appropriate for your market. 3. Finally vary the mix of impressions for different media, remembering that there are limits to media that can be purchased (e.g. number of search terms). Vary the impressions to maximise number of sales and minimise CPA while also minimising the risk of purchasing too much of one type of media - a more balanced budget diversifies risk. 4. To compare the effectiveness of media look at differences in media for CPS and as % of budget and % of sales. Costs Costs Revenue Profitability This document is a partial preview. Full document download can be found on Flevy: http://flevy.com/browse/document/digital-marketing-planning-spreadsheet-1056
- 3. Home Online Media Mix model - based on % budget - with example of 'average' clickthrough rates Input Overall budget £100,000 parameter Average order value £50 table Gross profit margin 30.0% All digital media channels Full total Ad buys (CPM) Ad network (CPM) Paid search (CPC) Natural search Affiliates (CPA) Aggregators (CPA) Sponsorshi p (Fixed) Email list (CPM) Total or Average House list Site promo banners Total External and internal Setup/ creative / Mgt costs £0 £0 £0 £0 £0 £0 £0 £0 £0 £0 £0 £0 £0 CPM £10.0 £10.0 £4.0 £0.4 £10.0 £20.0 £100.0 £10.0 £2.8 £0.0 £0.0 £0.0 £2.8 Media costs CPC £5.0 £5.0 £0.20 £0.20 £5.0 £10.0 £33.3 £100.0 £0.5 £0.0 £0.0 £0.0 £0.5 Media costs £10,000 £10,000 £30,000 £10,000 £10,000 £10,000 £10,000 £10,000 £100,000 £0 £0 £0 £100,000 Total cost:setup & media £10,000 £10,000 £30,000 £10,000 £10,000 £10,000 £10,000 £10,000 £100,000 £0 £0 £0 £100,000 Budget % 10% 10% 30% 10% 10% 10% 10% 10% 100% N/A N/A N/A NA Media impressions Impressions or names 1,000,000 1,000,000 7,500,000 25,000,000 1,000,000 500,000 100,000 10,000 36,110,000 10,000 100,000 110,000 36,220,000 & CTR 0.2% 0.2% 2.0% 0.2% 0.2% 0.2% 0.3% 1.0% 0.6% 0.2% 0.2% 0.2% 0.6% Response Clicks or site visits 2,000 2,000 150,000 50,000 2,000 1,000 300 100 207,400 20 200 220 207,620 Conversion Conversion rate to opportunity 100.0% 100.0% 100.0% 100.0% 100.0% 100.0% 100.0% 100.0% 100.0% 100.0% 100.0% 100.0% 100.0% to Number of opportunities 2,000 2,000 150,000 50,000 2,000 1,000 300 100 207,400 20 200 220 207,620 Opportunity (Lead) Cost per opportunity £5.0 £5.0 £0.2 £0.2 £5.0 £10.0 £33.3 £100.0 £0.5 £0.0 £0.0 £0.0 £0.5 Conversion Conversion rate to sale 100.0% 100.0% 100.0% 100.0% 50.0% 100.0% 100.0% 100.0% 93.8% 100.0% 100.0% 100.0% 93.0% to Number of sales 2,000 2,000 150,000 50,000 1,000 1,000 300 100 206,400 20 200 220 206,620 Sales % of sales 1.0% 1.0% 72.7% 24.2% 0.5% 0.5% 0.1% 0.0% 100.0% NA NA NA NA Cost per sale (CPA) £5.0 £5.0 £0.2 £0.2 £10.0 £10.0 £33.3 £100.0 £0.5 £0.0 £0.0 £0.0 £0.5 Revenue Total revenue £100,000 £100,000 £7,500,000 £2,500,000 £50,000 £50,000 £15,000 £5,000 £10,320,000 £1,000 £10,000 £11,000 £10,331,000 Cost of goods sold £70,000 £70,000 £5,250,000 £1,750,000 £35,000 £35,000 £10,500 £3,500 £7,224,000 £700 £7,000 £7,700 £7,231,700 Costs Media costs £10,000 £10,000 £30,000 £10,000 £10,000 £10,000 £10,000 £10,000 £100,000 £0 £0 £0 £100,000 Total costs (inc media) £80,000 £80,000 £5,280,000 £1,760,000 £45,000 £45,000 £20,500 £13,500 £7,324,000 £700 £7,000 £7,700 £7,331,700 Profitability Profit £20,000 £20,000 £2,220,000 £740,000 £5,000 £5,000 -£5,500 -£8,500 £2,996,000 £300 £3,000 £3,300 £2,999,300 Return on Investment 25.0% 25.0% 42.0% 42.0% 11.1% 11.1% -26.8% -63.0% 40.9% 42.9% 42.9% 42.9% 40.9% Note: 1. CPM and CPC calculated based on total cost for comparison 2. This is not a full ROI or lifetime value model since future lifetime value not included 3. For SEO, budget is automatically placed into setup/creative costs and you have to estimate the number of clicks this will deliver. 4. For affiliate marketing, work back from Cost per sale to calculate sales, opportunities and clicks, so changing clickthrough and conversion rates impacts cells to left rather than right. 5. The blue cells indicate the main control parameters for each media which are important to improving cost effectiveness Search How to use this spreadsheet 1. First define expected conversion rates to opportunity (lead) and sale for different media (can be set to same value for simplicity). 2. Then establish realistic costs for purchasingdifferent media (CPM,CPA,CPC) as appropriate for your market. 3. Finally vary the mix of impressions for different media, remembering that there are limits to media that can be purchased (e.g. number of search terms). Vary the impressions to maximise number of sales and minimise CPA while also minimising the risk of purchasing too much of one type of media - a more balanced budget diversifies risk. 4. To compare the effectiveness of media look at differences in media for CPS and as % of budgetand % of sales. Advertising Partners Internal Blue cells = input variables - vary these for 'what-if' analysis Orange cells = output variables (calculated - do not overtype) This document is a partial preview. Full document download can be found on Flevy: http://flevy.com/browse/document/digital-marketing-planning-spreadsheet-1056
- 4. 1 Flevy (www.flevy.com) is the marketplace for premium documents. These documents can range from Business Frameworks to Financial Models to PowerPoint Templates. Flevy was founded under the principle that companies waste a lot of time and money recreating the same foundational business documents. Our vision is for Flevy to become a comprehensive knowledge base of business documents. All organizations, from startups to large enterprises, can use Flevy— whether it's to jumpstart projects, to find reference or comparison materials, or just to learn. Contact Us Please contact us with any questions you may have about our company. • General Inquiries support@flevy.com • Media/PR press@flevy.com • Billing billing@flevy.com