1. .
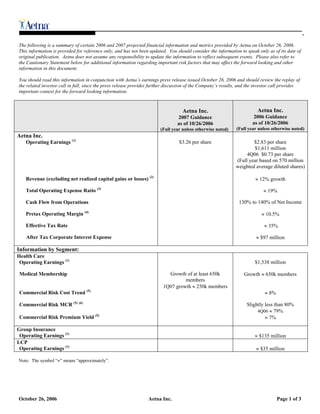
The following is a summary of certain 2006 and 2007 projected financial information and metrics provided by Aetna on October 26, 2006.
This information is provided for reference only, and has not been updated. You should consider the information to speak only as of its date of
original publication. Aetna does not assume any responsibility to update the information to reflect subsequent events. Please also refer to
the Cautionary Statement below for additional information regarding important risk factors that may affect the forward looking and other
information in this document.
You should read this information in conjunction with Aetna’s earnings press release issued October 26, 2006 and should review the replay of
the related investor call in full, since the press release provides further discussion of the Company’s results, and the investor call provides
important context for the forward looking information.
Aetna Inc.
Aetna Inc.
2006 Guidance
2007 Guidance
as of 10/26/2006
as of 10/26/2006
(Full year unless otherwise noted)
(Full year unless otherwise noted)
Aetna Inc.
Operating Earnings (1) $3.26 per share $2.83 per share
$1,611 million
4Q06 $0.73 per share
(Full year based on 570 million
weighted average diluted shares)
≈ 12% growth
Revenue (excluding net realized capital gains or losses) (2)
≈ 19%
Total Operating Expense Ratio (3)
130% to 140% of Net Income
Cash Flow from Operations
≈ 10.5%
Pretax Operating Margin (4)
≈ 35%
Effective Tax Rate
≈ $97 million
After Tax Corporate Interest Expense
Information by Segment:
Health Care
Operating Earnings (1) $1,538 million
Growth ≈ 650k members
Growth of at least 650k
Medical Membership
members
1Q07 growth ≈ 250k members
≈ 8%
Commercial Risk Cost Trend (5)
Commercial Risk MCR (5) (6) Slightly less than 80%
4Q06 ≈ 79%
≈ 7%
Commercial Risk Premium Yield (5)
Group Insurance
≈ $135 million
Operating Earnings (1)
LCP
≈ $35 million
Operating Earnings (1)
Note: The symbol “≈” means “approximately”.
October 26, 2006 Aetna Inc. Page 1 of 3
2. .
Footnotes
(1) Projected full year 2006 operating earnings and operating earnings per share exclude the following after tax net realized capital gains
reported by the Company for the nine months ended September 30, 2006: Aetna Inc. $14.2 million; Health Care $1.5 million; Group Insurance
$2.7 million and Large Case Pensions $10.0 million. Projected 4Q 2006 and full year 2006 and 2007 operating earnings and operating earnings
per share also exclude any future net realized capital gains or losses from income from continuing operations. The Company is not able to
project the amount of future net realized capital gains or losses and therefore cannot reconcile projected operating earnings to projected income
from continuing operations or to a projected change in income from continuing operations in any period. Although the excluded items may
recur, management believes that operating earnings and operating earnings per share provide a more useful comparison of the Company’s
underlying business performance from period to period. Net realized capital gains or losses arise from various types of transactions primarily
in the course of managing a portfolio of assets that support the payment of liabilities. However, these transactions do not directly relate to the
underwriting or servicing of products for customers and are not directly related to the core performance of the Company’s business operations.
In addition, management uses operating earnings to assess business performance and to make decisions regarding the Company’s operations
and allocation of resources among the Company’s businesses.
Projected full year 2006 operating earnings and operating earnings per share for Aetna Inc. also exclude the following other items:
• The release of reserves of $75.0 million, after tax, for second quarter 2006 for anticipated future losses on discontinued products which
represents a reduction of reserves previously established for certain products no longer offered by the Company and does not benefit
ongoing business operations. This other item is also excluded from the projected full year 2006 operating earnings for the Large Case
Pensions segment.
• A debt refinancing charge of $8.1 million, after tax ($12.4 million pretax), represents the net charge from the write-off of debt issuance
costs and the recognition of deferred gains on terminated interest rate swaps in connection with the redemption of the Company’s 8.5
percent senior notes due 2041. This is an other item in the second quarter of 2006 and does not reflect underlying 2006 business
performance. This other item is also excluded from the projected full year 2006 operating earnings for the Health Care segment.
• The write off of a $47.1 million, after tax ($72.4 million pretax), insurance recoverable related to a prior-year physician class action
settlement as a result of a trial court summary judgment ruling. This is an other item in the second quarter of 2006 and does not reflect
underlying 2006 business performance. This other item is also excluded from the projected full year 2006 operating earnings for the
Health Care segment.
• An acquisition-related software charge of approximately $6.2 million, after tax ($8.3 million pre-tax), represents the impairment of
previously capitalized software due to the acquisition of a more multifunctional system. This is an other item in the first quarter of 2006
and does not reflect underlying 2006 business performance. This other item is also excluded from the projected full year 2006 operating
earnings for the Group Insurance segment.
Projected operating earnings and operating earnings per share for Aetna Inc. and the Health Care segment exclude reported and any future
development of prior periods’ health care cost estimates. The Company believes excluding this reserve development better reflects the
underlying current-period health care costs.
(2) Revenue excludes net realized capital gains or losses (pretax), which are included in reported GAAP revenue. Full year 2005 revenue of
$22.5 billion excludes net realized capital gains (pretax) of $32.3 million; GAAP revenue was $22.5 billion. The projected full year 2006
revenue excludes net realized capital gains (pretax) of $21.9 million reported by the Company for the nine months ended September 30, 2006.
The Company cannot reconcile the projected 2006 revenue to GAAP revenue as it cannot project net realized capital gains or losses. The
Company may from time to time project revenue for the segments which cannot be reconciled for the same reasons.
(3) The operating expense ratio is calculated by dividing operating expenses excluding other items (refer to footnote 1) by total revenue
excluding net realized capital gains or losses. The Company cannot reconcile the projected operating expense ratio to a comparable GAAP
measure, as it cannot project net realized capital gains or losses.
(4) Pretax operating margins are calculated by dividing pretax operating earnings, excluding net realized capital gains or losses, interest
expense and amortization of other acquired intangible assets by total revenue excluding net realized capital gains or losses. Projected pretax
operating margin also excludes reported and any future development of prior periods’ health care cost estimates (refer to footnote 1). The
Company cannot reconcile the projected pretax operating margins to a comparable GAAP measure, as it cannot project net realized capital
gains or losses.
(5) Commercial Risk includes all medical, dental, and other health care risk products except Medicare and Medicaid. Risk includes all medical,
dental, and other health care products for which the Company assumes all or a majority of health care cost, utilization or other risk.
(6) Projected Commercial Risk MCR excludes reported and any future development of prior periods’ health care cost estimates (refer to
footnote 1).
October 26, 2006 Aetna Inc. Page 2 of 3
3. .
ADDITIONAL INFORMATION; CAUTIONARY STATEMENT – Certain information in this document is forward looking, including
our projections as to operating earnings, commercial risk cost trend, commercial risk MCR and membership and all of the other
information in the table on the first page of this document. Forward-looking information is based on management's estimates,
assumptions and projections, and is subject to significant uncertainties and other factors, many of which are beyond Aetna's control,
such as the increasing competitiveness we are experiencing in certain markets which could cause our membership to be lower than we
expect and our medical cost ratios to be higher than we expect. Important risk factors could cause actual future results and other future
events to differ materially from those currently estimated by management. Those risk factors include, but are not limited to:
unanticipated increases in medical costs (including increased medical utilization, increased pharmacy costs, increases resulting from
unfavorable changes in contracting or re-contracting with providers, changes in membership mix to lower-premium or higher-cost
products or membership-adverse selection; as well as changes in medical cost estimates due to the necessary extensive judgment that is
used in the medical cost estimation process, the considerable variability inherent in such estimates, and the sensitivity of such estimates
to changes in medical claims payment patterns and changes in medical cost trends); decreases in membership or failure to achieve
desired membership growth due to significant competition, reputational issues or other factors in key geographic markets where
membership is concentrated; the ability to reduce administrative expenses while maintaining targeted levels of service and operating
performance, and to improve relations with providers while taking actions to reduce medical costs; the ability to successfully implement
multiple strategic and operational initiatives simultaneously; lower levels of investment income from continued low interest rates;
adverse government regulation (including legislative proposals eliminating or reducing ERISA pre-emption of state laws that would
increase potential litigation exposure, and other proposals, such as patients' rights legislation, that would increase potential litigation
exposure or mandate coverage of certain health benefits); adverse pricing actions by government payors; changes in size, product mix
and medical cost experience of membership in key markets; our ability to integrate, simplify, and enhance our existing information
technology systems and platforms to keep pace with changing customer and regulatory needs; and the outcome of various litigation and
regulatory matters, including litigation and ongoing reviews of business practices by various regulatory authorities (including the
current industry wide investigation into insurance brokerage practices concerning broker compensation arrangements, bid quoting
practices and potential antitrust violations being conducted by the New York Attorney General, the Connecticut Attorney General and
others, and for which the Company has received and may receive subpoenas, and related litigation); and increases in medical costs or
Group Insurance claims resulting from any acts of terrorism, epidemics or other extreme events. For more discussion of important risk
factors that may materially affect Aetna, please see the risk factors contained in Aetna's 2005 Annual Report on Form 10-K, on file with
the Securities and Exchange Commission. You also should read Aetna's 2005 Annual Report on Form 10-K and Aetna's 2006 third
quarter report on Form 10-Q when filed with the Securities and Exchange Commission for a discussion of Aetna's historical results of
operations and financial condition.
###
October 26, 2006 Aetna Inc. Page 3 of 3