Mais conteúdo relacionado
Semelhante a Net Income and EPS Bridge 2004 (20)
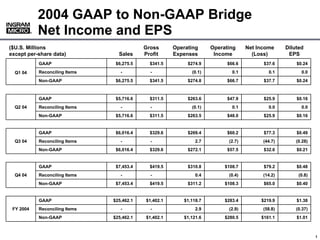
Net Income and EPS Bridge 2004
- 1. 2004 GAAP to Non-GAAP Bridge
Net Income and EPS
®
®
($U.S. Millions Gross Operating Operating Net Income Diluted
except per-share data) Sales Profit Expenses Income (Loss) EPS
GAAP $6,275.5 $341.5 $274.9 $66.6 $37.6 $0.24
Reconciling Items - - (0.1) 0.1 0.1 0.0
Q1 04
Non-GAAP $6,275.5 $341.5 $274.8 $66.7 $37.7 $0.24
GAAP $5,716.6 $311.5 $263.6 $47.9 $25.9 $0.16
Q2 04 Reconciling Items - - (0.1) 0.1 0.0 0.0
Non-GAAP $5,716.6 $311.5 $263.5 $48.0 $25.9 $0.16
GAAP $6,016.4 $329.6 $269.4 $60.2 $77.3 $0.49
Q3 04 Reconciling Items - - 2.7 (2.7) (44.7) (0.28)
Non-GAAP $6,016.4 $329.6 $272.1 $57.5 $32.6 $0.21
GAAP $7,453.4 $419.5 $310.8 $108.7 $79.2 $0.48
Q4 04 Reconciling Items - - 0.4 (0.4) (14.2) (0.8)
Non-GAAP $7,453.4 $419.5 $311.2 $108.3 $65.0 $0.40
GAAP $25,462.1 $1,402.1 $1,118.7 $283.4 $219.9 $1.38
FY 2004 Reconciling Items - - 2.9 (2.9) (58.8) (0.37)
Non-GAAP $25,462.1 $1,402.1 $1,121.6 $280.5 $161.1 $1.01
000000_1
1