Mais conteúdo relacionado
Semelhante a Net Income and EPS Bridge 2003 (20)
Net Income and EPS Bridge 2003
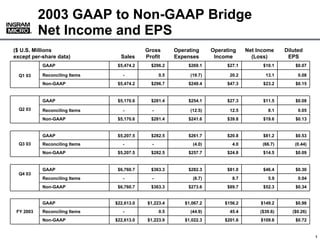
- 1. 2003 GAAP to Non-GAAP Bridge
Net Income and EPS
®
®
($ U.S. Millions Gross Operating Operating Net Income Diluted
except per-share data) Sales Profit Expenses Income (Loss) EPS
GAAP $5,474.2 $296.2 $269.1 $27.1 $10.1 $0.07
Reconciling Items - 0.5 (19.7) 20.2 13.1 0.08
Q1 03
Non-GAAP $5,474.2 $296.7 $249.4 $47.3 $23.2 $0.15
GAAP $5,170.6 $281.4 $254.1 $27.3 $11.5 $0.08
Q2 03 Reconciling Items - - (12.5) 12.5 8.1 0.05
Non-GAAP $5,170.6 $281.4 $241.6 $39.8 $19.6 $0.13
GAAP $5,207.5 $282.5 $261.7 $20.8 $81.2 $0.53
Q3 03 Reconciling Items - - (4.0) 4.0 (66.7) (0.44)
Non-GAAP $5,207.5 $282.5 $257.7 $24.8 $14.5 $0.09
GAAP $6,760.7 $363.3 $282.3 $81.0 $46.4 $0.30
Q4 03
Reconciling Items - - (8.7) 8.7 5.9 0.04
Non-GAAP $6,760.7 $363.3 $273.6 $89.7 $52.3 $0.34
GAAP $22,613.0 $1,223.4 $1,067.2 $156.2 $149.2 $0.98
FY 2003 Reconciling Items - 0.5 (44.9) 45.4 ($39.6) ($0.26)
Non-GAAP $22,613.0 $1,223.9 $1,022.3 $201.6 $109.6 $0.72
000000_1
1