SlideShare uma empresa Scribd logo
1 de 6
Baixar para ler offline
TRIBUNE COMPANY
                                   FIRST QUARTER RESULTS OF OPERATIONS (Unaudited)
                                            (In thousands, except per share data)


                                                                          FIRST QUARTER (A)
                                                                                                  %
                                                                  2005             2004         Change

OPERATING REVENUES                                            $   1,315,744    $ 1,332,317          (1.2)
OPERATING EXPENSES                                                1,063,687      1,059,042           0.4

OPERATING PROFIT (B)                                               252,057         273,275          (7.8)

Net Income (Loss) on Equity Investments                                 471         (4,373)          NM
Interest Income                                                       1,082          1,276         (15.2)
Interest Expense                                                    (35,091)       (46,677)        (24.8)
Non-Operating Items (C)                                              (3,843)       (26,579)          NM

Income Before Income Taxes                                         214,676         196,922           9.0

Income Taxes (C)                                                    (71,829)       (76,241)         (5.8)

NET INCOME                                                         142,847         120,681         18.4

Preferred Dividends                                                  (2,090)        (2,077)          0.6

Net Income Attributable to Common Shares                      $    140,757     $   118,604         18.7

EARNINGS PER SHARE

   Basic                                                      $          .44   $          .36      22.2

   Diluted (D)                                                $          .44   $          .35      25.7

DIVIDENDS PER COMMON SHARE                                    $          .18   $          .12      50.0

Diluted Weighted Average Common Shares Outstanding (E)             320,366         336,094          (4.7)


                                                         6
(A)   2005 first quarter: Dec. 27, 2004 to March 27, 2005. (13 weeks)
      2004 first quarter: Dec. 29, 2003 to March 28, 2004. (13 weeks)

(B)   Operating profit excludes interest income and expense, equity income and losses, non-operating items and income taxes.

(C)   The first quarter of 2005 included the following non-operating items:
                                                                                Pretax            After-tax
                                                                              Gain (Loss)        Gain (Loss)      Diluted EPS

      Loss on derivatives and related investments (1)                       $       (2,252)     $      (1,374)        $   -
      Gain on sales of investments                                                   1,108                676             -
      Loss on investment write-downs and other                                      (2,699)            (1,646)            -
      Income tax settlement adjustments (2)                                            -               11,829             .03
      Total non-operating items                                             $       (3,843)     $       9,485         $   .03

      The first quarter of 2004 included the following non-operating items:
                                                                                Pretax            After-tax
                                                                              Gain (Loss)        Gain (Loss)      Diluted EPS

      Loss on derivatives and related investments (1)                       $      (45,501)     $     (27,755)        $   (.09)
      Gain on sales of investments (3)                                              21,518             13,126              .04
      Loss on investment write-downs and other                                      (2,596)            (1,584)             -
      Total non-operating items                                             $      (26,579)     $     (16,213)        $   (.05)

      (1) Loss on derivatives and related investments represents the net change in fair values of the Company's PHONES
          derivatives and related Time Warner shares.

      (2) In the first quarter of 2005, the Company reduced its income tax expense and liabilities by a total of $12 million as
          a result of favorably resolving certain federal income tax issues.

      (3) In the first quarter of 2004, gain on sales of investments relates primarily to the sale of the Company's
          50% interest in La Opinion .

(D)   For the first quarters of 2005 and 2004, weighted average common shares outstanding used in the calculation of diluted
      EPS were adjusted for the dilutive effect of stock options. The Company's Series C, D-1 and D-2 convertible preferred
      shares were not included in the calculation of diluted EPS for the first quarter of either year because their effects were
      antidilutive. Following are the calculations for the first quarter:

                                                                                     First Quarter
                                                                                 2005              2004

      Net income                                                            $     142,847       $    120,681
      Dividends for Series C, D-1 and D-2 preferred stock                          (2,090)            (2,077)
      Net income attributable to common shares                              $     140,757       $    118,604

      Weighted average common shares outstanding                                  317,307            329,303
      Assumed exercise of stock options, net of common
       shares assumed repurchased                                                    3,059              6,791
      Adjusted weighted average common
       shares outstanding                                                         320,366            336,094

      Diluted earnings per share                                             $          .44      $        .35

(E)   The number of common shares outstanding, in thousands, at March 27, 2005 was 317,515.


                                                               7
TRIBUNE COMPANY
                                  FIRST QUARTER BUSINESS SEGMENT DATA (Unaudited)
                                                   (In thousands)


                                                                     FIRST QUARTER
                                                                                         %
                                                         2005              2004        Change
PUBLISHING
   Operating Revenues                                $ 1,005,512       $ 1,003,583          0.2
   Cash Operating Expenses (A)                          (762,327)         (768,942)        (0.9)
   Operating Cash Flow (B) (C)                           243,185           234,641          3.6
   Depreciation and Amortization Expense                 (44,646)          (45,093)        (1.0)
   Total Operating Profit (C)                        $   198,539       $   189,548          4.7

BROADCASTING AND ENTERTAINMENT
   Operating Revenues
    Television                                       $   290,089       $   306,439         (5.3)
    Radio/Entertainment                                   20,143            22,295         (9.7)
    Total Operating Revenues                             310,232           328,734         (5.6)

    Cash Operating Expenses (A)
     Television                                          (190,970)         (192,277)       (0.7)
     Radio/Entertainment (D)                              (39,450)          (26,742)       47.5
     Total Cash Operating Expenses (D)                   (230,420)         (219,019)        5.2

    Operating Cash Flow (B) (C)
     Television                                            99,119          114,162        (13.2)
     Radio/Entertainment                                  (19,307)          (4,447)         NM
     Total Operating Cash Flow                             79,812          109,715        (27.3)

    Depreciation and Amortization Expense
     Television                                           (11,678)          (11,759)       (0.7)
     Radio/Entertainment                                   (1,168)           (1,337)      (12.6)
     Total Depreciation and Amortization Expense          (12,846)          (13,096)       (1.9)

    Operating Profit (Loss) (C)
     Television                                            87,441          102,403        (14.6)
     Radio/Entertainment                                  (20,475)          (5,784)         NM
     Total Operating Profit                          $     66,966      $    96,619        (30.7)

CORPORATE EXPENSES
   Operating Cash Flow (B) (C)                       $    (13,047)     $    (12,471)        4.6
   Depreciation and Amortization Expense                     (401)             (421)       (4.8)
   Total Operating Loss (C)                          $    (13,448)     $    (12,892)        4.3

CONSOLIDATED
   Operating Revenues                                $ 1,315,744       $ 1,332,317         (1.2)
   Cash Operating Expenses (A)                         (1,005,794)       (1,000,432)        0.5
   Operating Cash Flow (B) (C)                            309,950           331,885        (6.6)
   Depreciation and Amortization Expense                  (57,893)          (58,610)       (1.2)
   Total Operating Profit (C)                        $    252,057      $    273,275        (7.8)


                                                         8
(A) The Company uses cash operating expenses to evaluate internal performance. The Company has presented cash operating expenses
    because it is a common measure used by rating agencies, financial analysts and investors. Cash operating expenses are not a measure of
    financial performance under generally accepted accounting principles (quot;GAAPquot;) and should not be considered in isolation or as a
    substitute for measures of performance prepared in accordance with GAAP.

    Following is a reconciliation of operating expenses to cash operating expenses for the first quarter of 2005:


                                                                                  Broadcasting and
                                                                   Publishing      Entertainment          Corporate      Consolidated

    Operating expenses                                            $     806,973      $     243,266       $     13,448    $ 1,063,687
    Less: depreciation and amortization expense                          44,646             12,846                401         57,893
    Cash operating expenses                                       $     762,327      $     230,420       $     13,047    $ 1,005,794

    Following is a reconciliation of operating expenses to cash operating expenses for the first quarter of 2004:

                                                                                  Broadcasting and
                                                                   Publishing      Entertainment          Corporate      Consolidated

    Operating expenses                                            $     814,035      $     232,115       $     12,892    $ 1,059,042
    Less: depreciation and amortization expense                          45,093             13,096                421         58,610
    Cash operating expenses                                       $     768,942      $     219,019       $     12,471    $ 1,000,432

(B) Operating cash flow is defined as operating profit before depreciation and amortization. The Company uses operating cash flow
    along with operating profit and other measures to evaluate the financial performance of the Company's business segments. The
    Company has presented operating cash flow because it is a common alternative measure of financial performance used by rating
    agencies, financial analysts and investors. These groups use operating cash flow along with other measures as a way to estimate the
    value of a company. The Company's definition of operating cash flow may not be consistent with that of other companies.
    Operating cash flow does not represent cash provided by operating activities as reflected in the Company's consolidated statements
    of cash flows, is not a measure of financial performance under GAAP and should not be considered in isolation or as a substitute for
    measures of performance prepared in accordance with GAAP.

(C) Operating profit for each segment excludes interest income and expense, equity income and losses, non-operating items and
    income taxes.

    Following is a reconciliation of operating profit (loss) to operating cash flow for the first quarter of 2005:

                                                                                  Broadcasting and
                                                                   Publishing      Entertainment          Corporate      Consolidated

    Operating profit (loss)                                       $     198,539      $      66,966       $    (13,448)   $   252,057
    Add back: depreciation and amortization expense                      44,646             12,846                401         57,893
    Operating cash flow                                           $     243,185      $      79,812       $    (13,047)   $   309,950

    Following is a reconciliation of operating profit (loss) to operating cash flow for the first quarter of 2004:

                                                                                  Broadcasting and
                                                                   Publishing      Entertainment          Corporate      Consolidated

    Operating profit (loss)                                       $     189,548      $      96,619       $    (12,892)   $   273,275
    Add back: depreciation and amortization expense                      45,093             13,096                421         58,610
    Operating cash flow                                           $     234,641      $     109,715       $    (12,471)   $   331,885

(D) Broadcasting and entertainment cash operating expenses for the first quarter of 2005 include $13.5 million related to the Chicago Cubs
    trade of Sammy Sosa.


                                                                        9
TRIBUNE COMPANY
                                                     SUMMARY OF REVENUES (Unaudited)
                                                For Period 3 and First Quarter Ended March 27, 2005
                                                                   (In thousands)


                                                                    Period 3 (4 weeks)                               First Quarter (13 weeks)
                                                                                             %                                                    %
                                                             2005             2004         Change             2005              2004            Change
Publishing
    Advertising
                                                         $    96,248     $        97,793                 $    301,754      $    294,868
         Retail                                                                              (1.6)                                                   2.3
         National                                             60,372              63,773     (5.3)            206,509           207,667             (0.6)
         Classified                                           88,753              89,151     (0.4)            279,726           272,188              2.8

          Sub-Total (A)                                      245,373          250,717        (2.1)            787,989           774,723              1.7
                                                              46,598           51,650
     Circulation                                                                             (9.8)            151,716           165,903             (8.6)
     Other                                                    21,210           20,637         2.8              65,807            62,957              4.5

     Segment Total                                           313,181          323,004        (3.0)           1,005,512         1,003,583            0.2

Broadcasting & Entertainment
    Television                                                95,503          102,247        (6.6)            290,089           306,439             (5.3)
                                                              10,056           10,349
    Radio/Entertainment                                                                      (2.8)             20,143            22,295             (9.7)

                                                             105,559          112,596                         310,232           328,734
     Segment Total                                                                           (6.2)                                                  (5.6)

                                                         $ 418,740       $ 435,600           (3.9)       $ 1,315,744       $ 1,332,317              (1.2)
Consolidated Revenues


(A) Publishing advertising revenues for 2004 have been reclassified to conform with the 2005 presentation. There was no effect on total revenues.


                                                                             10
TRIBUNE COMPANY
                           SUMMARY OF NEWSPAPER ADVERTISING VOLUME (Unaudited) (A)
                                 For Period 3 and First Quarter Ended March 27, 2005
                                                    (In thousands)


                                                         Period 3 (4 weeks)                       First Quarter (13 weeks)
                                                                                %                                              %
                                                  2005           2004         Change          2005            2004           Change
Full Run
                                                      168              182                        583             622
     L.A. Times                                                                  (7.7)                                         (6.3)
                                                      151              172                        503             527
     Chicago Tribune                                                            (12.2)                                         (4.6)
                                                      109              122                        353             362
     Newsday                                                                    (10.7)                                         (2.5)
                                                    1,044            1,160                      3,289           3,519
     Other Daily Newspapers (B)                                                 (10.0)                                         (6.5)
                                                    1,472            1,636                      4,728           5,030
     Total                                                                      (10.0)                                         (6.0)

Part Run
                                                      411              449                      1,310           1,441
     L.A. Times                                                                  (8.5)                                         (9.1)
                                                      547              538                      1,672           1,550
     Chicago Tribune                                                              1.7                                           7.9
                                                      154              144                        460             427
     Newsday                                                                      6.9                                           7.7
                                                      520              502                      1,599           1,549
     Other Daily Newspapers (B)                                                   3.6                                           3.2
                                                    1,632            1,633                      5,041           4,967
     Total                                                                       (0.1)                                          1.5

Total Advertising Inches
    Full Run
                                                      446              465                      1,405           1,399
         Retail                                                                  (4.1)                                          0.4
                                                      297              351                        998           1,063
         National                                                               (15.4)                                         (6.1)
                                                      729              820                      2,325           2,568
         Classified                                                             (11.1)                                         (9.5)
         Sub-Total                                  1,472            1,636      (10.0)          4,728           5,030          (6.0)
    Part Run                                        1,632            1,633       (0.1)          5,041           4,967           1.5
                                                    3,104            3,269                      9,769           9,997
    Total                                                                        (5.0)                                         (2.3)

Preprint Pieces
                                                  272,894        257,247                      890,896         755,763
    L.A. Times                                                                    6.1                                          17.9
                                                  351,294        280,092                    1,069,207         902,555
    Chicago Tribune                                                              25.4                                          18.5
                                                  208,976        209,418                      667,629         637,080
    Newsday                                                                      (0.2)                                          4.8
                                                  299,592        327,120                      974,070         973,340
    Other Daily Newspapers (B)                                                   (8.4)                                          0.1
    Total                                       1,132,756      1,073,877          5.5       3,601,802       3,268,738          10.2


(A) Volume for 2004 has been modified to conform with the 2005 presentation. Volume is based on preliminary internal data,
    which may be updated in subsequent reports. Advertising volume is presented only for daily newspapers.
(B) Other daily newspapers includeThe Baltimore Sun, South Florida Sun-Sentinel, Orlando Sentinel, The Hartford Courant,
    The Morning Call, Daily Press, The Advocate, Greenwich Time, Hoy, New York, Hoy, Chicago and Hoy, Los Angeles.

                                                                11

Mais conteúdo relacionado

Mais procurados

tribune earnings_q4_04_tables
tribune  earnings_q4_04_tablestribune  earnings_q4_04_tables
tribune earnings_q4_04_tablesfinance47
 
tribune earnings_q3_04_tables
tribune  earnings_q3_04_tablestribune  earnings_q3_04_tables
tribune earnings_q3_04_tablesfinance47
 
tribune earnings_q4_06_tables
tribune  earnings_q4_06_tablestribune  earnings_q4_06_tables
tribune earnings_q4_06_tablesfinance47
 
tribune earnings_q4_05_tables
tribune  earnings_q4_05_tablestribune  earnings_q4_05_tables
tribune earnings_q4_05_tablesfinance47
 
Maxim 2Q FISCAL 2009 RESULTS
Maxim 2Q FISCAL 2009 RESULTSMaxim 2Q FISCAL 2009 RESULTS
Maxim 2Q FISCAL 2009 RESULTSearningsreport
 
tribune earnings_q3_06_tables
tribune  earnings_q3_06_tablestribune  earnings_q3_06_tables
tribune earnings_q3_06_tablesfinance47
 
tribune earnings_q2_07_tables
tribune  earnings_q2_07_tablestribune  earnings_q2_07_tables
tribune earnings_q2_07_tablesfinance47
 
tribune earnings_q2_06_tables
tribune  earnings_q2_06_tablestribune  earnings_q2_06_tables
tribune earnings_q2_06_tablesfinance47
 
CLOrox fy05_q2_spmt
CLOrox   fy05_q2_spmtCLOrox   fy05_q2_spmt
CLOrox fy05_q2_spmtfinance48
 
fProgressive 2003 review
fProgressive  2003 reviewfProgressive  2003 review
fProgressive 2003 reviewfinance18
 
tribune earnings_q3_02_tables
tribune  earnings_q3_02_tablestribune  earnings_q3_02_tables
tribune earnings_q3_02_tablesfinance47
 
tribune earnings_q3_01_tables
tribune  earnings_q3_01_tablestribune  earnings_q3_01_tables
tribune earnings_q3_01_tablesfinance47
 
Q2 2004 Earnings Release Financial Tables
	Q2 2004 Earnings Release Financial Tables	Q2 2004 Earnings Release Financial Tables
Q2 2004 Earnings Release Financial Tablesfinance7
 
Reconciliations and Financial Slides from Safeway Investor Conference
	Reconciliations and Financial Slides from Safeway Investor Conference	Reconciliations and Financial Slides from Safeway Investor Conference
Reconciliations and Financial Slides from Safeway Investor Conferencefinance6
 
tribune earnings_q2_02_tables
tribune  earnings_q2_02_tablestribune  earnings_q2_02_tables
tribune earnings_q2_02_tablesfinance47
 
Duke Energy 01/29/04_PMA_and_DLH_4Q03_Earnings_Call
 Duke Energy 01/29/04_PMA_and_DLH_4Q03_Earnings_Call Duke Energy 01/29/04_PMA_and_DLH_4Q03_Earnings_Call
Duke Energy 01/29/04_PMA_and_DLH_4Q03_Earnings_Callfinance21
 
conoco phillips 2005Third Quarter
conoco phillips 2005Third Quarterconoco phillips 2005Third Quarter
conoco phillips 2005Third Quarterfinance1
 
ameren 2003_am_ar_sel_consol_fin
ameren  2003_am_ar_sel_consol_finameren  2003_am_ar_sel_consol_fin
ameren 2003_am_ar_sel_consol_finfinance30
 

Mais procurados (20)

tribune earnings_q4_04_tables
tribune  earnings_q4_04_tablestribune  earnings_q4_04_tables
tribune earnings_q4_04_tables
 
tribune earnings_q3_04_tables
tribune  earnings_q3_04_tablestribune  earnings_q3_04_tables
tribune earnings_q3_04_tables
 
tribune earnings_q4_06_tables
tribune  earnings_q4_06_tablestribune  earnings_q4_06_tables
tribune earnings_q4_06_tables
 
tribune earnings_q4_05_tables
tribune  earnings_q4_05_tablestribune  earnings_q4_05_tables
tribune earnings_q4_05_tables
 
Fourth Quarter 2007 Earnings Presentation
	Fourth Quarter 2007 Earnings Presentation 	Fourth Quarter 2007 Earnings Presentation
Fourth Quarter 2007 Earnings Presentation
 
Maxim 2Q FISCAL 2009 RESULTS
Maxim 2Q FISCAL 2009 RESULTSMaxim 2Q FISCAL 2009 RESULTS
Maxim 2Q FISCAL 2009 RESULTS
 
tribune earnings_q3_06_tables
tribune  earnings_q3_06_tablestribune  earnings_q3_06_tables
tribune earnings_q3_06_tables
 
tribune earnings_q2_07_tables
tribune  earnings_q2_07_tablestribune  earnings_q2_07_tables
tribune earnings_q2_07_tables
 
tribune earnings_q2_06_tables
tribune  earnings_q2_06_tablestribune  earnings_q2_06_tables
tribune earnings_q2_06_tables
 
CLOrox fy05_q2_spmt
CLOrox   fy05_q2_spmtCLOrox   fy05_q2_spmt
CLOrox fy05_q2_spmt
 
fProgressive 2003 review
fProgressive  2003 reviewfProgressive  2003 review
fProgressive 2003 review
 
tribune earnings_q3_02_tables
tribune  earnings_q3_02_tablestribune  earnings_q3_02_tables
tribune earnings_q3_02_tables
 
tribune earnings_q3_01_tables
tribune  earnings_q3_01_tablestribune  earnings_q3_01_tables
tribune earnings_q3_01_tables
 
Second Quarter 2008 Earnings Presentation
Second Quarter 2008 Earnings PresentationSecond Quarter 2008 Earnings Presentation
Second Quarter 2008 Earnings Presentation
 
Q2 2004 Earnings Release Financial Tables
	Q2 2004 Earnings Release Financial Tables	Q2 2004 Earnings Release Financial Tables
Q2 2004 Earnings Release Financial Tables
 
Reconciliations and Financial Slides from Safeway Investor Conference
	Reconciliations and Financial Slides from Safeway Investor Conference	Reconciliations and Financial Slides from Safeway Investor Conference
Reconciliations and Financial Slides from Safeway Investor Conference
 
tribune earnings_q2_02_tables
tribune  earnings_q2_02_tablestribune  earnings_q2_02_tables
tribune earnings_q2_02_tables
 
Duke Energy 01/29/04_PMA_and_DLH_4Q03_Earnings_Call
 Duke Energy 01/29/04_PMA_and_DLH_4Q03_Earnings_Call Duke Energy 01/29/04_PMA_and_DLH_4Q03_Earnings_Call
Duke Energy 01/29/04_PMA_and_DLH_4Q03_Earnings_Call
 
conoco phillips 2005Third Quarter
conoco phillips 2005Third Quarterconoco phillips 2005Third Quarter
conoco phillips 2005Third Quarter
 
ameren 2003_am_ar_sel_consol_fin
ameren  2003_am_ar_sel_consol_finameren  2003_am_ar_sel_consol_fin
ameren 2003_am_ar_sel_consol_fin
 

Semelhante a tribune earnings_q1_05_tables

tribune earnings_q4_02_tables
tribune  earnings_q4_02_tablestribune  earnings_q4_02_tables
tribune earnings_q4_02_tablesfinance47
 
tribune earnings_q4_01_tables
tribune  earnings_q4_01_tablestribune  earnings_q4_01_tables
tribune earnings_q4_01_tablesfinance47
 
tribune earnings_q1_03_tables
tribune  earnings_q1_03_tablestribune  earnings_q1_03_tables
tribune earnings_q1_03_tablesfinance47
 
tribune earnings_q1_07_tables
tribune  earnings_q1_07_tablestribune  earnings_q1_07_tables
tribune earnings_q1_07_tablesfinance47
 
tribune earnings_q1_08_tables
tribune earnings_q1_08_tablestribune earnings_q1_08_tables
tribune earnings_q1_08_tablesfinance47
 
tribune earnings_q1_08_tables
tribune  earnings_q1_08_tablestribune  earnings_q1_08_tables
tribune earnings_q1_08_tablesfinance47
 
tribune earnings_q2_08_tables
tribune earnings_q2_08_tablestribune earnings_q2_08_tables
tribune earnings_q2_08_tablesfinance47
 
tribune earnings_q2_08_tables
tribune  earnings_q2_08_tablestribune  earnings_q2_08_tables
tribune earnings_q2_08_tablesfinance47
 
tribune earnings_q2_01_tables
tribune  earnings_q2_01_tablestribune  earnings_q2_01_tables
tribune earnings_q2_01_tablesfinance47
 
Q3 2004 Earnings Release Financial Tables
Q3 2004 Earnings Release Financial TablesQ3 2004 Earnings Release Financial Tables
Q3 2004 Earnings Release Financial Tablesfinance7
 
Duke Energy 072904_2q04_er_reg_g
Duke Energy 072904_2q04_er_reg_gDuke Energy 072904_2q04_er_reg_g
Duke Energy 072904_2q04_er_reg_gfinance21
 
tribune earnings_q1_02_tables
tribune  earnings_q1_02_tablestribune  earnings_q1_02_tables
tribune earnings_q1_02_tablesfinance47
 
tribune earnings_q3_07_tables
tribune earnings_q3_07_tablestribune earnings_q3_07_tables
tribune earnings_q3_07_tablesfinance47
 
tribune earnings_q3_07_tables
tribune  earnings_q3_07_tablestribune  earnings_q3_07_tables
tribune earnings_q3_07_tablesfinance47
 
Q1 2007 Earnings Release Financial Tables
 	Q1 2007 Earnings Release Financial Tables 	Q1 2007 Earnings Release Financial Tables
Q1 2007 Earnings Release Financial Tablesfinance7
 
omnicom group Q4 2004 Earnings Release (pdf)
omnicom group  Q4 2004 Earnings Release (pdf)omnicom group  Q4 2004 Earnings Release (pdf)
omnicom group Q4 2004 Earnings Release (pdf)finance22
 
CLOrox earnings_q1fy06
CLOrox   earnings_q1fy06CLOrox   earnings_q1fy06
CLOrox earnings_q1fy06finance48
 

Semelhante a tribune earnings_q1_05_tables (18)

tribune earnings_q4_02_tables
tribune  earnings_q4_02_tablestribune  earnings_q4_02_tables
tribune earnings_q4_02_tables
 
tribune earnings_q4_01_tables
tribune  earnings_q4_01_tablestribune  earnings_q4_01_tables
tribune earnings_q4_01_tables
 
tribune earnings_q1_03_tables
tribune  earnings_q1_03_tablestribune  earnings_q1_03_tables
tribune earnings_q1_03_tables
 
tribune earnings_q1_07_tables
tribune  earnings_q1_07_tablestribune  earnings_q1_07_tables
tribune earnings_q1_07_tables
 
tribune earnings_q1_08_tables
tribune earnings_q1_08_tablestribune earnings_q1_08_tables
tribune earnings_q1_08_tables
 
tribune earnings_q1_08_tables
tribune  earnings_q1_08_tablestribune  earnings_q1_08_tables
tribune earnings_q1_08_tables
 
tribune earnings_q2_08_tables
tribune earnings_q2_08_tablestribune earnings_q2_08_tables
tribune earnings_q2_08_tables
 
tribune earnings_q2_08_tables
tribune  earnings_q2_08_tablestribune  earnings_q2_08_tables
tribune earnings_q2_08_tables
 
tribune earnings_q2_01_tables
tribune  earnings_q2_01_tablestribune  earnings_q2_01_tables
tribune earnings_q2_01_tables
 
Q3 2004 Earnings Release Financial Tables
Q3 2004 Earnings Release Financial TablesQ3 2004 Earnings Release Financial Tables
Q3 2004 Earnings Release Financial Tables
 
Duke Energy 072904_2q04_er_reg_g
Duke Energy 072904_2q04_er_reg_gDuke Energy 072904_2q04_er_reg_g
Duke Energy 072904_2q04_er_reg_g
 
tribune earnings_q1_02_tables
tribune  earnings_q1_02_tablestribune  earnings_q1_02_tables
tribune earnings_q1_02_tables
 
tribune earnings_q3_07_tables
tribune earnings_q3_07_tablestribune earnings_q3_07_tables
tribune earnings_q3_07_tables
 
tribune earnings_q3_07_tables
tribune  earnings_q3_07_tablestribune  earnings_q3_07_tables
tribune earnings_q3_07_tables
 
clx_q2fy04
clx_q2fy04clx_q2fy04
clx_q2fy04
 
Q1 2007 Earnings Release Financial Tables
 	Q1 2007 Earnings Release Financial Tables 	Q1 2007 Earnings Release Financial Tables
Q1 2007 Earnings Release Financial Tables
 
omnicom group Q4 2004 Earnings Release (pdf)
omnicom group  Q4 2004 Earnings Release (pdf)omnicom group  Q4 2004 Earnings Release (pdf)
omnicom group Q4 2004 Earnings Release (pdf)
 
CLOrox earnings_q1fy06
CLOrox   earnings_q1fy06CLOrox   earnings_q1fy06
CLOrox earnings_q1fy06
 

Mais de finance47

western unionCorporate Governance Guidelines
western unionCorporate Governance Guidelineswestern unionCorporate Governance Guidelines
western unionCorporate Governance Guidelinesfinance47
 
western union Certificate of Incorporation
western union Certificate of Incorporation western union Certificate of Incorporation
western union Certificate of Incorporation finance47
 
western unionRelated Person Transactions Policy
western unionRelated Person Transactions Policy western unionRelated Person Transactions Policy
western unionRelated Person Transactions Policy finance47
 
western union annual reports 2006
western union annual reports 2006western union annual reports 2006
western union annual reports 2006finance47
 
western union annual reports 2007
western union annual reports 2007western union annual reports 2007
western union annual reports 2007finance47
 
western union annual reports 2008
western union annual reports 2008western union annual reports 2008
western union annual reports 2008finance47
 
hershey 63664
hershey  63664hershey  63664
hershey 63664finance47
 
hershey 63664
hershey  63664hershey  63664
hershey 63664finance47
 
hershey _020415b
hershey  _020415bhershey  _020415b
hershey _020415bfinance47
 
hershey _020415b
hershey  _020415bhershey  _020415b
hershey _020415bfinance47
 
hershey _2001_AR
hershey  _2001_ARhershey  _2001_AR
hershey _2001_ARfinance47
 
hershey _2001_AR
hershey  _2001_ARhershey  _2001_AR
hershey _2001_ARfinance47
 
hershey _MDA_2002
hershey  _MDA_2002hershey  _MDA_2002
hershey _MDA_2002finance47
 
hershey _MDA_2002
hershey  _MDA_2002hershey  _MDA_2002
hershey _MDA_2002finance47
 
hershey HSY_MDA_2003
hershey  HSY_MDA_2003hershey  HSY_MDA_2003
hershey HSY_MDA_2003finance47
 
hershey HSY_MDA_2003
hershey  HSY_MDA_2003hershey  HSY_MDA_2003
hershey HSY_MDA_2003finance47
 
hershey HSY_Letter_2004
hershey  HSY_Letter_2004hershey  HSY_Letter_2004
hershey HSY_Letter_2004finance47
 
hershey HSY_Letter_2004
hershey  HSY_Letter_2004hershey  HSY_Letter_2004
hershey HSY_Letter_2004finance47
 
hershey 2004AR
hershey  2004ARhershey  2004AR
hershey 2004ARfinance47
 
hershey 2004AR
hershey  2004ARhershey  2004AR
hershey 2004ARfinance47
 

Mais de finance47 (20)

western unionCorporate Governance Guidelines
western unionCorporate Governance Guidelineswestern unionCorporate Governance Guidelines
western unionCorporate Governance Guidelines
 
western union Certificate of Incorporation
western union Certificate of Incorporation western union Certificate of Incorporation
western union Certificate of Incorporation
 
western unionRelated Person Transactions Policy
western unionRelated Person Transactions Policy western unionRelated Person Transactions Policy
western unionRelated Person Transactions Policy
 
western union annual reports 2006
western union annual reports 2006western union annual reports 2006
western union annual reports 2006
 
western union annual reports 2007
western union annual reports 2007western union annual reports 2007
western union annual reports 2007
 
western union annual reports 2008
western union annual reports 2008western union annual reports 2008
western union annual reports 2008
 
hershey 63664
hershey  63664hershey  63664
hershey 63664
 
hershey 63664
hershey  63664hershey  63664
hershey 63664
 
hershey _020415b
hershey  _020415bhershey  _020415b
hershey _020415b
 
hershey _020415b
hershey  _020415bhershey  _020415b
hershey _020415b
 
hershey _2001_AR
hershey  _2001_ARhershey  _2001_AR
hershey _2001_AR
 
hershey _2001_AR
hershey  _2001_ARhershey  _2001_AR
hershey _2001_AR
 
hershey _MDA_2002
hershey  _MDA_2002hershey  _MDA_2002
hershey _MDA_2002
 
hershey _MDA_2002
hershey  _MDA_2002hershey  _MDA_2002
hershey _MDA_2002
 
hershey HSY_MDA_2003
hershey  HSY_MDA_2003hershey  HSY_MDA_2003
hershey HSY_MDA_2003
 
hershey HSY_MDA_2003
hershey  HSY_MDA_2003hershey  HSY_MDA_2003
hershey HSY_MDA_2003
 
hershey HSY_Letter_2004
hershey  HSY_Letter_2004hershey  HSY_Letter_2004
hershey HSY_Letter_2004
 
hershey HSY_Letter_2004
hershey  HSY_Letter_2004hershey  HSY_Letter_2004
hershey HSY_Letter_2004
 
hershey 2004AR
hershey  2004ARhershey  2004AR
hershey 2004AR
 
hershey 2004AR
hershey  2004ARhershey  2004AR
hershey 2004AR
 

Último

Economics, Commerce and Trade Management: An International Journal (ECTIJ)
Economics, Commerce and Trade Management: An International Journal (ECTIJ)Economics, Commerce and Trade Management: An International Journal (ECTIJ)
Economics, Commerce and Trade Management: An International Journal (ECTIJ)ECTIJ
 
(中央兰开夏大学毕业证学位证成绩单-案例)
(中央兰开夏大学毕业证学位证成绩单-案例)(中央兰开夏大学毕业证学位证成绩单-案例)
(中央兰开夏大学毕业证学位证成绩单-案例)twfkn8xj
 
letter-from-the-chair-to-the-fca-relating-to-british-steel-pensions-scheme-15...
letter-from-the-chair-to-the-fca-relating-to-british-steel-pensions-scheme-15...letter-from-the-chair-to-the-fca-relating-to-british-steel-pensions-scheme-15...
letter-from-the-chair-to-the-fca-relating-to-british-steel-pensions-scheme-15...Henry Tapper
 
Bladex 1Q24 Earning Results Presentation
Bladex 1Q24 Earning Results PresentationBladex 1Q24 Earning Results Presentation
Bladex 1Q24 Earning Results PresentationBladex
 
NO1 Certified Ilam kala Jadu Specialist Expert In Bahawalpur, Sargodha, Sialk...
NO1 Certified Ilam kala Jadu Specialist Expert In Bahawalpur, Sargodha, Sialk...NO1 Certified Ilam kala Jadu Specialist Expert In Bahawalpur, Sargodha, Sialk...
NO1 Certified Ilam kala Jadu Specialist Expert In Bahawalpur, Sargodha, Sialk...Amil Baba Dawood bangali
 
NO1 WorldWide Genuine vashikaran specialist Vashikaran baba near Lahore Vashi...
NO1 WorldWide Genuine vashikaran specialist Vashikaran baba near Lahore Vashi...NO1 WorldWide Genuine vashikaran specialist Vashikaran baba near Lahore Vashi...
NO1 WorldWide Genuine vashikaran specialist Vashikaran baba near Lahore Vashi...Amil baba
 
call girls in Nand Nagri (DELHI) 🔝 >༒9953330565🔝 genuine Escort Service 🔝✔️✔️
call girls in  Nand Nagri (DELHI) 🔝 >༒9953330565🔝 genuine Escort Service 🔝✔️✔️call girls in  Nand Nagri (DELHI) 🔝 >༒9953330565🔝 genuine Escort Service 🔝✔️✔️
call girls in Nand Nagri (DELHI) 🔝 >༒9953330565🔝 genuine Escort Service 🔝✔️✔️9953056974 Low Rate Call Girls In Saket, Delhi NCR
 
NO1 WorldWide Love marriage specialist baba ji Amil Baba Kala ilam powerful v...
NO1 WorldWide Love marriage specialist baba ji Amil Baba Kala ilam powerful v...NO1 WorldWide Love marriage specialist baba ji Amil Baba Kala ilam powerful v...
NO1 WorldWide Love marriage specialist baba ji Amil Baba Kala ilam powerful v...Amil baba
 
The Core Functions of the Bangko Sentral ng Pilipinas
The Core Functions of the Bangko Sentral ng PilipinasThe Core Functions of the Bangko Sentral ng Pilipinas
The Core Functions of the Bangko Sentral ng PilipinasCherylouCamus
 
BPPG response - Options for Defined Benefit schemes - 19Apr24.pdf
BPPG response - Options for Defined Benefit schemes - 19Apr24.pdfBPPG response - Options for Defined Benefit schemes - 19Apr24.pdf
BPPG response - Options for Defined Benefit schemes - 19Apr24.pdfHenry Tapper
 
Financial Leverage Definition, Advantages, and Disadvantages
Financial Leverage Definition, Advantages, and DisadvantagesFinancial Leverage Definition, Advantages, and Disadvantages
Financial Leverage Definition, Advantages, and Disadvantagesjayjaymabutot13
 
Lundin Gold April 2024 Corporate Presentation v4.pdf
Lundin Gold April 2024 Corporate Presentation v4.pdfLundin Gold April 2024 Corporate Presentation v4.pdf
Lundin Gold April 2024 Corporate Presentation v4.pdfAdnet Communications
 
Stock Market Brief Deck FOR 4/17 video.pdf
Stock Market Brief Deck FOR 4/17 video.pdfStock Market Brief Deck FOR 4/17 video.pdf
Stock Market Brief Deck FOR 4/17 video.pdfMichael Silva
 
Call Girls Near Me WhatsApp:+91-9833363713
Call Girls Near Me WhatsApp:+91-9833363713Call Girls Near Me WhatsApp:+91-9833363713
Call Girls Near Me WhatsApp:+91-9833363713Sonam Pathan
 
Monthly Market Risk Update: April 2024 [SlideShare]
Monthly Market Risk Update: April 2024 [SlideShare]Monthly Market Risk Update: April 2024 [SlideShare]
Monthly Market Risk Update: April 2024 [SlideShare]Commonwealth
 
Vp Girls near me Delhi Call Now or WhatsApp
Vp Girls near me Delhi Call Now or WhatsAppVp Girls near me Delhi Call Now or WhatsApp
Vp Girls near me Delhi Call Now or WhatsAppmiss dipika
 
Call Girls Near Golden Tulip Essential Hotel, New Delhi 9873777170
Call Girls Near Golden Tulip Essential Hotel, New Delhi 9873777170Call Girls Near Golden Tulip Essential Hotel, New Delhi 9873777170
Call Girls Near Golden Tulip Essential Hotel, New Delhi 9873777170Sonam Pathan
 
Call Girls In Yusuf Sarai Women Seeking Men 9654467111
Call Girls In Yusuf Sarai Women Seeking Men 9654467111Call Girls In Yusuf Sarai Women Seeking Men 9654467111
Call Girls In Yusuf Sarai Women Seeking Men 9654467111Sapana Sha
 
House of Commons ; CDC schemes overview document
House of Commons ; CDC schemes overview documentHouse of Commons ; CDC schemes overview document
House of Commons ; CDC schemes overview documentHenry Tapper
 
Bladex Earnings Call Presentation 1Q2024
Bladex Earnings Call Presentation 1Q2024Bladex Earnings Call Presentation 1Q2024
Bladex Earnings Call Presentation 1Q2024Bladex
 

Último (20)

Economics, Commerce and Trade Management: An International Journal (ECTIJ)
Economics, Commerce and Trade Management: An International Journal (ECTIJ)Economics, Commerce and Trade Management: An International Journal (ECTIJ)
Economics, Commerce and Trade Management: An International Journal (ECTIJ)
 
(中央兰开夏大学毕业证学位证成绩单-案例)
(中央兰开夏大学毕业证学位证成绩单-案例)(中央兰开夏大学毕业证学位证成绩单-案例)
(中央兰开夏大学毕业证学位证成绩单-案例)
 
letter-from-the-chair-to-the-fca-relating-to-british-steel-pensions-scheme-15...
letter-from-the-chair-to-the-fca-relating-to-british-steel-pensions-scheme-15...letter-from-the-chair-to-the-fca-relating-to-british-steel-pensions-scheme-15...
letter-from-the-chair-to-the-fca-relating-to-british-steel-pensions-scheme-15...
 
Bladex 1Q24 Earning Results Presentation
Bladex 1Q24 Earning Results PresentationBladex 1Q24 Earning Results Presentation
Bladex 1Q24 Earning Results Presentation
 
NO1 Certified Ilam kala Jadu Specialist Expert In Bahawalpur, Sargodha, Sialk...
NO1 Certified Ilam kala Jadu Specialist Expert In Bahawalpur, Sargodha, Sialk...NO1 Certified Ilam kala Jadu Specialist Expert In Bahawalpur, Sargodha, Sialk...
NO1 Certified Ilam kala Jadu Specialist Expert In Bahawalpur, Sargodha, Sialk...
 
NO1 WorldWide Genuine vashikaran specialist Vashikaran baba near Lahore Vashi...
NO1 WorldWide Genuine vashikaran specialist Vashikaran baba near Lahore Vashi...NO1 WorldWide Genuine vashikaran specialist Vashikaran baba near Lahore Vashi...
NO1 WorldWide Genuine vashikaran specialist Vashikaran baba near Lahore Vashi...
 
call girls in Nand Nagri (DELHI) 🔝 >༒9953330565🔝 genuine Escort Service 🔝✔️✔️
call girls in  Nand Nagri (DELHI) 🔝 >༒9953330565🔝 genuine Escort Service 🔝✔️✔️call girls in  Nand Nagri (DELHI) 🔝 >༒9953330565🔝 genuine Escort Service 🔝✔️✔️
call girls in Nand Nagri (DELHI) 🔝 >༒9953330565🔝 genuine Escort Service 🔝✔️✔️
 
NO1 WorldWide Love marriage specialist baba ji Amil Baba Kala ilam powerful v...
NO1 WorldWide Love marriage specialist baba ji Amil Baba Kala ilam powerful v...NO1 WorldWide Love marriage specialist baba ji Amil Baba Kala ilam powerful v...
NO1 WorldWide Love marriage specialist baba ji Amil Baba Kala ilam powerful v...
 
The Core Functions of the Bangko Sentral ng Pilipinas
The Core Functions of the Bangko Sentral ng PilipinasThe Core Functions of the Bangko Sentral ng Pilipinas
The Core Functions of the Bangko Sentral ng Pilipinas
 
BPPG response - Options for Defined Benefit schemes - 19Apr24.pdf
BPPG response - Options for Defined Benefit schemes - 19Apr24.pdfBPPG response - Options for Defined Benefit schemes - 19Apr24.pdf
BPPG response - Options for Defined Benefit schemes - 19Apr24.pdf
 
Financial Leverage Definition, Advantages, and Disadvantages
Financial Leverage Definition, Advantages, and DisadvantagesFinancial Leverage Definition, Advantages, and Disadvantages
Financial Leverage Definition, Advantages, and Disadvantages
 
Lundin Gold April 2024 Corporate Presentation v4.pdf
Lundin Gold April 2024 Corporate Presentation v4.pdfLundin Gold April 2024 Corporate Presentation v4.pdf
Lundin Gold April 2024 Corporate Presentation v4.pdf
 
Stock Market Brief Deck FOR 4/17 video.pdf
Stock Market Brief Deck FOR 4/17 video.pdfStock Market Brief Deck FOR 4/17 video.pdf
Stock Market Brief Deck FOR 4/17 video.pdf
 
Call Girls Near Me WhatsApp:+91-9833363713
Call Girls Near Me WhatsApp:+91-9833363713Call Girls Near Me WhatsApp:+91-9833363713
Call Girls Near Me WhatsApp:+91-9833363713
 
Monthly Market Risk Update: April 2024 [SlideShare]
Monthly Market Risk Update: April 2024 [SlideShare]Monthly Market Risk Update: April 2024 [SlideShare]
Monthly Market Risk Update: April 2024 [SlideShare]
 
Vp Girls near me Delhi Call Now or WhatsApp
Vp Girls near me Delhi Call Now or WhatsAppVp Girls near me Delhi Call Now or WhatsApp
Vp Girls near me Delhi Call Now or WhatsApp
 
Call Girls Near Golden Tulip Essential Hotel, New Delhi 9873777170
Call Girls Near Golden Tulip Essential Hotel, New Delhi 9873777170Call Girls Near Golden Tulip Essential Hotel, New Delhi 9873777170
Call Girls Near Golden Tulip Essential Hotel, New Delhi 9873777170
 
Call Girls In Yusuf Sarai Women Seeking Men 9654467111
Call Girls In Yusuf Sarai Women Seeking Men 9654467111Call Girls In Yusuf Sarai Women Seeking Men 9654467111
Call Girls In Yusuf Sarai Women Seeking Men 9654467111
 
House of Commons ; CDC schemes overview document
House of Commons ; CDC schemes overview documentHouse of Commons ; CDC schemes overview document
House of Commons ; CDC schemes overview document
 
Bladex Earnings Call Presentation 1Q2024
Bladex Earnings Call Presentation 1Q2024Bladex Earnings Call Presentation 1Q2024
Bladex Earnings Call Presentation 1Q2024
 

tribune earnings_q1_05_tables

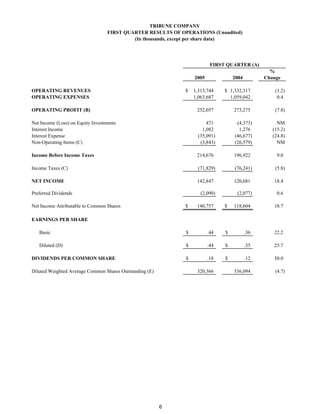
  • 1. TRIBUNE COMPANY FIRST QUARTER RESULTS OF OPERATIONS (Unaudited) (In thousands, except per share data) FIRST QUARTER (A) % 2005 2004 Change OPERATING REVENUES $ 1,315,744 $ 1,332,317 (1.2) OPERATING EXPENSES 1,063,687 1,059,042 0.4 OPERATING PROFIT (B) 252,057 273,275 (7.8) Net Income (Loss) on Equity Investments 471 (4,373) NM Interest Income 1,082 1,276 (15.2) Interest Expense (35,091) (46,677) (24.8) Non-Operating Items (C) (3,843) (26,579) NM Income Before Income Taxes 214,676 196,922 9.0 Income Taxes (C) (71,829) (76,241) (5.8) NET INCOME 142,847 120,681 18.4 Preferred Dividends (2,090) (2,077) 0.6 Net Income Attributable to Common Shares $ 140,757 $ 118,604 18.7 EARNINGS PER SHARE Basic $ .44 $ .36 22.2 Diluted (D) $ .44 $ .35 25.7 DIVIDENDS PER COMMON SHARE $ .18 $ .12 50.0 Diluted Weighted Average Common Shares Outstanding (E) 320,366 336,094 (4.7) 6
  • 2. (A) 2005 first quarter: Dec. 27, 2004 to March 27, 2005. (13 weeks) 2004 first quarter: Dec. 29, 2003 to March 28, 2004. (13 weeks) (B) Operating profit excludes interest income and expense, equity income and losses, non-operating items and income taxes. (C) The first quarter of 2005 included the following non-operating items: Pretax After-tax Gain (Loss) Gain (Loss) Diluted EPS Loss on derivatives and related investments (1) $ (2,252) $ (1,374) $ - Gain on sales of investments 1,108 676 - Loss on investment write-downs and other (2,699) (1,646) - Income tax settlement adjustments (2) - 11,829 .03 Total non-operating items $ (3,843) $ 9,485 $ .03 The first quarter of 2004 included the following non-operating items: Pretax After-tax Gain (Loss) Gain (Loss) Diluted EPS Loss on derivatives and related investments (1) $ (45,501) $ (27,755) $ (.09) Gain on sales of investments (3) 21,518 13,126 .04 Loss on investment write-downs and other (2,596) (1,584) - Total non-operating items $ (26,579) $ (16,213) $ (.05) (1) Loss on derivatives and related investments represents the net change in fair values of the Company's PHONES derivatives and related Time Warner shares. (2) In the first quarter of 2005, the Company reduced its income tax expense and liabilities by a total of $12 million as a result of favorably resolving certain federal income tax issues. (3) In the first quarter of 2004, gain on sales of investments relates primarily to the sale of the Company's 50% interest in La Opinion . (D) For the first quarters of 2005 and 2004, weighted average common shares outstanding used in the calculation of diluted EPS were adjusted for the dilutive effect of stock options. The Company's Series C, D-1 and D-2 convertible preferred shares were not included in the calculation of diluted EPS for the first quarter of either year because their effects were antidilutive. Following are the calculations for the first quarter: First Quarter 2005 2004 Net income $ 142,847 $ 120,681 Dividends for Series C, D-1 and D-2 preferred stock (2,090) (2,077) Net income attributable to common shares $ 140,757 $ 118,604 Weighted average common shares outstanding 317,307 329,303 Assumed exercise of stock options, net of common shares assumed repurchased 3,059 6,791 Adjusted weighted average common shares outstanding 320,366 336,094 Diluted earnings per share $ .44 $ .35 (E) The number of common shares outstanding, in thousands, at March 27, 2005 was 317,515. 7
  • 3. TRIBUNE COMPANY FIRST QUARTER BUSINESS SEGMENT DATA (Unaudited) (In thousands) FIRST QUARTER % 2005 2004 Change PUBLISHING Operating Revenues $ 1,005,512 $ 1,003,583 0.2 Cash Operating Expenses (A) (762,327) (768,942) (0.9) Operating Cash Flow (B) (C) 243,185 234,641 3.6 Depreciation and Amortization Expense (44,646) (45,093) (1.0) Total Operating Profit (C) $ 198,539 $ 189,548 4.7 BROADCASTING AND ENTERTAINMENT Operating Revenues Television $ 290,089 $ 306,439 (5.3) Radio/Entertainment 20,143 22,295 (9.7) Total Operating Revenues 310,232 328,734 (5.6) Cash Operating Expenses (A) Television (190,970) (192,277) (0.7) Radio/Entertainment (D) (39,450) (26,742) 47.5 Total Cash Operating Expenses (D) (230,420) (219,019) 5.2 Operating Cash Flow (B) (C) Television 99,119 114,162 (13.2) Radio/Entertainment (19,307) (4,447) NM Total Operating Cash Flow 79,812 109,715 (27.3) Depreciation and Amortization Expense Television (11,678) (11,759) (0.7) Radio/Entertainment (1,168) (1,337) (12.6) Total Depreciation and Amortization Expense (12,846) (13,096) (1.9) Operating Profit (Loss) (C) Television 87,441 102,403 (14.6) Radio/Entertainment (20,475) (5,784) NM Total Operating Profit $ 66,966 $ 96,619 (30.7) CORPORATE EXPENSES Operating Cash Flow (B) (C) $ (13,047) $ (12,471) 4.6 Depreciation and Amortization Expense (401) (421) (4.8) Total Operating Loss (C) $ (13,448) $ (12,892) 4.3 CONSOLIDATED Operating Revenues $ 1,315,744 $ 1,332,317 (1.2) Cash Operating Expenses (A) (1,005,794) (1,000,432) 0.5 Operating Cash Flow (B) (C) 309,950 331,885 (6.6) Depreciation and Amortization Expense (57,893) (58,610) (1.2) Total Operating Profit (C) $ 252,057 $ 273,275 (7.8) 8
  • 4. (A) The Company uses cash operating expenses to evaluate internal performance. The Company has presented cash operating expenses because it is a common measure used by rating agencies, financial analysts and investors. Cash operating expenses are not a measure of financial performance under generally accepted accounting principles (quot;GAAPquot;) and should not be considered in isolation or as a substitute for measures of performance prepared in accordance with GAAP. Following is a reconciliation of operating expenses to cash operating expenses for the first quarter of 2005: Broadcasting and Publishing Entertainment Corporate Consolidated Operating expenses $ 806,973 $ 243,266 $ 13,448 $ 1,063,687 Less: depreciation and amortization expense 44,646 12,846 401 57,893 Cash operating expenses $ 762,327 $ 230,420 $ 13,047 $ 1,005,794 Following is a reconciliation of operating expenses to cash operating expenses for the first quarter of 2004: Broadcasting and Publishing Entertainment Corporate Consolidated Operating expenses $ 814,035 $ 232,115 $ 12,892 $ 1,059,042 Less: depreciation and amortization expense 45,093 13,096 421 58,610 Cash operating expenses $ 768,942 $ 219,019 $ 12,471 $ 1,000,432 (B) Operating cash flow is defined as operating profit before depreciation and amortization. The Company uses operating cash flow along with operating profit and other measures to evaluate the financial performance of the Company's business segments. The Company has presented operating cash flow because it is a common alternative measure of financial performance used by rating agencies, financial analysts and investors. These groups use operating cash flow along with other measures as a way to estimate the value of a company. The Company's definition of operating cash flow may not be consistent with that of other companies. Operating cash flow does not represent cash provided by operating activities as reflected in the Company's consolidated statements of cash flows, is not a measure of financial performance under GAAP and should not be considered in isolation or as a substitute for measures of performance prepared in accordance with GAAP. (C) Operating profit for each segment excludes interest income and expense, equity income and losses, non-operating items and income taxes. Following is a reconciliation of operating profit (loss) to operating cash flow for the first quarter of 2005: Broadcasting and Publishing Entertainment Corporate Consolidated Operating profit (loss) $ 198,539 $ 66,966 $ (13,448) $ 252,057 Add back: depreciation and amortization expense 44,646 12,846 401 57,893 Operating cash flow $ 243,185 $ 79,812 $ (13,047) $ 309,950 Following is a reconciliation of operating profit (loss) to operating cash flow for the first quarter of 2004: Broadcasting and Publishing Entertainment Corporate Consolidated Operating profit (loss) $ 189,548 $ 96,619 $ (12,892) $ 273,275 Add back: depreciation and amortization expense 45,093 13,096 421 58,610 Operating cash flow $ 234,641 $ 109,715 $ (12,471) $ 331,885 (D) Broadcasting and entertainment cash operating expenses for the first quarter of 2005 include $13.5 million related to the Chicago Cubs trade of Sammy Sosa. 9
  • 5. TRIBUNE COMPANY SUMMARY OF REVENUES (Unaudited) For Period 3 and First Quarter Ended March 27, 2005 (In thousands) Period 3 (4 weeks) First Quarter (13 weeks) % % 2005 2004 Change 2005 2004 Change Publishing Advertising $ 96,248 $ 97,793 $ 301,754 $ 294,868 Retail (1.6) 2.3 National 60,372 63,773 (5.3) 206,509 207,667 (0.6) Classified 88,753 89,151 (0.4) 279,726 272,188 2.8 Sub-Total (A) 245,373 250,717 (2.1) 787,989 774,723 1.7 46,598 51,650 Circulation (9.8) 151,716 165,903 (8.6) Other 21,210 20,637 2.8 65,807 62,957 4.5 Segment Total 313,181 323,004 (3.0) 1,005,512 1,003,583 0.2 Broadcasting & Entertainment Television 95,503 102,247 (6.6) 290,089 306,439 (5.3) 10,056 10,349 Radio/Entertainment (2.8) 20,143 22,295 (9.7) 105,559 112,596 310,232 328,734 Segment Total (6.2) (5.6) $ 418,740 $ 435,600 (3.9) $ 1,315,744 $ 1,332,317 (1.2) Consolidated Revenues (A) Publishing advertising revenues for 2004 have been reclassified to conform with the 2005 presentation. There was no effect on total revenues. 10
  • 6. TRIBUNE COMPANY SUMMARY OF NEWSPAPER ADVERTISING VOLUME (Unaudited) (A) For Period 3 and First Quarter Ended March 27, 2005 (In thousands) Period 3 (4 weeks) First Quarter (13 weeks) % % 2005 2004 Change 2005 2004 Change Full Run 168 182 583 622 L.A. Times (7.7) (6.3) 151 172 503 527 Chicago Tribune (12.2) (4.6) 109 122 353 362 Newsday (10.7) (2.5) 1,044 1,160 3,289 3,519 Other Daily Newspapers (B) (10.0) (6.5) 1,472 1,636 4,728 5,030 Total (10.0) (6.0) Part Run 411 449 1,310 1,441 L.A. Times (8.5) (9.1) 547 538 1,672 1,550 Chicago Tribune 1.7 7.9 154 144 460 427 Newsday 6.9 7.7 520 502 1,599 1,549 Other Daily Newspapers (B) 3.6 3.2 1,632 1,633 5,041 4,967 Total (0.1) 1.5 Total Advertising Inches Full Run 446 465 1,405 1,399 Retail (4.1) 0.4 297 351 998 1,063 National (15.4) (6.1) 729 820 2,325 2,568 Classified (11.1) (9.5) Sub-Total 1,472 1,636 (10.0) 4,728 5,030 (6.0) Part Run 1,632 1,633 (0.1) 5,041 4,967 1.5 3,104 3,269 9,769 9,997 Total (5.0) (2.3) Preprint Pieces 272,894 257,247 890,896 755,763 L.A. Times 6.1 17.9 351,294 280,092 1,069,207 902,555 Chicago Tribune 25.4 18.5 208,976 209,418 667,629 637,080 Newsday (0.2) 4.8 299,592 327,120 974,070 973,340 Other Daily Newspapers (B) (8.4) 0.1 Total 1,132,756 1,073,877 5.5 3,601,802 3,268,738 10.2 (A) Volume for 2004 has been modified to conform with the 2005 presentation. Volume is based on preliminary internal data, which may be updated in subsequent reports. Advertising volume is presented only for daily newspapers. (B) Other daily newspapers includeThe Baltimore Sun, South Florida Sun-Sentinel, Orlando Sentinel, The Hartford Courant, The Morning Call, Daily Press, The Advocate, Greenwich Time, Hoy, New York, Hoy, Chicago and Hoy, Los Angeles. 11