SlideShare uma empresa Scribd logo
1 de 33
Baixar para ler offline
Starbucks Corporation
                                                        FINANCIAL HIGHLIGHTS
                                 NET REVENUES (in billions) & NET REVENUE GROWTH PERCENTAGES
                                                                                                                                                                       $5.3


                                                                                                                                                        $4.1
                                                                                                                                                                30%
                                                                                                                                         $3.3

                                                                                                                                                 24%
                                                                                                                         $2.6
                                                                                                           $2.2
                                                                                                                                  24%
                                                                                             $1.7
                                                                           $1.3                                    22%
                                                          $1.0
                                                                                                     29%
                                          $0.7
                                                                                    29%
                         $0.5                                       34%
        $0.3
                                                  40%
                63%              50%
       1994             1995             1996             1997             1998             1999           2000          2001           2002           2003           2004
                                                                                           Fiscal Year


                                                                          NET EARNINGS (in millions)
                                                                                                                                                                      $391.8


                                                                                                                                                       $268.3


                                                                                                                                        $212.7
                                                                                                                         $180.3


                                                                                            $101.6         $94.5
                                                                           $68.3
                                                          $55.2
                                         $41.7
                        $26.1
       $10.2

       1994             1995             1996             1997             1998             1999           2000          2001           2002           2003           2004
                                                                                           Fiscal Year


                        STORES OPEN AT YEAR END
                         (Company-operated and licensed stores)
                                                                                                                         FISCAL 2004 ACCOMPLISHMENTS
                                                                                             8,569
International
                                                                                   7,225
United States
                                                                                                                     • Attained record net revenues and net earnings
                                                                          5,886
                                                                 4,709
                                                                                                                     • Marked first full year of double-digit comparable
                                                     3,501                                                             store sales increase in more than a decade
                                            2,498
                                  1,886
                                                                                                                     • Opened a record 1,344 net locations worldwide
                         1,412
                1,015
       677
425
                                                                                                                     • Posted full year profitability for Starbucks
                                                                                                                       International Operations, both including and
                                                                                   2003      2004
1994   1995     1996     1997     1998      1999     2000        2001 2002
                                                                                                                       excluding Canada
                                          Fiscal Year
                                                                                                                     • Opened first store in France
                        COMPARABLE STORE SALES
                                                                                                                     • Expanded International infrastructure with
                  (Company-operated stores open 13 months or longer)
                                                                                                                       the opening of a second distribution center for
         The end of fiscal 2004 marked 153 consecutive months of positive
                                                                                                                       the Asia Pacific region, located in Hong Kong
                           comparable store sales growth.

                                                                                                                     • Continued product innovation with new
                                                                                                                       Frappuccino® beverages, reduced fat pastries
                                                                                             10%
9%     9%                                               9%
                                                                                                                       and high-quality seasonal offerings
                                                                                    8%
                 7%
                                             6%                            6%
                                   5%                             5%
                          5%
                                                                                                                     • Reached approximately $1 billion in total
                                                                                                                       life-to-date activations and reloads on
                                                                                                                       Starbucks Cards
                                                                                   2003      2004
1994   1995     1996     1997     1998      1999     2000        2001 2002
                                                                                                                     • Opened our Farmer Support Center in Costa
                                          Fiscal Year
                                                                                                                       Rica to support existing and potential Starbucks
                                                                                                                       Coffee suppliers and their communities
                         SHAREHOLDERS’ EQUITY
                                          (in billions)                                                              • Launched industry-leading Coffee and Farmer
                                                                                             $2.5                      Equity (C.A.F.E.) Practices, strengthening the
                                                                                                                       requirements for third party verification and
                                                                                    $2.1
                                                                                                                       economic transparency, and establishing more
                                                                          $1.7
                                                                  $1.4                                                 specific social and environmental indicators
                                                      $1.1
                                             $1.0
                                  $0.8
                                                                                                                     • Co-produced Ray Charles’ Genius Loves
                $0.5     $0.5
                                                                                                                       Company, which became a multiplatinum
       $0.3
$0.1
                                                                                                                       album with nearly 30 percent of total album
                                                                                                                       sales from Starbucks stores
                                                                                   2003      2004
1994   1995     1996     1997     1998      1999     2000        2001 2002
                                          Fiscal Year
CAUTIONARY STATEMENT PURSUANT TO THE                                             and equipment, a selection of premium teas and a line of
PRIVATE SECURITIES LITIGATION REFORM ACT                                         compact discs, primarily through Company-operated retail
OF 1995                                                                          stores. Starbucks also sells coffee and tea products through
                                                                                 other channels, and through certain of its equity investees
Certain statements herein, including anticipated store openings,
                                                                                 Starbucks produces and sells bottled Frappuccino® and Starbucks
trends in or expectations regarding Starbucks Corporation’s revenue
                                                                                 DoubleShot® coffee drinks and a line of superpremium ice
and net earnings growth, comparable store sales growth, cash flow
                                                                                 creams. These nonretail channels are collectively known as
requirements and capital expenditures, all constitute “ forward-
                                                                                 “Specialty Operations.” The Company’s objective is to establish
looking statements” within the meaning of the Private Securities
                                                                                 Starbucks as the most recognized and respected brand in the
Litigation Reform Act of 1995. Such statements are based on
                                                                                 world. To achieve this goal, the Company plans to continue rapid
currently available operating, financial and competitive information
                                                                                 expansion of its retail operations, to grow its Specialty Operations
and are subject to various risks and uncertainties. Actual future results
                                                                                 and to selectively pursue other opportunities to leverage the
and trends may differ materially depending on a variety of factors,
                                                                                 Starbucks brand through the introduction of new products and
including, but not limited to, coffee, dairy and other raw materials
                                                                                 the development of new channels of distribution.
prices and availability; successful execution of internal performance
and expansion plans; fluctuations in United States and international
                                                                                 The Company has two operating segments, United States and
economies and currencies; ramifications from the war on terrorism, or
                                                                                 International, each of which includes Company-operated retail
other international events or developments; the impact of competitors’
                                                                                 stores and Specialty Operations.
initiatives; the effect of legal proceedings; and other risks detailed
herein and in Starbucks Corporation’s other filings with the Securities
                                                                                 Company-operated Retail Stores
and Exchange Commission. Please also see “Certain Additional Risks
                                                                                 The Company’s retail goal is to become the leading retailer
and Uncertainties” in the Starbucks Annual report on Form 10-K for
                                                                                 and brand of coffee in each of its target markets by selling the
the fiscal year ended October 3, 2004.
                                                                                 finest quality coffee and related products and by providing
                                                                                 each customer a unique Starbucks Experience. This third place
A forward-looking statement is neither a prediction nor a guarantee
                                                                                 experience, after home and work, is built upon superior customer
of future events or circumstances, and those future events or
                                                                                 service as well as clean and well-maintained Company-operated
circumstances may not occur. Users should not place undue reliance
                                                                                 retail stores that reflect the personalities of the communities in
on the forward-looking statements, which speak only as of the date
                                                                                 which they operate, thereby building a high degree of customer
of this report. Starbucks Corporation is under no obligation to
                                                                                 loyalty. Starbucks strategy for expanding its retail business is
update or alter any forward-looking statements, whether as a result
                                                                                 to increase its market share in existing markets primarily by
of new information, future events or otherwise.
                                                                                 opening additional stores and to open stores in new markets
                                                                                 where the opportunity exists to become the leading specialty
BUSINESS
                                                                                 coffee retailer. In support of this strategy, Starbucks opened
Starbucks Corporation (together with its subsidiaries, “Starbucks”
                                                                                 634 new Company-operated stores during the fiscal year ended
or the “Company”), purchases and roasts high-quality whole
                                                                                 October 3, 2004 (“fiscal 2004”). Company-operated retail stores
bean coffees and sells them, along with fresh, rich-brewed
                                                                                 accounted for 84% of total net revenues during fiscal 2004.
coffees, Italian-style espresso beverages, cold blended beverages,
a variety of complementary food items, coffee-related accessories

The following table summarizes total Company-operated retail store data for the periods indicated:

                                                       Net stores opened during
                                                         the fiscal year ended                                            Stores open as of
                                             Oct 3, 2004                   Sept 28, 2003
                                              (53 Wks)                       (52 Wks)                      Oct 3, 2004                Sept 28, 2003
United States                                     514                         506                             4,293                          3,779
International:
      United Kingdom                               49                           51                              422                           373
      Canada                                       56                           29                              372                           316
      Thailand                                     11                            9                               49                            38
      Australia                                     4                            7                               44                            40
      Singapore                                    –                             3                               35                            35
Total International                              120                           99                               922                            802
Total Company-operated                           634                          605                             5,215                          4,581


Starbucks retail stores are typically located in high-traffic,                    All Starbucks stores offer a choice of regular and decaffeinated
high-visibility locations. Because the Company can vary the                      coffee beverages, a broad selection of Italian-style espresso
size and format, its stores are located in or near a variety of                  beverages, cold blended beverages, iced shaken refreshment
settings, including downtown and suburban retail centers,                        beverages and a selection of teas and distinctively packaged
office buildings and university campuses. While the Company                       roasted whole bean coffees. Starbucks stores also offer a
selectively locates stores in shopping malls, it focuses on locations            selection of fresh pastries and other food items, sodas, juices,
that provide convenient access for pedestrians and drivers. With                 coffee-making equipment and accessories, a selection of
the flexibility in store size and format, the Company also locates                compact discs, games and seasonal novelty items. Each
retail stores in select rural and off-highway locations to serve a               Starbucks store varies its product mix depending upon the size
broader array of customers outside major metropolitan markets                    of the store and its location. Larger stores carry a broad
and further expand brand awareness. To provide a greater                         selection of the Company’s whole bean coffees in various sizes
degree of access and convenience for nonpedestrian customers,                    and types of packaging, as well as an assortment of coffee and
the Company has increased focus on drive-thru retail stores. At                  espresso-making equipment and accessories such as coffee
the end of fiscal 2004, the Company had approximately 700                         grinders, coffee filters, storage containers, travel tumblers and
Company-operated drive-thru locations.                                           mugs. Smaller Starbucks stores and kiosks typically sell a full


                                                                                                                                                      13
                                                                                                                      Fiscal 2004 Annual Report
line of coffee beverages, a limited selection of whole bean            Starbucks has an equity ownership interest in licensee operations.
coffees and a few accessories such as travel tumblers and logo         During fiscal 2004, specialty revenues (which include royalties
mugs. In the United States and in International markets,               and fees from licensees, as well as product sales derived from
approximately 2,100 stores and 500 stores, respectively, carry a       Specialty Operations) accounted for 16% of total net revenues.
selection of grab-and-go sandwiches and salads. During fiscal
                                                                       Licensing
2004, the Company’s retail sales mix by product type was
                                                                       Although the Company does not generally relinquish operational
77% beverages, 14% food items, 5% whole bean coffees and
                                                                       control of its retail stores in the United States, in situations in
4% coffee-making equipment and other merchandise.
                                                                       which a master concessionaire or another company controls
In fiscal 2004, the Company introduced the Starbucks Hear               or can provide improved access to desirable retail space, the
Music™ Coffeehouse, a first-of-its-kind music store in Santa            Company licenses its operations. As part of these arrangements,
Monica, California. This Company-operated retail location              Starbucks receives license fees and royalties and sells coffee and
combines the Starbucks coffeehouse experience with an                  related products for resale in licensed locations. Employees
innovative new retail environment for customers to discover,           working in licensed retail locations must follow Starbucks
acquire and enjoy music. The Hear Music Coffeehouse gives              detailed store operating procedures and attend training classes
customers a hands-on guide to music discovery with its                 similar to those given to Company-operated store managers
interactive listening bar, and allows customers access to CD           and employees.
burning technology to create personalized CDs from a digital
                                                                       During fiscal 2004, Starbucks opened 417 licensed retail stores
library of music. Currently, Starbucks is testing the CD burning
                                                                       in the United States. As of October 3, 2004, the Company had
technology through its Hear Music™ media bars in select
                                                                       1,839 licensed stores in the United States. Product sales to and
Starbucks Company-operated retail stores.
                                                                       royalty and license fees from these stores accounted for 24% of
                                                                       specialty revenues in fiscal 2004.
Specialty Operations
The Company’s Specialty Operations strive to develop the
                                                                       The Company’s International licensed retail stores are operated
Starbucks brand outside the Company-operated retail store
                                                                       through a number of licensing arrangements, primarily with
environment through a number of channels. Starbucks strategy
                                                                       prominent retailers. During fiscal 2004, Starbucks expanded
is to reach customers where they work, travel, shop and dine
                                                                       its international presence by opening 293 new International
by establishing relationships with prominent third parties
                                                                       licensed stores, including the first stores in France and Cyprus.
that share the Company’s values and commitment to quality.
                                                                       At fiscal year end 2004, the Company’s International operating
These relationships take various forms, including licensing
                                                                       segment had a total of 1,515 licensed retail stores categorized by
arrangements, foodservice accounts and other initiatives related
                                                                       region and located as follows:
to the Company’s core businesses. In certain situations,

                    Asia Pacific                         Europe/Middle East/Africa                               Americas
  Japan                                534      Germany                              35         Canada                              66
  China                                152      Saudi Arabia                         32         Hawaii                              45
  Taiwan                               136      United Arab Emirates                 31         Mexico                              32
  South Korea                          102      Spain                                27         Chile                                9
  Philippines                           70      Kuwait                               27         Puerto Rico                          6
  Malaysia                              52      Greece                               25         Peru                                 3
  New Zealand                           36      Switzerland                          18
  Indonesia                             24      Turkey                               15
                                                Lebanon                              10
                                                Austria                               8
                                                Qatar                                 6
                                                Bahrain                               5
                                                France                                4
                                                Oman                                  3
                                                Cyprus                                2
  Total                               1,106                                         248                                             161


14        Fiscal 2004 Annual Report
Product sales to and royalty and license fee revenues from            institutional foodservice companies that service business,
International licensed retail stores accounted for 15% of specialty   industry, education and healthcare accounts, office coffee
revenues in fiscal 2004. In total, worldwide retail store licensing    distributors, hotels, restaurants, airlines and other retailers.
accounted for 39% of specialty revenues in fiscal 2004.                Beginning in fiscal 2003, the Company transitioned the majority
                                                                      of its U.S. foodservice accounts to SYSCO Corporation’s
In fiscal 2004, the Company expanded its licensing                     national broadline distribution network and aligned foodservice
relationship with Kraft Foods, Inc. (“Kraft”) to include              sales, customer service and support resources with those of
a larger selection of Starbucks® whole bean and ground                SYSCO Corporation. This alliance greatly improved customer
coffees, as well as Seattle’s Best Coffee® and Torrefazione           service levels and is expected to continue to generate new
Italia® branded coffees and a selection of premium Tazo®              foodservice accounts over the next several years. Starbucks and
teas, in grocery and warehouse club stores throughout the             Seattle’s Best Coffee are the only superpremium national-brand
United States. Kraft manages all distribution, marketing,             coffees actively promoted by SYSCO Corporation.
advertising and promotion and pays a royalty to Starbucks.
By the end of fiscal 2004, the Company’s coffees and teas              The Company’s total worldwide foodservice operations had
were available in approximately 20,000 grocery and warehouse          approximately 13,700 foodservice accounts at fiscal year end
club stores: 19,000 in the United States and 1,000 in                 2004, and revenues from these accounts comprised 31% of total
International markets. Revenues from this category comprised          specialty revenues.
27% of specialty revenues in fiscal 2004.
                                                                      Other Initiatives
The Company has licensed the rights to produce and distribute         The Company maintains a website at Starbucks.com where
Starbucks branded products to two partnerships in which the           customers may purchase, register or reload Starbucks stored
Company holds a 50% equity interest: The North American               value cards, as well as apply for the Starbucks Card Duetto™
Coffee Partnership with the Pepsi-Cola Company develops and           Visa® (the “Duetto Card”), issued through the Company’s
distributes bottled Frappuccino® and Starbucks DoubleShot®            agreement with Bank One Corporation and Visa. The Duetto
coffee drinks; and the Starbucks Ice Cream Partnership with           Card is a first-of-its-kind card, combining the functionality
Dreyer’s Grand Ice Cream, Inc., develops and distributes              of a credit card with the convenience of a reloadable
superpremium ice creams. In fiscal 2004, the Company entered           Starbucks Card. Additionally, the website contains information
into an agreement with Jim Beam Brands Co., a unit of Fortune         about the Company’s coffee products, brewing equipment and
Brands, Inc., to develop, manufacture and market a Starbucks-         store locations.
branded premium coffee liqueur product in the United States.
                                                                      In fiscal 2004, the Company entered into a strategic marketing
The Company conducted tests of this product in two U.S.
                                                                      alliance with XM Satellite Radio related to the debut of the
markets in the fiscal fourth quarter and expects to introduce
                                                                      24-hour Starbucks Hear Music™ channel 75. This channel is
the product nationally during the fiscal second quarter of
                                                                      available to all XM Satellite Radio subscribers, and Starbucks
2005 in retail locations licensed to sell distilled spirits, such
                                                                      customers will be able to enjoy the same programming when it
as restaurants, bars and retail outlets where premium distilled
                                                                      is launched in more than 4,000 Company-operated locations in
spirits are sold. The Company will not sell the liqueur product
                                                                      the United States during fiscal 2005. Collectively, the operations
in its Company-operated or licensed retail stores. The associated
                                                                      of these other initiatives accounted for 2% of specialty revenues
revenues from this category accounted for 1% of specialty
                                                                      in fiscal 2004.
revenues in fiscal 2004.

Foodservice Accounts
The Company sells whole bean and ground coffees, including
the Starbucks, Seattle’s Best Coffee and Torrefazione Italia
brands, as well as a selection of premium Tazo teas, to


                                                                                                                                     15
                                                                                                         Fiscal 2004 Annual Report
SELECTED FINANCIAL DATA
In thousands, except earnings per share and store operating data
The following selected financial data have been derived from the consolidated financial statements of Starbucks Corporation (the
“Company”). The data set forth below should be read in conjunction with “Management’s Discussion and Analysis of Financial
Condition and Results of Operations,” the section “Certain Additional Risks and Uncertainties” in the Company’s Annual Report on
Form 10-K and the Company’s consolidated financial statements and notes thereto.
                                                                           Oct 3,           Sept 28,           Sept 29,           Sept 30,            Oct 1,
                                                                           2004              2003               2002               2001               2000
As of and for the fiscal year ended (1)                                  (53 Wks)          (52 Wks)           (52 Wks)           (52 Wks)           (52 Wks)
RESULTS OF OPERATIONS DATA
Net revenues:
  Company-operated retail                                            $ 4,457,378       $ 3,449,624        $ 2,792,904        $ 2,229,594        $ 1,823,607
  Specialty:
     Licensing                                                             565,798           409,551            311,932            240,665            189,411
     Foodservice and other                                                 271,071           216,347            184,072            178,721            164,596
  Total specialty                                                          836,869           625,898            496,004            419,386            354,007
Total net revenues                                                       5,294,247         4,075,522          3,288,908          2,648,980          2,177,614

Operating income                                                           610,117           424,713            316,338            280,219           212,190
Internet-related investment losses (2)                                        –                 –                  –                 2,940            58,792
Gain on sale of investment (3)                                                –                 –                13,361               –                 –
Net earnings                                                         $     391,775     $     268,346      $     212,686      $     180,335      $     94,502
Net earnings per common share – diluted (4)                          $        0.95     $        0.67      $        0.54      $        0.46      $       0.24
Cash dividends per share                                                      –                 –                  –                  –                 –

BALANCE SHEET DATA
Working capital                                                      $   585,505       $   315,326        $   310,048        $   148,661        $   146,568
Total assets                                                           3,318,957         2,729,746          2,214,392          1,783,470          1,435,026
Long-term debt (including current portion)                                 4,353             5,076              5,786              6,483              7,168
Shareholders’ equity                                                 $ 2,486,755       $ 2,082,427        $ 1,723,189        $ 1,374,865        $ 1,148,212

STORE OPERATING DATA
Percentage change in comparable store sales (5)
  United States                                                                11%                 9%                 7%                 5%               9%
  International                                                                 6%                 7%                 1%                 3%              12%
  Consolidated                                                                 10%                 8%                 6%                 5%               9%

Stores opened during the year: (6) (7)
  United States
      Company-operated stores                                                  514                506                503                498              388
      Licensed stores                                                          417                315                264                268              342
  International
      Company-operated stores                                                   120                99                113                151               103
      Licensed stores                                                           293               281                297                291               170
Total                                                                         1,344             1,201              1,177              1,208             1,003
Stores open at year-end: (7)
  United States(8)
      Company-operated stores                                                 4,293             3,779              3,209              2,706             2,208
      Licensed stores                                                         1,839             1,422              1,033                769               501
  International
      Company-operated stores                                                   922               802                703                590               439
      Licensed stores                                                         1,515             1,222                941                644               353
Total                                                                         8,569             7,225              5,886              4,709             3,501
(1) The Company’s fiscal year ends on the Sunday closest to September 30.
(2) During fiscal 2001 and 2000, the Company recognized losses of $2.9 million and $58.8 million, respectively, for impairments of Internet-related
    investments determined to be other than temporary.
(3) On October 10, 2001, the Company sold 30,000 of its shares of Starbucks Coffee Japan, Ltd. at approximately $495 per share, net of related costs, which
    resulted in a gain of $13.4 million.
(4) Earnings per share data for fiscal years presented above have been restated to reflect the two-for-one stock split in fiscal 2001.
(5) Includes only Starbucks Company-operated retail stores open 13 months or longer. Comparable store sales percentage for fiscal 2004 excludes the extra
    sales week.
(6) Store openings are reported net of closures.
(7) International store information has been adjusted for the 100% acquisition of the Singapore operations by reclassifying historical information from Licensed
    stores to Company-operated stores.
(8) United States stores open at fiscal 2003 year end include 43 Seattle’s Best Coffee (“SBC”) and 21 Torrefazione Italia Company-operated stores and 74 SBC
    franchised stores.


16         Fiscal 2004 Annual Report
MANAGEMENT’S DISCUSSION AND ANALYSIS                                Since additional retail stores can leverage existing support
OF FINANCIAL CONDITION AND RESULTS                                  organizations and facilities, the Company’s infrastructure can
OF OPERATIONS                                                       be expanded more slowly than the rate of revenue growth
                                                                    and generate margin improvement. In fiscal 2004, operating
General
                                                                    income as a percentage of total net revenues increased to 11.5%
Starbucks Corporation’s fiscal year ends on the Sunday closest
                                                                    from 10.4% in fiscal 2003, and net earnings increased by
to September 30. The fiscal year ended on October 3, 2004,
                                                                    46.0%, compared to fiscal 2003. These results demonstrated
included 53 weeks, with the 53rd week falling in the fiscal
                                                                    the Company’s ability to improve operating margin despite
fourth quarter. Fiscal years 2003 and 2002 each had 52 weeks.
                                                                    pressures from rising dairy and green coffee commodity costs
Fiscal year 2005 will have 52 weeks.
                                                                    throughout the fiscal year. The Company’s International
                                                                    operations delivered a full year of positive operating results,
Management Overview
                                                                    primarily due to leverage gained on most operating expenses
During the fiscal year ended October 3, 2004, all areas of
                                                                    distributed over an expanded revenue base. In recent fiscal
Starbucks business, from U.S. and international Company-
                                                                    years, the Company made substantial infrastructure investments
operated retail operations to the Company’s specialty businesses,
                                                                    in corporate and regional support facilities and personnel, as
delivered strong financial performance, and innovation was
                                                                    well as established more efficient distribution networks. Such
prevalent throughout the Company’s operations. Starbucks
                                                                    investments were necessary to support the Company’s planned
believes the Company’s ability to achieve the balance between
                                                                    international expansion, which is now realizing substantial
growing the core business and building the foundation for
                                                                    benefit from this foundation.
future growth is the key to increasing shareholder value.
Starbucks fiscal 2004 performance provides a strong example of       Management believes that comparable store sales growth of
the Company’s commitment to achieve this balance.                   the level acheived during fiscal 2004 is not sustainable over
                                                                    the long term. However, management believes that new store
Historically, the primary driver of the Company’s revenue growth
                                                                    development opportunities on a global basis are sufficient for the
has been the opening of new retail stores, both Company-
                                                                    Company to maintain a high level of unit growth and that the
operated and licensed, in pursuit of the Company’s objective to
                                                                    execution of the current retail operating strategy can continue to
establish Starbucks as the most recognized and respected brand
                                                                    increase first year average store sales and comparable store sales.
in the world. With a presence today in more than 30 countries,
                                                                    These revenue growth opportunities, coupled with continuous
management believes that the Company’s long-term goal of
                                                                    focus on controlling both operating and capital costs, should
operating 15,000 Starbucks retail locations throughout the
                                                                    allow Starbucks to continue to modestly improve margins and
United States and at least 15,000 stores in International markets
                                                                    achieve annual revenue growth of approximately 20% and
is achievable.
                                                                    annual earnings per share growth of 20% –25% for the next
                                                                    three to five years.
In addition to opening new retail stores, Starbucks is targeting
to increase revenues generated at new and existing Company-
                                                                    Acquisitions
operated stores by attracting new customers and increasing
                                                                    In July 2004, Starbucks acquired 100% of its licensed
the frequency of visits by current customers. The strategy is
                                                                    operations in Singapore and acquired 49.9% of its licensed
to increase first year average store sales and comparable store
                                                                    operations in Malaysia, for a combined total of approximately
sales by continuously improving the level of customer service,
                                                                    $12.1 million. Previously, the Company did not have any
maintaining a steady stream of product innovation and
                                                                    equity ownership interests in these entities. The results of
improving the speed of service through training, technology and
                                                                    operations for Singapore are included in the accompanying
process improvement. For U.S. Company-operated stores opened
                                                                    consolidated financial statements from the date of acquisition.
in fiscal 2004, first year sales volumes are currently estimated at
                                                                    For its investment in Malaysia, management applied the
greater than $800,000 as a result of these efforts. Comparable
                                                                    equity method of accounting from the date of acquisition,
store sales for Company-operated markets increased by 10%,
                                                                    since the Company is able to exert significant influence over
making fiscal 2004 the 13th consecutive year with comparable
                                                                    the investee’s operating and financial policies.
store sales growth of 5% or greater.
                                                                    In July 2003, the Company acquired Seattle Coffee Company
In licensed retail operations, Starbucks shares operating and
                                                                    (“SCC”), which includes the Seattle’s Best Coffee® and
store development experience to help licensees improve the
                                                                    Torrefazione Italia® brands, from AFC Enterprises, Inc. for
profitability of existing stores and build new stores, which
                                                                    $70 million in cash. The results of operations of SCC are
generate additional royalty income and product sales. The
                                                                    included in the accompanying consolidated financial statements
Company’s strategy is to selectively increase its equity stake as
                                                                    from the date of acquisition.
International markets develop.
                                                                    During fiscal 2003, Starbucks increased its equity ownership to
The combination of more retail stores, higher revenues from
                                                                    50% of its International licensed operations in Austria, Shanghai,
existing stores, and growth in other business channels in
                                                                    Spain, Switzerland and Taiwan, which enabled the Company
both the United States and International operating segments
                                                                    to exert significant influence over their operating and financial
resulted in a 29.9% increase in total net revenues for the 53
                                                                    policies. For these operations, the Company reflected a change in
weeks of fiscal 2004, compared to the 52 weeks of fiscal 2003.
                                                                    accounting method during fiscal 2003, from the cost method to
Excluding the impact of the extra sales week in fiscal 2004,
                                                                    the equity method, in the consolidated financial statements.
total net revenues increased 27.3%. Both of these revenue
growth measures were above the Company’s three to five year
target of approximately 20%.


                                                                                                                                   17
                                                                                                       Fiscal 2004 Annual Report
RESULTS OF OPERATIONS – FISCAL 2004 COMPARED TO FISCAL 2003
The following table sets forth the percentage relationship to total net revenues, unless otherwise indicated, of certain items included
in the Company’s consolidated statements of earnings:

                                                                                         Oct 3, 2004       Sept 28, 2003    Sept 29, 2002
Fiscal year ended                                                                         (53 Wks)          (52 Wks)         (52 Wks)
STATEMENTS OF EARNINGS DATA
Net revenues:
   Company-operated retail                                                                  84.2%              84.6%            84.9%
   Specialty:
     Licensing                                                                              10.7              10.1              9.5
     Foodservice and other                                                                   5.1               5.3              5.6
  Total specialty                                                                           15.8              15.4             15.1
Total net revenues                                                                         100.0             100.0            100.0

Cost of sales including occupancy costs                                                     41.5               41.4             41.0
Store operating expenses (1)                                                                40.2               40.0             39.7
Other operating expenses (2)                                                                20.5               22.6             21.4
Depreciation and amortization expenses                                                       5.3                5.8              6.3
General and administrative expenses                                                          5.7                6.0              7.1

Income from equity investees                                                                 1.1                0.9              1.0
    Operating income                                                                        11.5               10.4              9.6

Interest and other income, net                                                               0.3                0.3              0.3
Gain on sale of investment                                                                   0.0                0.0              0.4
Earnings before income taxes                                                                11.8               10.7             10.3
Income taxes                                                                                 4.4                4.1              3.8
     Net earnings                                                                            7.4%               6.6%             6.5%

(1) Shown as a percentage of related Company-operated retail revenues.
(2) Shown as a percentage of related total specialty revenues.


Consolidated Results of Operations                                       growth in the grocery and warehouse club businesses was a result
                                                                         of expanded agreements with Kraft Foods, Inc., including the
Net revenues for the fiscal year ended 2004 increased 29.9% to
                                                                         addition of six new Starbucks coffees along with a selection of
$5.3 billion from $4.1 billion for the 52-week period of fiscal
                                                                         Tazo® teas and the acquisition of Seattle Coffee Company in the
2003. Net revenues increased 27.3% when calculated on a
                                                                         fourth quarter of fiscal 2003.
comparative 52-week basis for both fiscal 2004 and 2003.
During the fiscal year ended 2004, Starbucks derived 84% of
                                                                         Foodservice and other revenues increased 25.3% to $271
total net revenues from its Company-operated retail stores.
                                                                         million for the fiscal year ended 2004, from $216 million for
Company-operated retail revenues increased 29.2% to $4.5
                                                                         the 52-week period of fiscal 2003. The increase was primarily
billion for the fiscal year ended 2004, from $3.4 billion for the
                                                                         attributable to the growth in new and existing foodservice
52-week period of fiscal 2003. Company-operated retail revenues
                                                                         accounts, which benefited from the July 2003 acquisition of
increased 26.7% when calculated on a comparative 52-week
                                                                         Seattle Coffee Company.
basis for both fiscal 2004 and 2003. This increase was primarily
due to the opening of 634 new Company-operated retail stores             Cost of sales and related occupancy costs increased to 41.5%
during the previous 12 months and comparable store sales growth          of total net revenues in fiscal 2004, from 41.4% in fiscal 2003.
of 10%. The increase in comparable store sales was due to                The increase was primarily due to higher dairy and green
a 9% increase in the number of customer transactions and a               coffee commodity costs, partially offset by leverage gained on
1% increase in the average value per transaction. Comparable             occupancy costs, which are primarily fixed expenses.
store sales growth percentages were calculated excluding the
                                                                         Store operating expenses as a percentage of Company-operated
extra week of fiscal 2004. Management believes increased
                                                                         retail revenues increased to 40.2% in fiscal 2004, from 40.0%
customer traffic continues to be driven by new product
                                                                         in fiscal 2003, primarily due to higher marketing expenditures
innovation, continued popularity of core products, a high level of
                                                                         for holiday and new product promotions, as well as increased
customer satisfaction and improved speed of service through
                                                                         costs to maintain retail stores and equipment due to sustained
enhanced technology, training and execution at retail stores.
                                                                         high traffic levels.
The Company derived the remaining 16% of total net revenues
                                                                         Other operating expenses (expenses associated with the
from its Specialty Operations. Specialty revenues, which include
                                                                         Company’s Specialty Operations) decreased to 20.5% of
licensing revenues and foodservice and other revenues, increased
                                                                         specialty revenues in fiscal 2004, compared to 22.6% in fiscal
33.7% to $837 million for the fiscal year ended 2004, from
                                                                         2003. The decrease was primarily due to leverage gained on
$626 million for the 52-week period of fiscal 2003. Excluding
                                                                         payroll-related expenditures distributed over an expanded
the impact of the extra sales week in fiscal 2004, total specialty
                                                                         revenue base.
revenues increased 31.0% to $820 million.
                                                                         Depreciation and amortization expenses increased to $280
Licensing revenues, which are derived from retail store licensing
                                                                         million in fiscal 2004, from $238 million in fiscal 2003. The
arrangements, grocery and warehouse club licensing, and certain
                                                                         increase was primarily due to a net increase of 634 new
other branded-product licensed operations, increased 38.2% to
                                                                         Company-operated retail stores during the previous 12 months
$566 million for the fiscal year ended 2004, from $410 million
                                                                         and higher depreciation expenses associated with shortened
for the 52-week period of fiscal 2003. The increase was due to
                                                                         estimated useful lives of equipment deployed in the Company’s
higher product sales and royalty revenues from the addition of
                                                                         foodservice operations. As a percentage of total net revenues,
710 new licensed retail stores during the previous 12 months
                                                                         depreciation and amortization decreased to 5.3% for the 53
and growth in the grocery and warehouse club businesses. The


18      Fiscal 2004 Annual Report
weeks ended October 3, 2004, from 5.8% for the corresponding                       primarily due to volume-driven operating results for The
52-week fiscal 2003 period, primarily due to the leverage of                        North American Coffee Partnership, which produces bottled
fixed depreciation expenses from the extra sales week in 2004.                      Frappuccino® and Starbucks DoubleShot® coffee drinks,
                                                                                   and improved profitability of Starbucks Coffee Japan, Ltd.
General and administrative expenses increased to $304 million in                   (“Starbucks Japan”). The July 2003 increase in the Company’s
fiscal 2004, compared to $245 million in fiscal 2003, primarily due                  ownership interest from 5% to 50% in the Taiwan and Shanghai
to higher payroll-related expenditures. As a percentage of total net               licensed operations also contributed to the growth.
revenues, general and administrative expenses decreased to 5.7%
for the 53 weeks ended October 3, 2004, from 6.0% for the                          Net interest and other income, which primarily consists of
52 weeks ended September 28, 2003.                                                 interest income, increased to $14 million in fiscal 2004, from
                                                                                   $12 million in fiscal 2003. The growth was a result of interest
Operating income increased 43.7% to $610 million in fiscal                          income earned on higher cash and liquid investment balances
2004, from $425 million in fiscal 2003. The operating margin                        during fiscal 2004, compared to the prior year.
increased to 11.5% of total net revenues in fiscal 2004, compared
to 10.4% in fiscal 2003, primarily due to leverage gained                           Income taxes for the 53 weeks ended October 3, 2004, resulted
on most fixed operating costs distributed over an expanded                          in an effective tax rate of 37.2%, compared to 38.5% in fiscal
revenue base, partially offset by higher dairy and green coffee                    2003. The lower effective tax rate was primarily due to improved
commodity costs.                                                                   operating results as fewer nondeductible losses were generated
                                                                                   from international markets, which are in various phases
Income from equity investees was $61 million in fiscal 2004,                        of development.
compared to $38 million in fiscal 2003. The increase was

Operating Segments
Segment information is prepared on the same basis that the Company’s management reviews financial information for operational
decision-making purposes.
The following tables summarize the Company’s results of operations by segment for fiscal 2004 and 2003 (in thousands):
                                                                      % of                                 % of                            % of
                                                                   United States                       International       Unallocated   Total Net
53 weeks ended October 3, 2004                     United States    Revenue            International     Revenue           Corporate     Revenue       Consolidated
Net revenues:
  Company-operated retail                      $ 3,800,367            84.6%        $     657,011          81.8%        $       –             –%      $ 4,457,378
  Specialty:
     Licensing                                        436,981          9.7               128,817          16.0                 –             –            565,798
     Foodservice and other                            253,502          5.7                17,569           2.2                 –             –            271,071
  Total specialty                                     690,483         15.4               146,386          18.2                 –             –            836,869
Total net revenues                                  4,490,850        100.0               803,397         100.0                 –             –          5,294,247

Cost of sales and related occupancy costs           1,789,502         39.8               409,152          50.9                –              –          2,198,654
                                                                      40.7 (1)                            37.0 (1)
Store operating expenses                            1,546,871                            243,297                              –              –          1,790,168
                                                                      21.0 (2)                            18.3 (2)
Other operating expenses                              144,853                             26,795                              –              –            171,648
Depreciation and amortization expenses                201,703          4.5                45,783           5.7                32,538        0.6           280,024
General and administrative expenses                    80,221          1.8                48,206           6.0               175,866        3.3           304,293

Income from equity investees                           37,453          0.8                23,204            2.9            –                 –             60,657
  Operating income/(loss)                      $      765,153         17.0%        $      53,368            6.6%       $ (208,404)          (3.9)% $      610,117

                                                                      % of                                 % of                            % of
                                                                   United States                       International       Unallocated   Total Net
52 weeks ended September 28, 2003                  United States    Revenue            International     Revenue           Corporate     Revenue       Consolidated

Net revenues:
  Company-operated retail                      $ 2,965,618            85.4%        $     484,006          80.3%        $       –             –%      $ 3,449,624
  Specialty:
     Licensing                                        301,175          8.7               108,376          18.0                 –             –            409,551
     Foodservice and other                            205,659          5.9                10,688           1.7                 –             –            216,347
  Total specialty                                     506,834         14.6               119,064          19.7                 –             –            625,898
Total net revenues                                  3,472,452        100.0               603,070         100.0                 –             –          4,075,522

Cost of sales and related occupancy costs           1,363,267         39.3               322,661          53.5                –              –          1,685,928
                                                                      40.4 (1)                            37.3 (1)
Store operating expenses                            1,199,020                            180,554                              –              –          1,379,574
                                                                      23.7 (2)                            18.0 (2)
Other operating expenses                              119,960                             21,386                              –              –            141,346
Depreciation and amortization expenses                167,138          4.8                38,563           6.4                32,106        0.8           237,807
General and administrative expenses                    45,007          1.3                44,352           7.4               155,191        3.8           244,550
Income from equity investees                           28,484          0.8                 9,912            1.6             –                –             38,396
  Operating income/(loss)                      $      606,544         17.5%        $       5,466            0.9%       $ (187,297)          (4.6)% $      424,713

(1) Shown as a percentage of related Company-operated retail revenues.
(2) Shown as a percentage of related total specialty revenues.


                                                                                                                                                                19
                                                                                                                                   Fiscal 2004 Annual Report
United States                                                        countries. International operations are in various early stages of
The Company’s United States operations (“United States”)             development and have country-specific regulatory requirements
represent 85% of Company-operated retail revenues, 83% of            that necessitate a more extensive support organization, relative to
total specialty revenues and 85% of total net revenues. United       the current levels of revenue and operating income, than in the
States operations sell coffee and other beverages, whole bean        United States.
coffees, complementary food, coffee brewing equipment and
                                                                     International total net revenues increased $200 million, or
merchandise primarily through Company-operated retail stores.
                                                                     33.2%, to $803 million for the fiscal year ended 2004, compared
Specialty Operations within the United States include licensed
                                                                     to $603 million for the 52-week period of fiscal 2003. Excluding
retail stores and other licensing operations, foodservice accounts
                                                                     the impact of the extra sales week in fiscal 2004, International
and other initiatives related to the Company’s core businesses.
                                                                     total net revenues increased 30.6%. International Company-
United States total net revenues increased by $1.0 billion, or       operated retail revenues increased $173 million, or 35.7%, to
29.3%, to $4.5 billion for the fiscal year ended 2004, compared       $657 million for the fiscal year ended 2004, compared to $484
to $3.5 billion for the 52-week period of fiscal 2003. Excluding      million for the 52-week period of fiscal 2003. The increase was
the impact of the extra sales week in fiscal 2004, United States      primarily due to the opening of 120 new Company-operated
total net revenues increased 26.8% to $4.4 billion. United States    retail stores during the previous 12 months, the weakening
Company-operated retail revenues increased by $835 million, or       of the U.S. dollar against both the British pound sterling and
28.1%, to $3.8 billion for the fiscal year ended 2004, compared       Canadian dollar, and comparable store sales growth of 6%. The
to $3.0 billion for the 52-week period of fiscal 2003, primarily      increase in comparable store sales resulted from a 5% increase in
due to the opening of 514 new Company-operated retail stores         the number of customer transactions and a 1% increase in the
during the previous 12 months and comparable store sales             average value per transaction. Excluding the impact of the extra
growth of 11%. The increase in comparable store sales was due        sales week in fiscal 2004, International Company-operated
to a 10% increase in the number of customer transactions and a       retail revenues increased 33.0% to $644 million.
1% increase in the average value per transaction. Management
                                                                     Total International specialty revenues increased $27 million, or
believes increased customer traffic continues to be driven by
                                                                     22.9%, to $146 million for the fiscal year ended 2004, compared
new product innovation, continued popularity of core products,
                                                                     to $119 million for the 52-week period of fiscal 2003. Excluding
a high level of customer satisfaction and improved speed of
                                                                     the impact of the extra sales week in fiscal 2004, International
service through enhanced technology, training and execution
                                                                     specialty revenues increased 20.6% to $144 million. The increase
at retail stores. Excluding the impact of the extra sales week in
                                                                     was primarily due to higher product sales and royalty revenues
fiscal 2004, United States Company-operated retail revenues
                                                                     from opening 293 new licensed retail stores during the previous
increased 25.7% to $3.7 billion.
                                                                     12 months, partially offset by proportionate eliminations of
Total United States specialty revenues increased $184 million,       sales to equity investees in which the Company increased its
or 36.2%, to $690 million for the fiscal year ended 2004,             ownership interest in late fiscal 2003.
compared to $507 million in the 52-week period of fiscal
                                                                     International operating income increased to $53 million for the
2003. Excluding the impact of the extra sales week in fiscal
                                                                     fiscal year ended 2004, compared to $5 million in the 52-week
2004, United States specialty revenues increased 33.4% to
                                                                     period of fiscal 2003. Operating margin increased to 6.6% of
$676 million. United States licensing revenues increased
                                                                     related revenues from 0.9% in the 52-week period of fiscal 2003,
$136 million, or 45.1%, to $437 million, compared to $301
                                                                     primarily due to leverage gained on most fixed costs distributed
million for the 52-week period of fiscal 2003. The increase
                                                                     over an expanded revenue base.
was primarily due to volume-driven growth in the grocery and
warehouse club businesses as a result of expanded agreements
                                                                     Unallocated Corporate
with Kraft Foods, Inc., including the addition of six new
                                                                     Unallocated corporate expenses pertain to certain functions,
Starbucks coffees along with a selection of Tazo® teas. In
                                                                     such as executive management, accounting, administration,
addition, product sales and royalty revenues increased as a
                                                                     tax, treasury and information technology infrastructure,
result of opening 417 new licensed retail stores during the
                                                                     that support but are not specifically attributable to the
previous 12 months. Foodservice and other revenues increased
                                                                     Company’s operating segments and include related depreciation
$48 million, or 23.3%, to $254 million from $206 million
                                                                     and amortization expenses. Unallocated corporate expenses
in fiscal 2003, due to both the addition of new and existing
                                                                     increased to $208 million for the fiscal year ended 2004, from
Starbucks and Seattle Coffee Company foodservice accounts.
                                                                     $187 million in the 52-week period of fiscal 2003, primarily due
                                                                     to higher provisions for incentive compensation based on the
United States operating income increased by 26.1% to $765
                                                                     Company’s performance and other payroll-related expenditures.
million for the fiscal year ended 2004, from $607 million for
                                                                     Total unallocated corporate expenses as a percentage of total
the fiscal year ended 2003. Operating margin decreased to
                                                                     net revenues decreased to 3.9% for the fiscal year ended 2004,
17.0% of related revenues from 17.5% in the 52-week period
                                                                     compared to 4.6% for the 52-week period of fiscal 2003.
of fiscal 2003, primarily due to higher dairy and green coffee
commodity costs, as well as higher payroll-related expenditures
to support the Company’s accelerated retail store growth.            RESULTS OF OPERATIONS – FISCAL 2003
These increases were partially offset by leverage gained on fixed     COMPARED TO FISCAL 2002
occupancy costs distributed over an expanded revenue base.
                                                                     Consolidated Results of Operations
                                                                     Net revenues for the fiscal year ended 2003 increased 23.9% to
International
                                                                     $4.1 billion, from $3.3 billion for the corresponding fiscal 2002
The Company’s international operations (“International”)
                                                                     period. During the fiscal year ended 2003, Starbucks derived
represent the remaining 15% of Company-operated retail
                                                                     85% of total net revenues from its Company-operated retail
revenues, 17% of total specialty revenues and 15% of total net
                                                                     stores. Company-operated retail revenues increased 23.5% to
revenues. International sells coffees and other beverages, whole
                                                                     $3.4 billion for the fiscal year ended 2003, from $2.8 billion
bean coffees, complementary food, coffee brewing equipment
                                                                     for the corresponding fiscal 2002 period. This increase was due
and merchandise through Company-operated retail stores
                                                                     primarily to the opening of 602 new Company-operated retail
in Canada, the United Kingdom, Thailand, Australia and
                                                                     stores during the previous 12 months, comparable store sales
Singapore, as well as through retail store licensing operations
                                                                     growth of 8% driven almost entirely by increased transactions,
and foodservice accounts in these and more than 20 other
                                                                     and the July 2003 acquisition of 49 Seattle’s Best Coffee and 21


20     Fiscal 2004 Annual Report
Torrefazione Italia stores.                                        regional offices and field personnel.
The Company derived the remaining 15% of total net revenues        Depreciation and amortization expenses increased to $237.8
from its Specialty Operations. Specialty revenues, which include   million in fiscal 2003, from $205.6 million in fiscal 2002,
licensing revenues and foodservice and other revenues, increased   primarily due to opening 602 Company-operated retail stores
$129.9 million, or 26.2%, to $625.9 million for the fiscal year     during the previous 12 months and the refurbishment of
ended 2003, from $496.0 million for the corresponding fiscal        existing Company-operated retail stores.
2002 period.
                                                                   General and administrative expenses increased to $244.6 million
Licensing revenues, which are derived from retail store            in fiscal 2003, compared to $234.6 million in fiscal 2002, which
licensing arrangements, grocery and warehouse club licensing       included an $18.0 million charge for the litigation settlement of
and certain other branded-product licensed operations,             two California class action lawsuits. Excluding the litigation
increased 31.3% to $409.6 million for the fiscal year ended         charge, general and administrative expenses increased $28.0
2003, from $311.9 million for the corresponding fiscal 2002         million from the comparable fiscal 2002 period due to higher
period. The increase was due to higher product sales and           payroll-related expenditures and costs related to the acquisition
royalty revenues from opening 599 new licensed retail stores       of Seattle Coffee Company. General and administrative
during the previous 12 months and growth in the licensed           expenses as a percentage of total net revenues decreased to 6.0%
grocery and warehouse club businesses.                             in fiscal 2003, compared to 7.1% in fiscal 2002.
Foodservice and other revenues increased 17.5% to $216.3           Operating income increased 34.3% to $424.7 million in fiscal
million for the fiscal year ended 2003, from $184.1 million         2003, from $316.3 million in fiscal 2002. The operating margin
for the corresponding fiscal 2002 period. The increase was          increased to 10.4% of total net revenues in fiscal 2003, compared
primarily attributable to broader distribution and growth in       to 9.6% in fiscal 2002, primarily due to leverage gained on fixed
new and existing foodservice accounts.                             costs distributed over an expanding revenue base, partially offset
                                                                   by higher green coffee costs, as discussed above.
Cost of sales and related occupancy costs increased to 41.4%
of total net revenues in fiscal 2003, from 41.0% in fiscal 2002.     Income from equity investees was $38.4 million in fiscal
The increase was primarily due to higher green coffee costs        2003, compared to $33.4 million in fiscal 2002. The increase
and a shift in specialty revenue mix to lower margin products.     was mainly attributable to continued strong results by The
The Company’s green coffee costs reached a historic low for        North American Coffee Partnership, the Company’s 50%-
Starbucks in the second and third fiscal quarters of 2002 and       owned partnership with the Pepsi-Cola Company, from
have gradually increased since then. These increases were          expanded ready-to-drink product lines, lower direct costs and
partially offset by leverage gained on fixed occupancy costs        manufacturing efficiencies. Partially offsetting this increase
distributed over an expanded revenue base.                         was the Company’s proportionate share of the net losses of
                                                                   Starbucks Japan in fiscal 2003, compared to a net profit in fiscal
Store operating expenses as a percentage of Company-operated       2002, primarily due to lower average sales per store.
retail revenues increased to 40.0% in fiscal 2003, from 39.7%
in fiscal 2002, primarily due to higher payroll-related and         Net interest and other income, which primarily consists of
advertising expenditures. Payroll-related costs have increased     interest income, increased to $11.6 million in fiscal 2003, from
primarily due to an increase in the number of partners eligible    $9.3 million in fiscal 2002. The growth was a result of increased
to participate in the Company’s medical and vacation benefits.      interest received on higher balances of cash, cash equivalents
Advertising expenditures increased in fiscal 2003 due to            and liquid securities during fiscal 2003, compared to the prior
promotions for new and existing products. These increases          year, as well as gains realized on market revaluations of the
were partially offset by lower provisions for asset impairment     Company’s trading securities, compared to realized losses on
for International Company-operated retail stores in 2003 as        this portfolio in the prior year.
compared to the prior year.
                                                                   The Company’s effective tax rate for fiscal 2003 was 38.5%
Other operating expenses (expenses associated with the             compared to 37.3% in fiscal 2002, as a result of a shift in the
Company’s Specialty Operations) were 22.6% of specialty            composition of the Company’s pretax earnings in fiscal 2003.
revenues in fiscal 2003, compared to 21.4% in fiscal 2002,           Operations taxed in the United States had higher pretax earnings
primarily due to higher payroll-related expenditures to support    and International operations generated greater nondeductible
the continued development of the Company’s foodservice             losses during fiscal 2003 than during fiscal 2002.
distribution network and international infrastructure, including


                                                                                                                                  21
                                                                                                      Fiscal 2004 Annual Report
Segment Results of Operations
The following tables summarize the Company’s results of operations by segment for fiscal 2003 and 2002 (in thousands):

                                                                      % of                                 % of                            % of
                                                                   United States                       International       Unallocated   Total Net
52 weeks ended September 28, 2003                  United States    Revenue            International     Revenue           Corporate     Revenue      Consolidated
Net revenues:
  Company-operated retail                      $ 2,965,618            85.4%        $     484,006          80.3%        $       –            –%       $ 3,449,624
  Specialty:
     Licensing                                        301,175          8.7               108,376          18.0                 –            –            409,551
     Foodservice and other                            205,659          5.9                10,688           1.7                 –            –            216,347
  Total specialty                                     506,834         14.6               119,064          19.7                 –            –            625,898
Total net revenues                                  3,472,452        100.0               603,070         100.0                 –            –          4,075,522

Cost of sales and related occupancy costs           1,363,267         39.3               322,661          53.5                –              –         1,685,928
                                                                      40.4 (1)                            37.3 (1)
Store operating expenses                            1,199,020                            180,554                              –              –         1,379,574
                                                                      23.7 (2)                            18.0 (2)
Other operating expenses                              119,960                             21,386                              –              –           141,346
Depreciation and amortization expenses                167,138          4.8                38,563           6.4                32,106        0.8          237,807
General and administrative expenses                    45,007          1.3                44,352           7.4               155,191        3.8          244,550

Income from equity investees                           28,484          0.8                 9,912            1.6            –                 –            38,396
  Operating income/(loss)                      $      606,544         17.5%        $       5,466            0.9%       $ (187,297)         (4.6)% $      424,713

                                                                      % of                                 % of                            % of
                                                                   United States                       International       Unallocated   Total Net
52 weeks ended September 29, 2002                  United States    Revenue            International     Revenue           Corporate     Revenue      Consolidated
Net revenues:
  Company-operated retail                      $ 2,425,163            85.7%        $     367,741          79.8%        $       –            –%       $ 2,792,904
  Specialty:
     Licensing                                        227,711          8.1                84,221          18.3                 –            –            311,932
     Foodservice and other                            175,379          6.2                 8,693           1.9                 –            –            184,072
  Total specialty                                     403,090         14.3                92,914          20.2                 –            –            496,004
Total net revenues                                  2,828,253        100.0               460,655         100.0                 –            –          3,288,908

Cost of sales and related occupancy costs           1,114,535         39.4               235,476          51.1                –              –         1,350,011
                                                                      39.7 (1)                            40.3 (1)
Store operating expenses                              961,617                            148,165                              –              –         1,109,782
                                                                      21.8 (2)                            19.8 (2)
Other operating expenses                               87,718                             18,366                              –              –           106,084
Depreciation and amortization expenses                142,752          5.0                34,069           7.4                28,736        0.9          205,557
General and administrative expenses                    33,928          1.2                35,007           7.6               165,646        5.0          234,581

Income from equity investees                           19,182          0.7                14,263            3.1            –                –             33,445
  Operating income/(loss)                      $      506,885         17.9%        $       3,835            0.8%       $ (194,382)         (5.9)% $      316,338

(1) Shown as a percentage of related Company-operated retail revenues.
(2) Shown as a percentage of related total specialty revenues.


United States                                                                      International
United States total net revenues increased by $644.2 million,                      International total net revenues increased $142.4 million, or
or 22.8%, to $3.5 billion in fiscal year 2003 from $2.8 billion                     30.9%, to $603.1 million in fiscal 2003, from $460.7 million for
in fiscal 2002. United States Company-operated retail revenues                      the corresponding fiscal 2002 period. International Company-
increased $540.5 million, or 22.3%, to $3.0 billion, primarily                     operated retail revenues increased $116.3 million, or 31.6%,
due to the opening of 506 new Company-operated retail stores                       to $484.0 million, primarily due to the opening of 96 new
in fiscal 2003 and comparable store sales growth of 9%. The                         Company-operated retail stores in fiscal 2003 and comparable
increase in comparable store sales was almost entirely due to                      store sales growth of 7%. The increase in comparable store sales
higher transaction volume.                                                         was almost entirely due to higher transaction volume and reflects
                                                                                   the improved operational execution in the U.K. market.
Total United States specialty revenues increased $103.7 million,
or 25.7%, to $506.8 million in fiscal 2003, compared to $403.1                      Total International specialty revenues increased $26.1 million,
million in fiscal 2002. United States licensing revenues increased                  or 28.1%, to $119.1 million in fiscal 2003, from $92.9 million
$73.5 million, or 32.3%, to $301.1 million in fiscal 2003. The                      in fiscal 2002. The increase was primarily due to higher product
increase was primarily due to higher product sales and royalty                     sales and royalty revenues from opening 284 new licensed retail
revenues as a result of opening 315 new licensed retail stores                     stores during the previous 12 months.
during the previous 12 months and growth in the grocery and
                                                                                   International operating income increased 42.5% to $5.5 million
warehouse club businesses. United States foodservice and other
                                                                                   in fiscal 2003, from $3.8 million in fiscal 2002. Operating
revenues increased $30.3 million, or 17.3%, to $205.7 million in
                                                                                   margin increased to 0.9% of related revenues from 0.8% in
fiscal 2003, due to broader distribution and growth in new and
                                                                                   the corresponding fiscal 2003 period, primarily due to lower
existing foodservice accounts.
                                                                                   provisions recorded for retail store asset impairment and disposals
United States operating income increased 19.7% to $606.5                           of $3.7 million in fiscal 2003, compared to $13.9 million in fiscal
million in fiscal 2003, from $506.9 million in fiscal 2002.                          2002. This was partially offset by International’s proportionate
Operating margin decreased to 17.5% of related revenues from                       share of net losses in Starbucks Japan and a shift in sales mix to
17.9% in the prior year, primarily due to higher green coffee                      lower-margin products.
costs and payroll-related expenditures, partially offset by fixed
occupancy costs distributed over an expanding revenue base.


22       Fiscal 2004 Annual Report
starbucks  Annual_Report_2004_part2

Mais conteúdo relacionado

Mais procurados

baxter international Schedules_Q2-05
baxter international Schedules_Q2-05baxter international Schedules_Q2-05
baxter international Schedules_Q2-05finance24
 
CloroxAR08_Complete
CloroxAR08_CompleteCloroxAR08_Complete
CloroxAR08_Completefinance48
 
whirlpool Annual Report2005
whirlpool Annual Report2005whirlpool Annual Report2005
whirlpool Annual Report2005finance13
 
southwest airline ar07
southwest airline ar07southwest airline ar07
southwest airline ar07finance40
 
telephone data systems USM2007AnnualReport
telephone data systems  USM2007AnnualReporttelephone data systems  USM2007AnnualReport
telephone data systems USM2007AnnualReportfinance48
 
WESCO AR 2007
WESCO AR 2007WESCO AR 2007
WESCO AR 2007finance34
 
Goldman Sachs Global Industrials Conference - Presentation
Goldman Sachs Global Industrials Conference - PresentationGoldman Sachs Global Industrials Conference - Presentation
Goldman Sachs Global Industrials Conference - Presentationfinance13
 
emerson electricl annual reports 2008
emerson electricl annual reports 2008emerson electricl annual reports 2008
emerson electricl annual reports 2008finance12
 
omnicom group Q3 2004 Investor Presentation (pdf)
omnicom group  Q3 2004 Investor Presentation (pdf)omnicom group  Q3 2004 Investor Presentation (pdf)
omnicom group Q3 2004 Investor Presentation (pdf)finance22
 

Mais procurados (12)

baxter international Schedules_Q2-05
baxter international Schedules_Q2-05baxter international Schedules_Q2-05
baxter international Schedules_Q2-05
 
CloroxAR08_Complete
CloroxAR08_CompleteCloroxAR08_Complete
CloroxAR08_Complete
 
whirlpool Annual Report2005
whirlpool Annual Report2005whirlpool Annual Report2005
whirlpool Annual Report2005
 
southwest airline ar07
southwest airline ar07southwest airline ar07
southwest airline ar07
 
telephone data systems USM2007AnnualReport
telephone data systems  USM2007AnnualReporttelephone data systems  USM2007AnnualReport
telephone data systems USM2007AnnualReport
 
WESCO AR 2007
WESCO AR 2007WESCO AR 2007
WESCO AR 2007
 
bn annual99
bn annual99bn annual99
bn annual99
 
Goldman Sachs Global Industrials Conference - Presentation
Goldman Sachs Global Industrials Conference - PresentationGoldman Sachs Global Industrials Conference - Presentation
Goldman Sachs Global Industrials Conference - Presentation
 
Toronto rental market
Toronto rental marketToronto rental market
Toronto rental market
 
emerson electricl annual reports 2008
emerson electricl annual reports 2008emerson electricl annual reports 2008
emerson electricl annual reports 2008
 
omnicom group Q3 2004 Investor Presentation (pdf)
omnicom group  Q3 2004 Investor Presentation (pdf)omnicom group  Q3 2004 Investor Presentation (pdf)
omnicom group Q3 2004 Investor Presentation (pdf)
 
U.S. Airlines Economic Review
U.S. Airlines Economic ReviewU.S. Airlines Economic Review
U.S. Airlines Economic Review
 

Semelhante a starbucks Annual_Report_2004_part2

nordstrom AnnualReport2006
nordstrom AnnualReport2006nordstrom AnnualReport2006
nordstrom AnnualReport2006finance43
 
nordstrom AnnualReport2006
nordstrom AnnualReport2006nordstrom AnnualReport2006
nordstrom AnnualReport2006finance43
 
southwest airline ar03
southwest airline ar03southwest airline ar03
southwest airline ar03finance40
 
ecolab Ecolab_2004_Final
ecolab  Ecolab_2004_Finalecolab  Ecolab_2004_Final
ecolab Ecolab_2004_Finalfinance37
 
ecolab Ecolab_BusDesc_FinHigh
ecolab  Ecolab_BusDesc_FinHighecolab  Ecolab_BusDesc_FinHigh
ecolab Ecolab_BusDesc_FinHighfinance37
 
southwest airline ar02
southwest airline ar02southwest airline ar02
southwest airline ar02finance40
 
nordstrom AR_FULL
nordstrom AR_FULLnordstrom AR_FULL
nordstrom AR_FULLfinance43
 
loews 2 CNA Lilienthal Mense
loews 2 CNA Lilienthal Mense loews 2 CNA Lilienthal Mense
loews 2 CNA Lilienthal Mense finance14
 
southwest airline ar04
southwest airline ar04southwest airline ar04
southwest airline ar04finance40
 
WESCO AR 2007
WESCO AR 2007WESCO AR 2007
WESCO AR 2007finance34
 
whirlpool Annual Report2006
whirlpool Annual Report2006whirlpool Annual Report2006
whirlpool Annual Report2006finance13
 
whirlpool Financial Highlights / Chairman's Letter
whirlpool Financial Highlights / Chairman's Letterwhirlpool Financial Highlights / Chairman's Letter
whirlpool Financial Highlights / Chairman's Letterfinance13
 
Joe Harlan Presentation
Joe Harlan PresentationJoe Harlan Presentation
Joe Harlan Presentationfinance10
 
ecolab BusinessFinancial
ecolab  BusinessFinancialecolab  BusinessFinancial
ecolab BusinessFinancialfinance37
 
home depot Annual Report 2005
home depot Annual Report 2005home depot Annual Report 2005
home depot Annual Report 2005finance2
 
Arvinmeritor2001 Annual Report
Arvinmeritor2001 Annual ReportArvinmeritor2001 Annual Report
Arvinmeritor2001 Annual Reportfinance27
 
emerson electricl Proxy Statement for 2009 Annual Shareholders Meeting
emerson electricl Proxy Statement for 2009 Annual Shareholders Meeting  emerson electricl Proxy Statement for 2009 Annual Shareholders Meeting
emerson electricl Proxy Statement for 2009 Annual Shareholders Meeting finance12
 

Semelhante a starbucks Annual_Report_2004_part2 (20)

nordstrom AnnualReport2006
nordstrom AnnualReport2006nordstrom AnnualReport2006
nordstrom AnnualReport2006
 
nordstrom AnnualReport2006
nordstrom AnnualReport2006nordstrom AnnualReport2006
nordstrom AnnualReport2006
 
southwest airline ar03
southwest airline ar03southwest airline ar03
southwest airline ar03
 
ecolab Ecolab_2004_Final
ecolab  Ecolab_2004_Finalecolab  Ecolab_2004_Final
ecolab Ecolab_2004_Final
 
ecolab Ecolab_BusDesc_FinHigh
ecolab  Ecolab_BusDesc_FinHighecolab  Ecolab_BusDesc_FinHigh
ecolab Ecolab_BusDesc_FinHigh
 
southwest airline ar02
southwest airline ar02southwest airline ar02
southwest airline ar02
 
nordstrom AR_FULL
nordstrom AR_FULLnordstrom AR_FULL
nordstrom AR_FULL
 
loews 2 CNA Lilienthal Mense
loews 2 CNA Lilienthal Mense loews 2 CNA Lilienthal Mense
loews 2 CNA Lilienthal Mense
 
southwest airline ar04
southwest airline ar04southwest airline ar04
southwest airline ar04
 
WESCOAR2007
WESCOAR2007WESCOAR2007
WESCOAR2007
 
WESCO AR 2007
WESCO AR 2007WESCO AR 2007
WESCO AR 2007
 
WESCOAR2007
WESCOAR2007WESCOAR2007
WESCOAR2007
 
whirlpool Annual Report2006
whirlpool Annual Report2006whirlpool Annual Report2006
whirlpool Annual Report2006
 
whirlpool Financial Highlights / Chairman's Letter
whirlpool Financial Highlights / Chairman's Letterwhirlpool Financial Highlights / Chairman's Letter
whirlpool Financial Highlights / Chairman's Letter
 
Joe Harlan Presentation
Joe Harlan PresentationJoe Harlan Presentation
Joe Harlan Presentation
 
ecolab BusinessFinancial
ecolab  BusinessFinancialecolab  BusinessFinancial
ecolab BusinessFinancial
 
home depot Annual Report 2005
home depot Annual Report 2005home depot Annual Report 2005
home depot Annual Report 2005
 
Arvinmeritor2001 Annual Report
Arvinmeritor2001 Annual ReportArvinmeritor2001 Annual Report
Arvinmeritor2001 Annual Report
 
emerson electricl Proxy Statement for 2009 Annual Shareholders Meeting
emerson electricl Proxy Statement for 2009 Annual Shareholders Meeting  emerson electricl Proxy Statement for 2009 Annual Shareholders Meeting
emerson electricl Proxy Statement for 2009 Annual Shareholders Meeting
 
WESCO2006AR
WESCO2006ARWESCO2006AR
WESCO2006AR
 

Mais de finance41

pepco POMSlides
pepco POMSlidespepco POMSlides
pepco POMSlidesfinance41
 
pepco Berenson0306
pepco Berenson0306pepco Berenson0306
pepco Berenson0306finance41
 
pepco EdwardJones0306
pepco EdwardJones0306pepco EdwardJones0306
pepco EdwardJones0306finance41
 
pepco 2006JulyInvestorMeetings
pepco 2006JulyInvestorMeetingspepco 2006JulyInvestorMeetings
pepco 2006JulyInvestorMeetingsfinance41
 
pepco Presentation081706
pepco Presentation081706pepco Presentation081706
pepco Presentation081706finance41
 
pepco FallEEIl
pepco FallEEIlpepco FallEEIl
pepco FallEEIlfinance41
 
pepco WSUG107
pepco WSUG107pepco WSUG107
pepco WSUG107finance41
 
pepco AugustInvestorMeetings2007Final
pepco AugustInvestorMeetings2007Finalpepco AugustInvestorMeetings2007Final
pepco AugustInvestorMeetings2007Finalfinance41
 
pepco MerillLynchPower&GasConferenceSept2007(final)
pepco MerillLynchPower&GasConferenceSept2007(final)pepco MerillLynchPower&GasConferenceSept2007(final)
pepco MerillLynchPower&GasConferenceSept2007(final)finance41
 
pepco POMFallEEI2007
pepco POMFallEEI2007pepco POMFallEEI2007
pepco POMFallEEI2007finance41
 
pepco WallStBerensonFINAL
pepco WallStBerensonFINALpepco WallStBerensonFINAL
pepco WallStBerensonFINALfinance41
 
pepco POMAGAPresentation(final)
pepco POMAGAPresentation(final)pepco POMAGAPresentation(final)
pepco POMAGAPresentation(final)finance41
 
PHI_ProxyAnnual_Report2002
PHI_ProxyAnnual_Report2002PHI_ProxyAnnual_Report2002
PHI_ProxyAnnual_Report2002finance41
 
PHI_ProxyAnnual_Report2002
PHI_ProxyAnnual_Report2002PHI_ProxyAnnual_Report2002
PHI_ProxyAnnual_Report2002finance41
 
PHI_ProxyAnnual_Report2004
PHI_ProxyAnnual_Report2004PHI_ProxyAnnual_Report2004
PHI_ProxyAnnual_Report2004finance41
 
PHI_ProxyAnnual_Report2003
PHI_ProxyAnnual_Report2003PHI_ProxyAnnual_Report2003
PHI_ProxyAnnual_Report2003finance41
 
PHI_ProxyAnnual_Report2003
PHI_ProxyAnnual_Report2003PHI_ProxyAnnual_Report2003
PHI_ProxyAnnual_Report2003finance41
 
PHI_ProxyAnnual_Report2004
PHI_ProxyAnnual_Report2004PHI_ProxyAnnual_Report2004
PHI_ProxyAnnual_Report2004finance41
 
phi proxystatement2005report
phi proxystatement2005reportphi proxystatement2005report
phi proxystatement2005reportfinance41
 

Mais de finance41 (20)

pepco POMSlides
pepco POMSlidespepco POMSlides
pepco POMSlides
 
pepco Berenson0306
pepco Berenson0306pepco Berenson0306
pepco Berenson0306
 
pepco EdwardJones0306
pepco EdwardJones0306pepco EdwardJones0306
pepco EdwardJones0306
 
pepco 2006JulyInvestorMeetings
pepco 2006JulyInvestorMeetingspepco 2006JulyInvestorMeetings
pepco 2006JulyInvestorMeetings
 
pepco Presentation081706
pepco Presentation081706pepco Presentation081706
pepco Presentation081706
 
pepco FallEEIl
pepco FallEEIlpepco FallEEIl
pepco FallEEIl
 
pepco WSUG107
pepco WSUG107pepco WSUG107
pepco WSUG107
 
pepco AugustInvestorMeetings2007Final
pepco AugustInvestorMeetings2007Finalpepco AugustInvestorMeetings2007Final
pepco AugustInvestorMeetings2007Final
 
pepco MerillLynchPower&GasConferenceSept2007(final)
pepco MerillLynchPower&GasConferenceSept2007(final)pepco MerillLynchPower&GasConferenceSept2007(final)
pepco MerillLynchPower&GasConferenceSept2007(final)
 
pepco POMFallEEI2007
pepco POMFallEEI2007pepco POMFallEEI2007
pepco POMFallEEI2007
 
pepco WallStBerensonFINAL
pepco WallStBerensonFINALpepco WallStBerensonFINAL
pepco WallStBerensonFINAL
 
pepco POM2
pepco POM2pepco POM2
pepco POM2
 
pepco POMAGAPresentation(final)
pepco POMAGAPresentation(final)pepco POMAGAPresentation(final)
pepco POMAGAPresentation(final)
 
PHI_ProxyAnnual_Report2002
PHI_ProxyAnnual_Report2002PHI_ProxyAnnual_Report2002
PHI_ProxyAnnual_Report2002
 
PHI_ProxyAnnual_Report2002
PHI_ProxyAnnual_Report2002PHI_ProxyAnnual_Report2002
PHI_ProxyAnnual_Report2002
 
PHI_ProxyAnnual_Report2004
PHI_ProxyAnnual_Report2004PHI_ProxyAnnual_Report2004
PHI_ProxyAnnual_Report2004
 
PHI_ProxyAnnual_Report2003
PHI_ProxyAnnual_Report2003PHI_ProxyAnnual_Report2003
PHI_ProxyAnnual_Report2003
 
PHI_ProxyAnnual_Report2003
PHI_ProxyAnnual_Report2003PHI_ProxyAnnual_Report2003
PHI_ProxyAnnual_Report2003
 
PHI_ProxyAnnual_Report2004
PHI_ProxyAnnual_Report2004PHI_ProxyAnnual_Report2004
PHI_ProxyAnnual_Report2004
 
phi proxystatement2005report
phi proxystatement2005reportphi proxystatement2005report
phi proxystatement2005report
 

Último

《加拿大本地办假证-寻找办理Dalhousie毕业证和达尔豪斯大学毕业证书的中介代理》
《加拿大本地办假证-寻找办理Dalhousie毕业证和达尔豪斯大学毕业证书的中介代理》《加拿大本地办假证-寻找办理Dalhousie毕业证和达尔豪斯大学毕业证书的中介代理》
《加拿大本地办假证-寻找办理Dalhousie毕业证和达尔豪斯大学毕业证书的中介代理》rnrncn29
 
Vp Girls near me Delhi Call Now or WhatsApp
Vp Girls near me Delhi Call Now or WhatsAppVp Girls near me Delhi Call Now or WhatsApp
Vp Girls near me Delhi Call Now or WhatsAppmiss dipika
 
How Automation is Driving Efficiency Through the Last Mile of Reporting
How Automation is Driving Efficiency Through the Last Mile of ReportingHow Automation is Driving Efficiency Through the Last Mile of Reporting
How Automation is Driving Efficiency Through the Last Mile of ReportingAggregage
 
NO1 WorldWide Love marriage specialist baba ji Amil Baba Kala ilam powerful v...
NO1 WorldWide Love marriage specialist baba ji Amil Baba Kala ilam powerful v...NO1 WorldWide Love marriage specialist baba ji Amil Baba Kala ilam powerful v...
NO1 WorldWide Love marriage specialist baba ji Amil Baba Kala ilam powerful v...Amil baba
 
NO1 WorldWide online istikhara for love marriage vashikaran specialist love p...
NO1 WorldWide online istikhara for love marriage vashikaran specialist love p...NO1 WorldWide online istikhara for love marriage vashikaran specialist love p...
NO1 WorldWide online istikhara for love marriage vashikaran specialist love p...Amil Baba Dawood bangali
 
fca-bsps-decision-letter-redacted (1).pdf
fca-bsps-decision-letter-redacted (1).pdffca-bsps-decision-letter-redacted (1).pdf
fca-bsps-decision-letter-redacted (1).pdfHenry Tapper
 
government_intervention_in_business_ownership[1].pdf
government_intervention_in_business_ownership[1].pdfgovernment_intervention_in_business_ownership[1].pdf
government_intervention_in_business_ownership[1].pdfshaunmashale756
 
Call Girls Near Golden Tulip Essential Hotel, New Delhi 9873777170
Call Girls Near Golden Tulip Essential Hotel, New Delhi 9873777170Call Girls Near Golden Tulip Essential Hotel, New Delhi 9873777170
Call Girls Near Golden Tulip Essential Hotel, New Delhi 9873777170Sonam Pathan
 
PMFBY , Pradhan Mantri Fasal bima yojna
PMFBY , Pradhan Mantri  Fasal bima yojnaPMFBY , Pradhan Mantri  Fasal bima yojna
PMFBY , Pradhan Mantri Fasal bima yojnaDharmendra Kumar
 
Authentic No 1 Amil Baba In Pakistan Authentic No 1 Amil Baba In Karachi No 1...
Authentic No 1 Amil Baba In Pakistan Authentic No 1 Amil Baba In Karachi No 1...Authentic No 1 Amil Baba In Pakistan Authentic No 1 Amil Baba In Karachi No 1...
Authentic No 1 Amil Baba In Pakistan Authentic No 1 Amil Baba In Karachi No 1...First NO1 World Amil baba in Faisalabad
 
Call Girls In Yusuf Sarai Women Seeking Men 9654467111
Call Girls In Yusuf Sarai Women Seeking Men 9654467111Call Girls In Yusuf Sarai Women Seeking Men 9654467111
Call Girls In Yusuf Sarai Women Seeking Men 9654467111Sapana Sha
 
Monthly Market Risk Update: April 2024 [SlideShare]
Monthly Market Risk Update: April 2024 [SlideShare]Monthly Market Risk Update: April 2024 [SlideShare]
Monthly Market Risk Update: April 2024 [SlideShare]Commonwealth
 
(中央兰开夏大学毕业证学位证成绩单-案例)
(中央兰开夏大学毕业证学位证成绩单-案例)(中央兰开夏大学毕业证学位证成绩单-案例)
(中央兰开夏大学毕业证学位证成绩单-案例)twfkn8xj
 
原版1:1复刻温哥华岛大学毕业证Vancouver毕业证留信学历认证
原版1:1复刻温哥华岛大学毕业证Vancouver毕业证留信学历认证原版1:1复刻温哥华岛大学毕业证Vancouver毕业证留信学历认证
原版1:1复刻温哥华岛大学毕业证Vancouver毕业证留信学历认证rjrjkk
 
Ch 4 investment Intermediate financial Accounting
Ch 4 investment Intermediate financial AccountingCh 4 investment Intermediate financial Accounting
Ch 4 investment Intermediate financial AccountingAbdi118682
 
(办理学位证)加拿大萨省大学毕业证成绩单原版一比一
(办理学位证)加拿大萨省大学毕业证成绩单原版一比一(办理学位证)加拿大萨省大学毕业证成绩单原版一比一
(办理学位证)加拿大萨省大学毕业证成绩单原版一比一S SDS
 
Bladex 1Q24 Earning Results Presentation
Bladex 1Q24 Earning Results PresentationBladex 1Q24 Earning Results Presentation
Bladex 1Q24 Earning Results PresentationBladex
 
The Triple Threat | Article on Global Resession | Harsh Kumar
The Triple Threat | Article on Global Resession | Harsh KumarThe Triple Threat | Article on Global Resession | Harsh Kumar
The Triple Threat | Article on Global Resession | Harsh KumarHarsh Kumar
 
Economics, Commerce and Trade Management: An International Journal (ECTIJ)
Economics, Commerce and Trade Management: An International Journal (ECTIJ)Economics, Commerce and Trade Management: An International Journal (ECTIJ)
Economics, Commerce and Trade Management: An International Journal (ECTIJ)ECTIJ
 

Último (20)

《加拿大本地办假证-寻找办理Dalhousie毕业证和达尔豪斯大学毕业证书的中介代理》
《加拿大本地办假证-寻找办理Dalhousie毕业证和达尔豪斯大学毕业证书的中介代理》《加拿大本地办假证-寻找办理Dalhousie毕业证和达尔豪斯大学毕业证书的中介代理》
《加拿大本地办假证-寻找办理Dalhousie毕业证和达尔豪斯大学毕业证书的中介代理》
 
Vp Girls near me Delhi Call Now or WhatsApp
Vp Girls near me Delhi Call Now or WhatsAppVp Girls near me Delhi Call Now or WhatsApp
Vp Girls near me Delhi Call Now or WhatsApp
 
How Automation is Driving Efficiency Through the Last Mile of Reporting
How Automation is Driving Efficiency Through the Last Mile of ReportingHow Automation is Driving Efficiency Through the Last Mile of Reporting
How Automation is Driving Efficiency Through the Last Mile of Reporting
 
NO1 WorldWide Love marriage specialist baba ji Amil Baba Kala ilam powerful v...
NO1 WorldWide Love marriage specialist baba ji Amil Baba Kala ilam powerful v...NO1 WorldWide Love marriage specialist baba ji Amil Baba Kala ilam powerful v...
NO1 WorldWide Love marriage specialist baba ji Amil Baba Kala ilam powerful v...
 
NO1 WorldWide online istikhara for love marriage vashikaran specialist love p...
NO1 WorldWide online istikhara for love marriage vashikaran specialist love p...NO1 WorldWide online istikhara for love marriage vashikaran specialist love p...
NO1 WorldWide online istikhara for love marriage vashikaran specialist love p...
 
fca-bsps-decision-letter-redacted (1).pdf
fca-bsps-decision-letter-redacted (1).pdffca-bsps-decision-letter-redacted (1).pdf
fca-bsps-decision-letter-redacted (1).pdf
 
government_intervention_in_business_ownership[1].pdf
government_intervention_in_business_ownership[1].pdfgovernment_intervention_in_business_ownership[1].pdf
government_intervention_in_business_ownership[1].pdf
 
Call Girls Near Golden Tulip Essential Hotel, New Delhi 9873777170
Call Girls Near Golden Tulip Essential Hotel, New Delhi 9873777170Call Girls Near Golden Tulip Essential Hotel, New Delhi 9873777170
Call Girls Near Golden Tulip Essential Hotel, New Delhi 9873777170
 
PMFBY , Pradhan Mantri Fasal bima yojna
PMFBY , Pradhan Mantri  Fasal bima yojnaPMFBY , Pradhan Mantri  Fasal bima yojna
PMFBY , Pradhan Mantri Fasal bima yojna
 
Authentic No 1 Amil Baba In Pakistan Authentic No 1 Amil Baba In Karachi No 1...
Authentic No 1 Amil Baba In Pakistan Authentic No 1 Amil Baba In Karachi No 1...Authentic No 1 Amil Baba In Pakistan Authentic No 1 Amil Baba In Karachi No 1...
Authentic No 1 Amil Baba In Pakistan Authentic No 1 Amil Baba In Karachi No 1...
 
Call Girls In Yusuf Sarai Women Seeking Men 9654467111
Call Girls In Yusuf Sarai Women Seeking Men 9654467111Call Girls In Yusuf Sarai Women Seeking Men 9654467111
Call Girls In Yusuf Sarai Women Seeking Men 9654467111
 
Monthly Market Risk Update: April 2024 [SlideShare]
Monthly Market Risk Update: April 2024 [SlideShare]Monthly Market Risk Update: April 2024 [SlideShare]
Monthly Market Risk Update: April 2024 [SlideShare]
 
(中央兰开夏大学毕业证学位证成绩单-案例)
(中央兰开夏大学毕业证学位证成绩单-案例)(中央兰开夏大学毕业证学位证成绩单-案例)
(中央兰开夏大学毕业证学位证成绩单-案例)
 
原版1:1复刻温哥华岛大学毕业证Vancouver毕业证留信学历认证
原版1:1复刻温哥华岛大学毕业证Vancouver毕业证留信学历认证原版1:1复刻温哥华岛大学毕业证Vancouver毕业证留信学历认证
原版1:1复刻温哥华岛大学毕业证Vancouver毕业证留信学历认证
 
Monthly Economic Monitoring of Ukraine No 231, April 2024
Monthly Economic Monitoring of Ukraine No 231, April 2024Monthly Economic Monitoring of Ukraine No 231, April 2024
Monthly Economic Monitoring of Ukraine No 231, April 2024
 
Ch 4 investment Intermediate financial Accounting
Ch 4 investment Intermediate financial AccountingCh 4 investment Intermediate financial Accounting
Ch 4 investment Intermediate financial Accounting
 
(办理学位证)加拿大萨省大学毕业证成绩单原版一比一
(办理学位证)加拿大萨省大学毕业证成绩单原版一比一(办理学位证)加拿大萨省大学毕业证成绩单原版一比一
(办理学位证)加拿大萨省大学毕业证成绩单原版一比一
 
Bladex 1Q24 Earning Results Presentation
Bladex 1Q24 Earning Results PresentationBladex 1Q24 Earning Results Presentation
Bladex 1Q24 Earning Results Presentation
 
The Triple Threat | Article on Global Resession | Harsh Kumar
The Triple Threat | Article on Global Resession | Harsh KumarThe Triple Threat | Article on Global Resession | Harsh Kumar
The Triple Threat | Article on Global Resession | Harsh Kumar
 
Economics, Commerce and Trade Management: An International Journal (ECTIJ)
Economics, Commerce and Trade Management: An International Journal (ECTIJ)Economics, Commerce and Trade Management: An International Journal (ECTIJ)
Economics, Commerce and Trade Management: An International Journal (ECTIJ)
 

starbucks Annual_Report_2004_part2

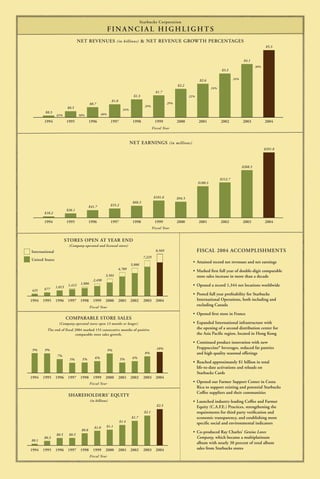
  • 1. Starbucks Corporation FINANCIAL HIGHLIGHTS NET REVENUES (in billions) & NET REVENUE GROWTH PERCENTAGES $5.3 $4.1 30% $3.3 24% $2.6 $2.2 24% $1.7 $1.3 22% $1.0 29% $0.7 29% $0.5 34% $0.3 40% 63% 50% 1994 1995 1996 1997 1998 1999 2000 2001 2002 2003 2004 Fiscal Year NET EARNINGS (in millions) $391.8 $268.3 $212.7 $180.3 $101.6 $94.5 $68.3 $55.2 $41.7 $26.1 $10.2 1994 1995 1996 1997 1998 1999 2000 2001 2002 2003 2004 Fiscal Year STORES OPEN AT YEAR END (Company-operated and licensed stores) FISCAL 2004 ACCOMPLISHMENTS 8,569 International 7,225 United States • Attained record net revenues and net earnings 5,886 4,709 • Marked first full year of double-digit comparable 3,501 store sales increase in more than a decade 2,498 1,886 • Opened a record 1,344 net locations worldwide 1,412 1,015 677 425 • Posted full year profitability for Starbucks International Operations, both including and 2003 2004 1994 1995 1996 1997 1998 1999 2000 2001 2002 excluding Canada Fiscal Year • Opened first store in France COMPARABLE STORE SALES • Expanded International infrastructure with (Company-operated stores open 13 months or longer) the opening of a second distribution center for The end of fiscal 2004 marked 153 consecutive months of positive the Asia Pacific region, located in Hong Kong comparable store sales growth. • Continued product innovation with new Frappuccino® beverages, reduced fat pastries 10% 9% 9% 9% and high-quality seasonal offerings 8% 7% 6% 6% 5% 5% 5% • Reached approximately $1 billion in total life-to-date activations and reloads on Starbucks Cards 2003 2004 1994 1995 1996 1997 1998 1999 2000 2001 2002 • Opened our Farmer Support Center in Costa Fiscal Year Rica to support existing and potential Starbucks Coffee suppliers and their communities SHAREHOLDERS’ EQUITY (in billions) • Launched industry-leading Coffee and Farmer $2.5 Equity (C.A.F.E.) Practices, strengthening the requirements for third party verification and $2.1 economic transparency, and establishing more $1.7 $1.4 specific social and environmental indicators $1.1 $1.0 $0.8 • Co-produced Ray Charles’ Genius Loves $0.5 $0.5 Company, which became a multiplatinum $0.3 $0.1 album with nearly 30 percent of total album sales from Starbucks stores 2003 2004 1994 1995 1996 1997 1998 1999 2000 2001 2002 Fiscal Year
  • 2. CAUTIONARY STATEMENT PURSUANT TO THE and equipment, a selection of premium teas and a line of PRIVATE SECURITIES LITIGATION REFORM ACT compact discs, primarily through Company-operated retail OF 1995 stores. Starbucks also sells coffee and tea products through other channels, and through certain of its equity investees Certain statements herein, including anticipated store openings, Starbucks produces and sells bottled Frappuccino® and Starbucks trends in or expectations regarding Starbucks Corporation’s revenue DoubleShot® coffee drinks and a line of superpremium ice and net earnings growth, comparable store sales growth, cash flow creams. These nonretail channels are collectively known as requirements and capital expenditures, all constitute “ forward- “Specialty Operations.” The Company’s objective is to establish looking statements” within the meaning of the Private Securities Starbucks as the most recognized and respected brand in the Litigation Reform Act of 1995. Such statements are based on world. To achieve this goal, the Company plans to continue rapid currently available operating, financial and competitive information expansion of its retail operations, to grow its Specialty Operations and are subject to various risks and uncertainties. Actual future results and to selectively pursue other opportunities to leverage the and trends may differ materially depending on a variety of factors, Starbucks brand through the introduction of new products and including, but not limited to, coffee, dairy and other raw materials the development of new channels of distribution. prices and availability; successful execution of internal performance and expansion plans; fluctuations in United States and international The Company has two operating segments, United States and economies and currencies; ramifications from the war on terrorism, or International, each of which includes Company-operated retail other international events or developments; the impact of competitors’ stores and Specialty Operations. initiatives; the effect of legal proceedings; and other risks detailed herein and in Starbucks Corporation’s other filings with the Securities Company-operated Retail Stores and Exchange Commission. Please also see “Certain Additional Risks The Company’s retail goal is to become the leading retailer and Uncertainties” in the Starbucks Annual report on Form 10-K for and brand of coffee in each of its target markets by selling the the fiscal year ended October 3, 2004. finest quality coffee and related products and by providing each customer a unique Starbucks Experience. This third place A forward-looking statement is neither a prediction nor a guarantee experience, after home and work, is built upon superior customer of future events or circumstances, and those future events or service as well as clean and well-maintained Company-operated circumstances may not occur. Users should not place undue reliance retail stores that reflect the personalities of the communities in on the forward-looking statements, which speak only as of the date which they operate, thereby building a high degree of customer of this report. Starbucks Corporation is under no obligation to loyalty. Starbucks strategy for expanding its retail business is update or alter any forward-looking statements, whether as a result to increase its market share in existing markets primarily by of new information, future events or otherwise. opening additional stores and to open stores in new markets where the opportunity exists to become the leading specialty BUSINESS coffee retailer. In support of this strategy, Starbucks opened Starbucks Corporation (together with its subsidiaries, “Starbucks” 634 new Company-operated stores during the fiscal year ended or the “Company”), purchases and roasts high-quality whole October 3, 2004 (“fiscal 2004”). Company-operated retail stores bean coffees and sells them, along with fresh, rich-brewed accounted for 84% of total net revenues during fiscal 2004. coffees, Italian-style espresso beverages, cold blended beverages, a variety of complementary food items, coffee-related accessories The following table summarizes total Company-operated retail store data for the periods indicated: Net stores opened during the fiscal year ended Stores open as of Oct 3, 2004 Sept 28, 2003 (53 Wks) (52 Wks) Oct 3, 2004 Sept 28, 2003 United States 514 506 4,293 3,779 International: United Kingdom 49 51 422 373 Canada 56 29 372 316 Thailand 11 9 49 38 Australia 4 7 44 40 Singapore – 3 35 35 Total International 120 99 922 802 Total Company-operated 634 605 5,215 4,581 Starbucks retail stores are typically located in high-traffic, All Starbucks stores offer a choice of regular and decaffeinated high-visibility locations. Because the Company can vary the coffee beverages, a broad selection of Italian-style espresso size and format, its stores are located in or near a variety of beverages, cold blended beverages, iced shaken refreshment settings, including downtown and suburban retail centers, beverages and a selection of teas and distinctively packaged office buildings and university campuses. While the Company roasted whole bean coffees. Starbucks stores also offer a selectively locates stores in shopping malls, it focuses on locations selection of fresh pastries and other food items, sodas, juices, that provide convenient access for pedestrians and drivers. With coffee-making equipment and accessories, a selection of the flexibility in store size and format, the Company also locates compact discs, games and seasonal novelty items. Each retail stores in select rural and off-highway locations to serve a Starbucks store varies its product mix depending upon the size broader array of customers outside major metropolitan markets of the store and its location. Larger stores carry a broad and further expand brand awareness. To provide a greater selection of the Company’s whole bean coffees in various sizes degree of access and convenience for nonpedestrian customers, and types of packaging, as well as an assortment of coffee and the Company has increased focus on drive-thru retail stores. At espresso-making equipment and accessories such as coffee the end of fiscal 2004, the Company had approximately 700 grinders, coffee filters, storage containers, travel tumblers and Company-operated drive-thru locations. mugs. Smaller Starbucks stores and kiosks typically sell a full 13 Fiscal 2004 Annual Report
  • 3. line of coffee beverages, a limited selection of whole bean Starbucks has an equity ownership interest in licensee operations. coffees and a few accessories such as travel tumblers and logo During fiscal 2004, specialty revenues (which include royalties mugs. In the United States and in International markets, and fees from licensees, as well as product sales derived from approximately 2,100 stores and 500 stores, respectively, carry a Specialty Operations) accounted for 16% of total net revenues. selection of grab-and-go sandwiches and salads. During fiscal Licensing 2004, the Company’s retail sales mix by product type was Although the Company does not generally relinquish operational 77% beverages, 14% food items, 5% whole bean coffees and control of its retail stores in the United States, in situations in 4% coffee-making equipment and other merchandise. which a master concessionaire or another company controls In fiscal 2004, the Company introduced the Starbucks Hear or can provide improved access to desirable retail space, the Music™ Coffeehouse, a first-of-its-kind music store in Santa Company licenses its operations. As part of these arrangements, Monica, California. This Company-operated retail location Starbucks receives license fees and royalties and sells coffee and combines the Starbucks coffeehouse experience with an related products for resale in licensed locations. Employees innovative new retail environment for customers to discover, working in licensed retail locations must follow Starbucks acquire and enjoy music. The Hear Music Coffeehouse gives detailed store operating procedures and attend training classes customers a hands-on guide to music discovery with its similar to those given to Company-operated store managers interactive listening bar, and allows customers access to CD and employees. burning technology to create personalized CDs from a digital During fiscal 2004, Starbucks opened 417 licensed retail stores library of music. Currently, Starbucks is testing the CD burning in the United States. As of October 3, 2004, the Company had technology through its Hear Music™ media bars in select 1,839 licensed stores in the United States. Product sales to and Starbucks Company-operated retail stores. royalty and license fees from these stores accounted for 24% of specialty revenues in fiscal 2004. Specialty Operations The Company’s Specialty Operations strive to develop the The Company’s International licensed retail stores are operated Starbucks brand outside the Company-operated retail store through a number of licensing arrangements, primarily with environment through a number of channels. Starbucks strategy prominent retailers. During fiscal 2004, Starbucks expanded is to reach customers where they work, travel, shop and dine its international presence by opening 293 new International by establishing relationships with prominent third parties licensed stores, including the first stores in France and Cyprus. that share the Company’s values and commitment to quality. At fiscal year end 2004, the Company’s International operating These relationships take various forms, including licensing segment had a total of 1,515 licensed retail stores categorized by arrangements, foodservice accounts and other initiatives related region and located as follows: to the Company’s core businesses. In certain situations, Asia Pacific Europe/Middle East/Africa Americas Japan 534 Germany 35 Canada 66 China 152 Saudi Arabia 32 Hawaii 45 Taiwan 136 United Arab Emirates 31 Mexico 32 South Korea 102 Spain 27 Chile 9 Philippines 70 Kuwait 27 Puerto Rico 6 Malaysia 52 Greece 25 Peru 3 New Zealand 36 Switzerland 18 Indonesia 24 Turkey 15 Lebanon 10 Austria 8 Qatar 6 Bahrain 5 France 4 Oman 3 Cyprus 2 Total 1,106 248 161 14 Fiscal 2004 Annual Report
  • 4. Product sales to and royalty and license fee revenues from institutional foodservice companies that service business, International licensed retail stores accounted for 15% of specialty industry, education and healthcare accounts, office coffee revenues in fiscal 2004. In total, worldwide retail store licensing distributors, hotels, restaurants, airlines and other retailers. accounted for 39% of specialty revenues in fiscal 2004. Beginning in fiscal 2003, the Company transitioned the majority of its U.S. foodservice accounts to SYSCO Corporation’s In fiscal 2004, the Company expanded its licensing national broadline distribution network and aligned foodservice relationship with Kraft Foods, Inc. (“Kraft”) to include sales, customer service and support resources with those of a larger selection of Starbucks® whole bean and ground SYSCO Corporation. This alliance greatly improved customer coffees, as well as Seattle’s Best Coffee® and Torrefazione service levels and is expected to continue to generate new Italia® branded coffees and a selection of premium Tazo® foodservice accounts over the next several years. Starbucks and teas, in grocery and warehouse club stores throughout the Seattle’s Best Coffee are the only superpremium national-brand United States. Kraft manages all distribution, marketing, coffees actively promoted by SYSCO Corporation. advertising and promotion and pays a royalty to Starbucks. By the end of fiscal 2004, the Company’s coffees and teas The Company’s total worldwide foodservice operations had were available in approximately 20,000 grocery and warehouse approximately 13,700 foodservice accounts at fiscal year end club stores: 19,000 in the United States and 1,000 in 2004, and revenues from these accounts comprised 31% of total International markets. Revenues from this category comprised specialty revenues. 27% of specialty revenues in fiscal 2004. Other Initiatives The Company has licensed the rights to produce and distribute The Company maintains a website at Starbucks.com where Starbucks branded products to two partnerships in which the customers may purchase, register or reload Starbucks stored Company holds a 50% equity interest: The North American value cards, as well as apply for the Starbucks Card Duetto™ Coffee Partnership with the Pepsi-Cola Company develops and Visa® (the “Duetto Card”), issued through the Company’s distributes bottled Frappuccino® and Starbucks DoubleShot® agreement with Bank One Corporation and Visa. The Duetto coffee drinks; and the Starbucks Ice Cream Partnership with Card is a first-of-its-kind card, combining the functionality Dreyer’s Grand Ice Cream, Inc., develops and distributes of a credit card with the convenience of a reloadable superpremium ice creams. In fiscal 2004, the Company entered Starbucks Card. Additionally, the website contains information into an agreement with Jim Beam Brands Co., a unit of Fortune about the Company’s coffee products, brewing equipment and Brands, Inc., to develop, manufacture and market a Starbucks- store locations. branded premium coffee liqueur product in the United States. In fiscal 2004, the Company entered into a strategic marketing The Company conducted tests of this product in two U.S. alliance with XM Satellite Radio related to the debut of the markets in the fiscal fourth quarter and expects to introduce 24-hour Starbucks Hear Music™ channel 75. This channel is the product nationally during the fiscal second quarter of available to all XM Satellite Radio subscribers, and Starbucks 2005 in retail locations licensed to sell distilled spirits, such customers will be able to enjoy the same programming when it as restaurants, bars and retail outlets where premium distilled is launched in more than 4,000 Company-operated locations in spirits are sold. The Company will not sell the liqueur product the United States during fiscal 2005. Collectively, the operations in its Company-operated or licensed retail stores. The associated of these other initiatives accounted for 2% of specialty revenues revenues from this category accounted for 1% of specialty in fiscal 2004. revenues in fiscal 2004. Foodservice Accounts The Company sells whole bean and ground coffees, including the Starbucks, Seattle’s Best Coffee and Torrefazione Italia brands, as well as a selection of premium Tazo teas, to 15 Fiscal 2004 Annual Report
  • 5. SELECTED FINANCIAL DATA In thousands, except earnings per share and store operating data The following selected financial data have been derived from the consolidated financial statements of Starbucks Corporation (the “Company”). The data set forth below should be read in conjunction with “Management’s Discussion and Analysis of Financial Condition and Results of Operations,” the section “Certain Additional Risks and Uncertainties” in the Company’s Annual Report on Form 10-K and the Company’s consolidated financial statements and notes thereto. Oct 3, Sept 28, Sept 29, Sept 30, Oct 1, 2004 2003 2002 2001 2000 As of and for the fiscal year ended (1) (53 Wks) (52 Wks) (52 Wks) (52 Wks) (52 Wks) RESULTS OF OPERATIONS DATA Net revenues: Company-operated retail $ 4,457,378 $ 3,449,624 $ 2,792,904 $ 2,229,594 $ 1,823,607 Specialty: Licensing 565,798 409,551 311,932 240,665 189,411 Foodservice and other 271,071 216,347 184,072 178,721 164,596 Total specialty 836,869 625,898 496,004 419,386 354,007 Total net revenues 5,294,247 4,075,522 3,288,908 2,648,980 2,177,614 Operating income 610,117 424,713 316,338 280,219 212,190 Internet-related investment losses (2) – – – 2,940 58,792 Gain on sale of investment (3) – – 13,361 – – Net earnings $ 391,775 $ 268,346 $ 212,686 $ 180,335 $ 94,502 Net earnings per common share – diluted (4) $ 0.95 $ 0.67 $ 0.54 $ 0.46 $ 0.24 Cash dividends per share – – – – – BALANCE SHEET DATA Working capital $ 585,505 $ 315,326 $ 310,048 $ 148,661 $ 146,568 Total assets 3,318,957 2,729,746 2,214,392 1,783,470 1,435,026 Long-term debt (including current portion) 4,353 5,076 5,786 6,483 7,168 Shareholders’ equity $ 2,486,755 $ 2,082,427 $ 1,723,189 $ 1,374,865 $ 1,148,212 STORE OPERATING DATA Percentage change in comparable store sales (5) United States 11% 9% 7% 5% 9% International 6% 7% 1% 3% 12% Consolidated 10% 8% 6% 5% 9% Stores opened during the year: (6) (7) United States Company-operated stores 514 506 503 498 388 Licensed stores 417 315 264 268 342 International Company-operated stores 120 99 113 151 103 Licensed stores 293 281 297 291 170 Total 1,344 1,201 1,177 1,208 1,003 Stores open at year-end: (7) United States(8) Company-operated stores 4,293 3,779 3,209 2,706 2,208 Licensed stores 1,839 1,422 1,033 769 501 International Company-operated stores 922 802 703 590 439 Licensed stores 1,515 1,222 941 644 353 Total 8,569 7,225 5,886 4,709 3,501 (1) The Company’s fiscal year ends on the Sunday closest to September 30. (2) During fiscal 2001 and 2000, the Company recognized losses of $2.9 million and $58.8 million, respectively, for impairments of Internet-related investments determined to be other than temporary. (3) On October 10, 2001, the Company sold 30,000 of its shares of Starbucks Coffee Japan, Ltd. at approximately $495 per share, net of related costs, which resulted in a gain of $13.4 million. (4) Earnings per share data for fiscal years presented above have been restated to reflect the two-for-one stock split in fiscal 2001. (5) Includes only Starbucks Company-operated retail stores open 13 months or longer. Comparable store sales percentage for fiscal 2004 excludes the extra sales week. (6) Store openings are reported net of closures. (7) International store information has been adjusted for the 100% acquisition of the Singapore operations by reclassifying historical information from Licensed stores to Company-operated stores. (8) United States stores open at fiscal 2003 year end include 43 Seattle’s Best Coffee (“SBC”) and 21 Torrefazione Italia Company-operated stores and 74 SBC franchised stores. 16 Fiscal 2004 Annual Report
  • 6. MANAGEMENT’S DISCUSSION AND ANALYSIS Since additional retail stores can leverage existing support OF FINANCIAL CONDITION AND RESULTS organizations and facilities, the Company’s infrastructure can OF OPERATIONS be expanded more slowly than the rate of revenue growth and generate margin improvement. In fiscal 2004, operating General income as a percentage of total net revenues increased to 11.5% Starbucks Corporation’s fiscal year ends on the Sunday closest from 10.4% in fiscal 2003, and net earnings increased by to September 30. The fiscal year ended on October 3, 2004, 46.0%, compared to fiscal 2003. These results demonstrated included 53 weeks, with the 53rd week falling in the fiscal the Company’s ability to improve operating margin despite fourth quarter. Fiscal years 2003 and 2002 each had 52 weeks. pressures from rising dairy and green coffee commodity costs Fiscal year 2005 will have 52 weeks. throughout the fiscal year. The Company’s International operations delivered a full year of positive operating results, Management Overview primarily due to leverage gained on most operating expenses During the fiscal year ended October 3, 2004, all areas of distributed over an expanded revenue base. In recent fiscal Starbucks business, from U.S. and international Company- years, the Company made substantial infrastructure investments operated retail operations to the Company’s specialty businesses, in corporate and regional support facilities and personnel, as delivered strong financial performance, and innovation was well as established more efficient distribution networks. Such prevalent throughout the Company’s operations. Starbucks investments were necessary to support the Company’s planned believes the Company’s ability to achieve the balance between international expansion, which is now realizing substantial growing the core business and building the foundation for benefit from this foundation. future growth is the key to increasing shareholder value. Starbucks fiscal 2004 performance provides a strong example of Management believes that comparable store sales growth of the Company’s commitment to achieve this balance. the level acheived during fiscal 2004 is not sustainable over the long term. However, management believes that new store Historically, the primary driver of the Company’s revenue growth development opportunities on a global basis are sufficient for the has been the opening of new retail stores, both Company- Company to maintain a high level of unit growth and that the operated and licensed, in pursuit of the Company’s objective to execution of the current retail operating strategy can continue to establish Starbucks as the most recognized and respected brand increase first year average store sales and comparable store sales. in the world. With a presence today in more than 30 countries, These revenue growth opportunities, coupled with continuous management believes that the Company’s long-term goal of focus on controlling both operating and capital costs, should operating 15,000 Starbucks retail locations throughout the allow Starbucks to continue to modestly improve margins and United States and at least 15,000 stores in International markets achieve annual revenue growth of approximately 20% and is achievable. annual earnings per share growth of 20% –25% for the next three to five years. In addition to opening new retail stores, Starbucks is targeting to increase revenues generated at new and existing Company- Acquisitions operated stores by attracting new customers and increasing In July 2004, Starbucks acquired 100% of its licensed the frequency of visits by current customers. The strategy is operations in Singapore and acquired 49.9% of its licensed to increase first year average store sales and comparable store operations in Malaysia, for a combined total of approximately sales by continuously improving the level of customer service, $12.1 million. Previously, the Company did not have any maintaining a steady stream of product innovation and equity ownership interests in these entities. The results of improving the speed of service through training, technology and operations for Singapore are included in the accompanying process improvement. For U.S. Company-operated stores opened consolidated financial statements from the date of acquisition. in fiscal 2004, first year sales volumes are currently estimated at For its investment in Malaysia, management applied the greater than $800,000 as a result of these efforts. Comparable equity method of accounting from the date of acquisition, store sales for Company-operated markets increased by 10%, since the Company is able to exert significant influence over making fiscal 2004 the 13th consecutive year with comparable the investee’s operating and financial policies. store sales growth of 5% or greater. In July 2003, the Company acquired Seattle Coffee Company In licensed retail operations, Starbucks shares operating and (“SCC”), which includes the Seattle’s Best Coffee® and store development experience to help licensees improve the Torrefazione Italia® brands, from AFC Enterprises, Inc. for profitability of existing stores and build new stores, which $70 million in cash. The results of operations of SCC are generate additional royalty income and product sales. The included in the accompanying consolidated financial statements Company’s strategy is to selectively increase its equity stake as from the date of acquisition. International markets develop. During fiscal 2003, Starbucks increased its equity ownership to The combination of more retail stores, higher revenues from 50% of its International licensed operations in Austria, Shanghai, existing stores, and growth in other business channels in Spain, Switzerland and Taiwan, which enabled the Company both the United States and International operating segments to exert significant influence over their operating and financial resulted in a 29.9% increase in total net revenues for the 53 policies. For these operations, the Company reflected a change in weeks of fiscal 2004, compared to the 52 weeks of fiscal 2003. accounting method during fiscal 2003, from the cost method to Excluding the impact of the extra sales week in fiscal 2004, the equity method, in the consolidated financial statements. total net revenues increased 27.3%. Both of these revenue growth measures were above the Company’s three to five year target of approximately 20%. 17 Fiscal 2004 Annual Report
  • 7. RESULTS OF OPERATIONS – FISCAL 2004 COMPARED TO FISCAL 2003 The following table sets forth the percentage relationship to total net revenues, unless otherwise indicated, of certain items included in the Company’s consolidated statements of earnings: Oct 3, 2004 Sept 28, 2003 Sept 29, 2002 Fiscal year ended (53 Wks) (52 Wks) (52 Wks) STATEMENTS OF EARNINGS DATA Net revenues: Company-operated retail 84.2% 84.6% 84.9% Specialty: Licensing 10.7 10.1 9.5 Foodservice and other 5.1 5.3 5.6 Total specialty 15.8 15.4 15.1 Total net revenues 100.0 100.0 100.0 Cost of sales including occupancy costs 41.5 41.4 41.0 Store operating expenses (1) 40.2 40.0 39.7 Other operating expenses (2) 20.5 22.6 21.4 Depreciation and amortization expenses 5.3 5.8 6.3 General and administrative expenses 5.7 6.0 7.1 Income from equity investees 1.1 0.9 1.0 Operating income 11.5 10.4 9.6 Interest and other income, net 0.3 0.3 0.3 Gain on sale of investment 0.0 0.0 0.4 Earnings before income taxes 11.8 10.7 10.3 Income taxes 4.4 4.1 3.8 Net earnings 7.4% 6.6% 6.5% (1) Shown as a percentage of related Company-operated retail revenues. (2) Shown as a percentage of related total specialty revenues. Consolidated Results of Operations growth in the grocery and warehouse club businesses was a result of expanded agreements with Kraft Foods, Inc., including the Net revenues for the fiscal year ended 2004 increased 29.9% to addition of six new Starbucks coffees along with a selection of $5.3 billion from $4.1 billion for the 52-week period of fiscal Tazo® teas and the acquisition of Seattle Coffee Company in the 2003. Net revenues increased 27.3% when calculated on a fourth quarter of fiscal 2003. comparative 52-week basis for both fiscal 2004 and 2003. During the fiscal year ended 2004, Starbucks derived 84% of Foodservice and other revenues increased 25.3% to $271 total net revenues from its Company-operated retail stores. million for the fiscal year ended 2004, from $216 million for Company-operated retail revenues increased 29.2% to $4.5 the 52-week period of fiscal 2003. The increase was primarily billion for the fiscal year ended 2004, from $3.4 billion for the attributable to the growth in new and existing foodservice 52-week period of fiscal 2003. Company-operated retail revenues accounts, which benefited from the July 2003 acquisition of increased 26.7% when calculated on a comparative 52-week Seattle Coffee Company. basis for both fiscal 2004 and 2003. This increase was primarily due to the opening of 634 new Company-operated retail stores Cost of sales and related occupancy costs increased to 41.5% during the previous 12 months and comparable store sales growth of total net revenues in fiscal 2004, from 41.4% in fiscal 2003. of 10%. The increase in comparable store sales was due to The increase was primarily due to higher dairy and green a 9% increase in the number of customer transactions and a coffee commodity costs, partially offset by leverage gained on 1% increase in the average value per transaction. Comparable occupancy costs, which are primarily fixed expenses. store sales growth percentages were calculated excluding the Store operating expenses as a percentage of Company-operated extra week of fiscal 2004. Management believes increased retail revenues increased to 40.2% in fiscal 2004, from 40.0% customer traffic continues to be driven by new product in fiscal 2003, primarily due to higher marketing expenditures innovation, continued popularity of core products, a high level of for holiday and new product promotions, as well as increased customer satisfaction and improved speed of service through costs to maintain retail stores and equipment due to sustained enhanced technology, training and execution at retail stores. high traffic levels. The Company derived the remaining 16% of total net revenues Other operating expenses (expenses associated with the from its Specialty Operations. Specialty revenues, which include Company’s Specialty Operations) decreased to 20.5% of licensing revenues and foodservice and other revenues, increased specialty revenues in fiscal 2004, compared to 22.6% in fiscal 33.7% to $837 million for the fiscal year ended 2004, from 2003. The decrease was primarily due to leverage gained on $626 million for the 52-week period of fiscal 2003. Excluding payroll-related expenditures distributed over an expanded the impact of the extra sales week in fiscal 2004, total specialty revenue base. revenues increased 31.0% to $820 million. Depreciation and amortization expenses increased to $280 Licensing revenues, which are derived from retail store licensing million in fiscal 2004, from $238 million in fiscal 2003. The arrangements, grocery and warehouse club licensing, and certain increase was primarily due to a net increase of 634 new other branded-product licensed operations, increased 38.2% to Company-operated retail stores during the previous 12 months $566 million for the fiscal year ended 2004, from $410 million and higher depreciation expenses associated with shortened for the 52-week period of fiscal 2003. The increase was due to estimated useful lives of equipment deployed in the Company’s higher product sales and royalty revenues from the addition of foodservice operations. As a percentage of total net revenues, 710 new licensed retail stores during the previous 12 months depreciation and amortization decreased to 5.3% for the 53 and growth in the grocery and warehouse club businesses. The 18 Fiscal 2004 Annual Report
  • 8. weeks ended October 3, 2004, from 5.8% for the corresponding primarily due to volume-driven operating results for The 52-week fiscal 2003 period, primarily due to the leverage of North American Coffee Partnership, which produces bottled fixed depreciation expenses from the extra sales week in 2004. Frappuccino® and Starbucks DoubleShot® coffee drinks, and improved profitability of Starbucks Coffee Japan, Ltd. General and administrative expenses increased to $304 million in (“Starbucks Japan”). The July 2003 increase in the Company’s fiscal 2004, compared to $245 million in fiscal 2003, primarily due ownership interest from 5% to 50% in the Taiwan and Shanghai to higher payroll-related expenditures. As a percentage of total net licensed operations also contributed to the growth. revenues, general and administrative expenses decreased to 5.7% for the 53 weeks ended October 3, 2004, from 6.0% for the Net interest and other income, which primarily consists of 52 weeks ended September 28, 2003. interest income, increased to $14 million in fiscal 2004, from $12 million in fiscal 2003. The growth was a result of interest Operating income increased 43.7% to $610 million in fiscal income earned on higher cash and liquid investment balances 2004, from $425 million in fiscal 2003. The operating margin during fiscal 2004, compared to the prior year. increased to 11.5% of total net revenues in fiscal 2004, compared to 10.4% in fiscal 2003, primarily due to leverage gained Income taxes for the 53 weeks ended October 3, 2004, resulted on most fixed operating costs distributed over an expanded in an effective tax rate of 37.2%, compared to 38.5% in fiscal revenue base, partially offset by higher dairy and green coffee 2003. The lower effective tax rate was primarily due to improved commodity costs. operating results as fewer nondeductible losses were generated from international markets, which are in various phases Income from equity investees was $61 million in fiscal 2004, of development. compared to $38 million in fiscal 2003. The increase was Operating Segments Segment information is prepared on the same basis that the Company’s management reviews financial information for operational decision-making purposes. The following tables summarize the Company’s results of operations by segment for fiscal 2004 and 2003 (in thousands): % of % of % of United States International Unallocated Total Net 53 weeks ended October 3, 2004 United States Revenue International Revenue Corporate Revenue Consolidated Net revenues: Company-operated retail $ 3,800,367 84.6% $ 657,011 81.8% $ – –% $ 4,457,378 Specialty: Licensing 436,981 9.7 128,817 16.0 – – 565,798 Foodservice and other 253,502 5.7 17,569 2.2 – – 271,071 Total specialty 690,483 15.4 146,386 18.2 – – 836,869 Total net revenues 4,490,850 100.0 803,397 100.0 – – 5,294,247 Cost of sales and related occupancy costs 1,789,502 39.8 409,152 50.9 – – 2,198,654 40.7 (1) 37.0 (1) Store operating expenses 1,546,871 243,297 – – 1,790,168 21.0 (2) 18.3 (2) Other operating expenses 144,853 26,795 – – 171,648 Depreciation and amortization expenses 201,703 4.5 45,783 5.7 32,538 0.6 280,024 General and administrative expenses 80,221 1.8 48,206 6.0 175,866 3.3 304,293 Income from equity investees 37,453 0.8 23,204 2.9 – – 60,657 Operating income/(loss) $ 765,153 17.0% $ 53,368 6.6% $ (208,404) (3.9)% $ 610,117 % of % of % of United States International Unallocated Total Net 52 weeks ended September 28, 2003 United States Revenue International Revenue Corporate Revenue Consolidated Net revenues: Company-operated retail $ 2,965,618 85.4% $ 484,006 80.3% $ – –% $ 3,449,624 Specialty: Licensing 301,175 8.7 108,376 18.0 – – 409,551 Foodservice and other 205,659 5.9 10,688 1.7 – – 216,347 Total specialty 506,834 14.6 119,064 19.7 – – 625,898 Total net revenues 3,472,452 100.0 603,070 100.0 – – 4,075,522 Cost of sales and related occupancy costs 1,363,267 39.3 322,661 53.5 – – 1,685,928 40.4 (1) 37.3 (1) Store operating expenses 1,199,020 180,554 – – 1,379,574 23.7 (2) 18.0 (2) Other operating expenses 119,960 21,386 – – 141,346 Depreciation and amortization expenses 167,138 4.8 38,563 6.4 32,106 0.8 237,807 General and administrative expenses 45,007 1.3 44,352 7.4 155,191 3.8 244,550 Income from equity investees 28,484 0.8 9,912 1.6 – – 38,396 Operating income/(loss) $ 606,544 17.5% $ 5,466 0.9% $ (187,297) (4.6)% $ 424,713 (1) Shown as a percentage of related Company-operated retail revenues. (2) Shown as a percentage of related total specialty revenues. 19 Fiscal 2004 Annual Report
  • 9. United States countries. International operations are in various early stages of The Company’s United States operations (“United States”) development and have country-specific regulatory requirements represent 85% of Company-operated retail revenues, 83% of that necessitate a more extensive support organization, relative to total specialty revenues and 85% of total net revenues. United the current levels of revenue and operating income, than in the States operations sell coffee and other beverages, whole bean United States. coffees, complementary food, coffee brewing equipment and International total net revenues increased $200 million, or merchandise primarily through Company-operated retail stores. 33.2%, to $803 million for the fiscal year ended 2004, compared Specialty Operations within the United States include licensed to $603 million for the 52-week period of fiscal 2003. Excluding retail stores and other licensing operations, foodservice accounts the impact of the extra sales week in fiscal 2004, International and other initiatives related to the Company’s core businesses. total net revenues increased 30.6%. International Company- United States total net revenues increased by $1.0 billion, or operated retail revenues increased $173 million, or 35.7%, to 29.3%, to $4.5 billion for the fiscal year ended 2004, compared $657 million for the fiscal year ended 2004, compared to $484 to $3.5 billion for the 52-week period of fiscal 2003. Excluding million for the 52-week period of fiscal 2003. The increase was the impact of the extra sales week in fiscal 2004, United States primarily due to the opening of 120 new Company-operated total net revenues increased 26.8% to $4.4 billion. United States retail stores during the previous 12 months, the weakening Company-operated retail revenues increased by $835 million, or of the U.S. dollar against both the British pound sterling and 28.1%, to $3.8 billion for the fiscal year ended 2004, compared Canadian dollar, and comparable store sales growth of 6%. The to $3.0 billion for the 52-week period of fiscal 2003, primarily increase in comparable store sales resulted from a 5% increase in due to the opening of 514 new Company-operated retail stores the number of customer transactions and a 1% increase in the during the previous 12 months and comparable store sales average value per transaction. Excluding the impact of the extra growth of 11%. The increase in comparable store sales was due sales week in fiscal 2004, International Company-operated to a 10% increase in the number of customer transactions and a retail revenues increased 33.0% to $644 million. 1% increase in the average value per transaction. Management Total International specialty revenues increased $27 million, or believes increased customer traffic continues to be driven by 22.9%, to $146 million for the fiscal year ended 2004, compared new product innovation, continued popularity of core products, to $119 million for the 52-week period of fiscal 2003. Excluding a high level of customer satisfaction and improved speed of the impact of the extra sales week in fiscal 2004, International service through enhanced technology, training and execution specialty revenues increased 20.6% to $144 million. The increase at retail stores. Excluding the impact of the extra sales week in was primarily due to higher product sales and royalty revenues fiscal 2004, United States Company-operated retail revenues from opening 293 new licensed retail stores during the previous increased 25.7% to $3.7 billion. 12 months, partially offset by proportionate eliminations of Total United States specialty revenues increased $184 million, sales to equity investees in which the Company increased its or 36.2%, to $690 million for the fiscal year ended 2004, ownership interest in late fiscal 2003. compared to $507 million in the 52-week period of fiscal International operating income increased to $53 million for the 2003. Excluding the impact of the extra sales week in fiscal fiscal year ended 2004, compared to $5 million in the 52-week 2004, United States specialty revenues increased 33.4% to period of fiscal 2003. Operating margin increased to 6.6% of $676 million. United States licensing revenues increased related revenues from 0.9% in the 52-week period of fiscal 2003, $136 million, or 45.1%, to $437 million, compared to $301 primarily due to leverage gained on most fixed costs distributed million for the 52-week period of fiscal 2003. The increase over an expanded revenue base. was primarily due to volume-driven growth in the grocery and warehouse club businesses as a result of expanded agreements Unallocated Corporate with Kraft Foods, Inc., including the addition of six new Unallocated corporate expenses pertain to certain functions, Starbucks coffees along with a selection of Tazo® teas. In such as executive management, accounting, administration, addition, product sales and royalty revenues increased as a tax, treasury and information technology infrastructure, result of opening 417 new licensed retail stores during the that support but are not specifically attributable to the previous 12 months. Foodservice and other revenues increased Company’s operating segments and include related depreciation $48 million, or 23.3%, to $254 million from $206 million and amortization expenses. Unallocated corporate expenses in fiscal 2003, due to both the addition of new and existing increased to $208 million for the fiscal year ended 2004, from Starbucks and Seattle Coffee Company foodservice accounts. $187 million in the 52-week period of fiscal 2003, primarily due to higher provisions for incentive compensation based on the United States operating income increased by 26.1% to $765 Company’s performance and other payroll-related expenditures. million for the fiscal year ended 2004, from $607 million for Total unallocated corporate expenses as a percentage of total the fiscal year ended 2003. Operating margin decreased to net revenues decreased to 3.9% for the fiscal year ended 2004, 17.0% of related revenues from 17.5% in the 52-week period compared to 4.6% for the 52-week period of fiscal 2003. of fiscal 2003, primarily due to higher dairy and green coffee commodity costs, as well as higher payroll-related expenditures to support the Company’s accelerated retail store growth. RESULTS OF OPERATIONS – FISCAL 2003 These increases were partially offset by leverage gained on fixed COMPARED TO FISCAL 2002 occupancy costs distributed over an expanded revenue base. Consolidated Results of Operations Net revenues for the fiscal year ended 2003 increased 23.9% to International $4.1 billion, from $3.3 billion for the corresponding fiscal 2002 The Company’s international operations (“International”) period. During the fiscal year ended 2003, Starbucks derived represent the remaining 15% of Company-operated retail 85% of total net revenues from its Company-operated retail revenues, 17% of total specialty revenues and 15% of total net stores. Company-operated retail revenues increased 23.5% to revenues. International sells coffees and other beverages, whole $3.4 billion for the fiscal year ended 2003, from $2.8 billion bean coffees, complementary food, coffee brewing equipment for the corresponding fiscal 2002 period. This increase was due and merchandise through Company-operated retail stores primarily to the opening of 602 new Company-operated retail in Canada, the United Kingdom, Thailand, Australia and stores during the previous 12 months, comparable store sales Singapore, as well as through retail store licensing operations growth of 8% driven almost entirely by increased transactions, and foodservice accounts in these and more than 20 other and the July 2003 acquisition of 49 Seattle’s Best Coffee and 21 20 Fiscal 2004 Annual Report
  • 10. Torrefazione Italia stores. regional offices and field personnel. The Company derived the remaining 15% of total net revenues Depreciation and amortization expenses increased to $237.8 from its Specialty Operations. Specialty revenues, which include million in fiscal 2003, from $205.6 million in fiscal 2002, licensing revenues and foodservice and other revenues, increased primarily due to opening 602 Company-operated retail stores $129.9 million, or 26.2%, to $625.9 million for the fiscal year during the previous 12 months and the refurbishment of ended 2003, from $496.0 million for the corresponding fiscal existing Company-operated retail stores. 2002 period. General and administrative expenses increased to $244.6 million Licensing revenues, which are derived from retail store in fiscal 2003, compared to $234.6 million in fiscal 2002, which licensing arrangements, grocery and warehouse club licensing included an $18.0 million charge for the litigation settlement of and certain other branded-product licensed operations, two California class action lawsuits. Excluding the litigation increased 31.3% to $409.6 million for the fiscal year ended charge, general and administrative expenses increased $28.0 2003, from $311.9 million for the corresponding fiscal 2002 million from the comparable fiscal 2002 period due to higher period. The increase was due to higher product sales and payroll-related expenditures and costs related to the acquisition royalty revenues from opening 599 new licensed retail stores of Seattle Coffee Company. General and administrative during the previous 12 months and growth in the licensed expenses as a percentage of total net revenues decreased to 6.0% grocery and warehouse club businesses. in fiscal 2003, compared to 7.1% in fiscal 2002. Foodservice and other revenues increased 17.5% to $216.3 Operating income increased 34.3% to $424.7 million in fiscal million for the fiscal year ended 2003, from $184.1 million 2003, from $316.3 million in fiscal 2002. The operating margin for the corresponding fiscal 2002 period. The increase was increased to 10.4% of total net revenues in fiscal 2003, compared primarily attributable to broader distribution and growth in to 9.6% in fiscal 2002, primarily due to leverage gained on fixed new and existing foodservice accounts. costs distributed over an expanding revenue base, partially offset by higher green coffee costs, as discussed above. Cost of sales and related occupancy costs increased to 41.4% of total net revenues in fiscal 2003, from 41.0% in fiscal 2002. Income from equity investees was $38.4 million in fiscal The increase was primarily due to higher green coffee costs 2003, compared to $33.4 million in fiscal 2002. The increase and a shift in specialty revenue mix to lower margin products. was mainly attributable to continued strong results by The The Company’s green coffee costs reached a historic low for North American Coffee Partnership, the Company’s 50%- Starbucks in the second and third fiscal quarters of 2002 and owned partnership with the Pepsi-Cola Company, from have gradually increased since then. These increases were expanded ready-to-drink product lines, lower direct costs and partially offset by leverage gained on fixed occupancy costs manufacturing efficiencies. Partially offsetting this increase distributed over an expanded revenue base. was the Company’s proportionate share of the net losses of Starbucks Japan in fiscal 2003, compared to a net profit in fiscal Store operating expenses as a percentage of Company-operated 2002, primarily due to lower average sales per store. retail revenues increased to 40.0% in fiscal 2003, from 39.7% in fiscal 2002, primarily due to higher payroll-related and Net interest and other income, which primarily consists of advertising expenditures. Payroll-related costs have increased interest income, increased to $11.6 million in fiscal 2003, from primarily due to an increase in the number of partners eligible $9.3 million in fiscal 2002. The growth was a result of increased to participate in the Company’s medical and vacation benefits. interest received on higher balances of cash, cash equivalents Advertising expenditures increased in fiscal 2003 due to and liquid securities during fiscal 2003, compared to the prior promotions for new and existing products. These increases year, as well as gains realized on market revaluations of the were partially offset by lower provisions for asset impairment Company’s trading securities, compared to realized losses on for International Company-operated retail stores in 2003 as this portfolio in the prior year. compared to the prior year. The Company’s effective tax rate for fiscal 2003 was 38.5% Other operating expenses (expenses associated with the compared to 37.3% in fiscal 2002, as a result of a shift in the Company’s Specialty Operations) were 22.6% of specialty composition of the Company’s pretax earnings in fiscal 2003. revenues in fiscal 2003, compared to 21.4% in fiscal 2002, Operations taxed in the United States had higher pretax earnings primarily due to higher payroll-related expenditures to support and International operations generated greater nondeductible the continued development of the Company’s foodservice losses during fiscal 2003 than during fiscal 2002. distribution network and international infrastructure, including 21 Fiscal 2004 Annual Report
  • 11. Segment Results of Operations The following tables summarize the Company’s results of operations by segment for fiscal 2003 and 2002 (in thousands): % of % of % of United States International Unallocated Total Net 52 weeks ended September 28, 2003 United States Revenue International Revenue Corporate Revenue Consolidated Net revenues: Company-operated retail $ 2,965,618 85.4% $ 484,006 80.3% $ – –% $ 3,449,624 Specialty: Licensing 301,175 8.7 108,376 18.0 – – 409,551 Foodservice and other 205,659 5.9 10,688 1.7 – – 216,347 Total specialty 506,834 14.6 119,064 19.7 – – 625,898 Total net revenues 3,472,452 100.0 603,070 100.0 – – 4,075,522 Cost of sales and related occupancy costs 1,363,267 39.3 322,661 53.5 – – 1,685,928 40.4 (1) 37.3 (1) Store operating expenses 1,199,020 180,554 – – 1,379,574 23.7 (2) 18.0 (2) Other operating expenses 119,960 21,386 – – 141,346 Depreciation and amortization expenses 167,138 4.8 38,563 6.4 32,106 0.8 237,807 General and administrative expenses 45,007 1.3 44,352 7.4 155,191 3.8 244,550 Income from equity investees 28,484 0.8 9,912 1.6 – – 38,396 Operating income/(loss) $ 606,544 17.5% $ 5,466 0.9% $ (187,297) (4.6)% $ 424,713 % of % of % of United States International Unallocated Total Net 52 weeks ended September 29, 2002 United States Revenue International Revenue Corporate Revenue Consolidated Net revenues: Company-operated retail $ 2,425,163 85.7% $ 367,741 79.8% $ – –% $ 2,792,904 Specialty: Licensing 227,711 8.1 84,221 18.3 – – 311,932 Foodservice and other 175,379 6.2 8,693 1.9 – – 184,072 Total specialty 403,090 14.3 92,914 20.2 – – 496,004 Total net revenues 2,828,253 100.0 460,655 100.0 – – 3,288,908 Cost of sales and related occupancy costs 1,114,535 39.4 235,476 51.1 – – 1,350,011 39.7 (1) 40.3 (1) Store operating expenses 961,617 148,165 – – 1,109,782 21.8 (2) 19.8 (2) Other operating expenses 87,718 18,366 – – 106,084 Depreciation and amortization expenses 142,752 5.0 34,069 7.4 28,736 0.9 205,557 General and administrative expenses 33,928 1.2 35,007 7.6 165,646 5.0 234,581 Income from equity investees 19,182 0.7 14,263 3.1 – – 33,445 Operating income/(loss) $ 506,885 17.9% $ 3,835 0.8% $ (194,382) (5.9)% $ 316,338 (1) Shown as a percentage of related Company-operated retail revenues. (2) Shown as a percentage of related total specialty revenues. United States International United States total net revenues increased by $644.2 million, International total net revenues increased $142.4 million, or or 22.8%, to $3.5 billion in fiscal year 2003 from $2.8 billion 30.9%, to $603.1 million in fiscal 2003, from $460.7 million for in fiscal 2002. United States Company-operated retail revenues the corresponding fiscal 2002 period. International Company- increased $540.5 million, or 22.3%, to $3.0 billion, primarily operated retail revenues increased $116.3 million, or 31.6%, due to the opening of 506 new Company-operated retail stores to $484.0 million, primarily due to the opening of 96 new in fiscal 2003 and comparable store sales growth of 9%. The Company-operated retail stores in fiscal 2003 and comparable increase in comparable store sales was almost entirely due to store sales growth of 7%. The increase in comparable store sales higher transaction volume. was almost entirely due to higher transaction volume and reflects the improved operational execution in the U.K. market. Total United States specialty revenues increased $103.7 million, or 25.7%, to $506.8 million in fiscal 2003, compared to $403.1 Total International specialty revenues increased $26.1 million, million in fiscal 2002. United States licensing revenues increased or 28.1%, to $119.1 million in fiscal 2003, from $92.9 million $73.5 million, or 32.3%, to $301.1 million in fiscal 2003. The in fiscal 2002. The increase was primarily due to higher product increase was primarily due to higher product sales and royalty sales and royalty revenues from opening 284 new licensed retail revenues as a result of opening 315 new licensed retail stores stores during the previous 12 months. during the previous 12 months and growth in the grocery and International operating income increased 42.5% to $5.5 million warehouse club businesses. United States foodservice and other in fiscal 2003, from $3.8 million in fiscal 2002. Operating revenues increased $30.3 million, or 17.3%, to $205.7 million in margin increased to 0.9% of related revenues from 0.8% in fiscal 2003, due to broader distribution and growth in new and the corresponding fiscal 2003 period, primarily due to lower existing foodservice accounts. provisions recorded for retail store asset impairment and disposals United States operating income increased 19.7% to $606.5 of $3.7 million in fiscal 2003, compared to $13.9 million in fiscal million in fiscal 2003, from $506.9 million in fiscal 2002. 2002. This was partially offset by International’s proportionate Operating margin decreased to 17.5% of related revenues from share of net losses in Starbucks Japan and a shift in sales mix to 17.9% in the prior year, primarily due to higher green coffee lower-margin products. costs and payroll-related expenditures, partially offset by fixed occupancy costs distributed over an expanding revenue base. 22 Fiscal 2004 Annual Report