SlideShare uma empresa Scribd logo
1 de 15
Baixar para ler offline
MARATHON OIL CORPORATION REPORTS FOURTH QUARTER
                         AND FULL YEAR 2007 RESULTS


HOUSTON, Jan. 31, 2008 – Marathon Oil Corporation (NYSE: MRO) today reported fourth quarter 2007 net
income of $668 million, or $0.94 per diluted share. Net income in the fourth quarter of 2006 was $1.079
billion, or $1.53 per diluted share. For the fourth quarter of 2007, net income adjusted for special items was
$500 million, or $0.70 per diluted share, compared to net income adjusted for special items of $838 million, or
$1.19 per diluted share, for the fourth quarter of 2006.

Marathon reported 2007 net income of $3.956 billion, or $5.69 per diluted share. Net income in 2006 was
$5.234 billion, or $7.25 per diluted share. Marathon reported 2007 net income adjusted for special items of
$3.771 billion, or $5.43 per diluted share, compared to net income adjusted for special items of $4.636 billion,
or $6.42 per diluted share for 2006.

                            (a)
                                                                        Quarter ended                    Year ended
 Earnings Highlights
                                                                        December 31                     December 31
                                                                                     2006(c)                         2006(c)
(In millions, except per diluted share data)                          2007                            2007
Net income adjusted for special items(b)                         $       500     $       838      $    3,771     $      4,636
Adjustments for special items (net of taxes):
      Gain (loss) on long-term U.K. natural gas contracts                (62)              139          (118)             232
      Gain on foreign currency derivative instruments                      38                 -           112                -
      Deferred income taxes – tax legislation changes                    193                  -           193               21
                              – other adjustments                           -                93             -               93
      Gain on dispositions                                                  -                31             8             274
      Loss on early extinguishment of debt                                (1)              (22)          (10)             (22)
 Net income                                                      $       668     $       1,079    $     3,956    $       5,234
                                            (b)
Net income adjusted for special items             –
  per diluted share                                              $      0.70     $        1.19    $     5.43     $       6.42
Net income – per diluted share                                   $      0.94     $        1.53    $     5.69     $       7.25
Revenues and other income                                        $    18,364     $      13,986    $   65,207     $     65,449
Weighted average shares – diluted                                        713               705           695              722
(a)
       Results are preliminary and unaudited. Marathon expects to issue its audited consolidated financial statements at the
       end of February.
(b)
       See page 9 for a discussion of net income adjusted for special items.
(c)
       Restated for two-for-one stock split on June 18, 2007. See Note 3 on page 12.


                                                      Marathon Oil Corporation Reports Fourth Quarter and Full Year 2007 Results
Full Year Key Highlights


   • Closed $6.9 billion Western Oil Sands Inc. acquisition

   • Completed Equatorial Guinea Liquefied Natural Gas (EG LNG) Train 1 on budget and ahead of schedule

   • Discovered Droshky field (100 percent working interest) in Gulf of Mexico

   • Announced eight exploration discoveries in deepwater Angola

   • Was high bidder on 27 blocks at Central Gulf of Mexico Lease Sale No. 205

   • Began construction on projected $3.2 billion Garyville, La. refinery expansion

   • Approved projected $1.9 billion Detroit refinery heavy oil upgrading and expansion project

   • Achieved record full-year refinery crude oil and total throughputs

   • Raised quarterly dividend rate 20 percent

   • Repurchased approximately 16 million shares, extended stock repurchase authorization to $5 billion

   • Completed two-for-one common stock split


“The fourth quarter of 2007 was a difficult quarter that included: lower downstream margins driven primarily
by rapidly rising crude prices; relatively flat upstream production due to delays in the Alvheim project and
unscheduled downtime for warranty repairs at our Equatorial Guinea LNG production facility; unscheduled
downtime at our Athabasca Oil Sands Project in Canada; and higher exploration costs,” said Clarence P.
Cazalot, Jr., Marathon president and CEO.

“However, reflecting on all of 2007, we had significant accomplishments in each of our business segments;
and, we remain confident in Marathon’s integrated business strategy. Last year included the acquisition of
Western Oil Sands Inc., the completion of the EG LNG Train 1 production facility ahead of schedule and on
budget and groundbreaking on our projected $3.2 billion refinery expansion in Garyville, La.                 We also
continued to achieve significant exploration success in Angola and the Gulf of Mexico, and we anticipate
sanctioning major projects in both those areas during 2008.

“We expect 2008 will show significant growth as Marathon is uniquely positioned with a broad portfolio of
projects,” Cazalot added.    “Marathon continues to maintain financial discipline while delivering value to
investors through multiple reinvestment opportunities, dividends and share repurchases.”


Western Oil Sands Inc. Acquisition

On Oct. 18, 2007, Marathon purchased Western Oil Sands Inc. (Western) for cash and securities of $5.8 billion
and outstanding debt of $1.1 billion at closing, for a total transaction value of $6.9 billion. The acquisition
included a 20 percent interest in the outside-operated Athabasca Oil Sands Project (AOSP), which includes the
Muskeg River mine and the Scotford upgrader. The acquisition was accounted for under the purchase method
of accounting and, as such, Marathon’s results of operations include Western’s results from the date of
closing. The newly acquired oil sands mining operations have been reported in a separate Oil Sands Mining
segment.   Also included in this acquisition were heavy oil resources which may be recovered using in-situ


                            Marathon Oil Corporation Reports Fourth Quarter and Full Year 2007 Financial Results page 2
recovery techniques.    Activities related to these resources have been reported in the Exploration and
Production segment.


Segment Results

Total segment income was $455 million in the fourth quarter of 2007 and $3.875 billion for the full year 2007
compared with $833 million and $4.814 billion in the same periods of 2006.


                                                            Quarter ended                         Y ear ended
                                                            December 31                          December 31
(In millions)                                             2007         2006                    2007         2006
Segment Income (Loss)
Exploration and Production
                                                              153               167                623               873
  United States                                      $                 $                  $                 $
                                                              312               140              1,106             1,130
  International
                                                              465               307              1,729             2,003
     Total E&P
                                                              (63)              -                  (63)              -
Oil Sands Mining
                                                                4               533              2,077             2,795
Refining, Marketing and Transportation
                                                               49                 (7)              132                16
Integrated Gas
                                                              455               833              3,875             4,814
                                                     $                 $                  $                 $
     Segment Income(a)
  (a)
        See Preliminary Supplemental Statistics on page 13 for a reconciliation of segment income to net income as
        reported under generally accepted accounting principles.


Exploration and Production

Upstream segment income totaled $465 million in the fourth quarter of 2007, compared to $307 million in the
fourth quarter of 2006, primarily as a result of higher liquid hydrocarbon realizations which were partially
offset by lower liquid hydrocarbon sales volumes and increased exploration expenses. For the year, upstream
segment income was $1.729 billion, compared to $2.003 billion for 2006, primarily as a result of lower liquid
hydrocarbon sales volumes and natural gas realizations and increased exploration expenses, partially offset by
higher liquid hydrocarbon realizations and natural gas sales volumes.

Sales volumes averaged 354,000 barrels of oil equivalent per day (boepd) for the fourth quarter of 2007 and
351,000 boepd for the full year 2007, and production available for sale averaged 352,000 boepd and 353,000
boepd in the same periods.

United States upstream income was $153 million in the fourth quarter of 2007 and $623 million for the year,
compared to $167 million and $873 million in the same periods of 2006. Contributing to the decreases for
both periods were increased exploration expenses and lower liquid hydrocarbon and natural gas sales
volumes, partially offset by higher liquid hydrocarbon realizations. The largest sales volume declines in both
periods were associated with expected production declines for Gulf of Mexico and Permian Basin properties.
Exploration expenses increased $77 million in the fourth quarter of 2007 and $105 million for the year
compared to the same periods of 2006, primarily as a result of expensing non-commercial wells on the
Flathead prospect in the Gulf of Mexico in the fourth quarter of 2007.

International upstream income was $312 million in the fourth quarter of 2007 compared to $140 million in the
same period of 2006, primarily due to higher liquid hydrocarbon realizations. International upstream income
was $1.106 billion for the year, compared to $1.130 billion in 2006, primarily as a result of lower liquid
hydrocarbon sales volumes and natural gas realizations, partially offset by higher liquid hydrocarbon
                             Marathon Oil Corporation Reports Fourth Quarter and Full Year 2007 Financial Results page 3
realizations and natural gas sales volumes. The increase in Equatorial Guinea natural gas sales volumes due
to the start-up of the EG LNG Train 1 production facility in the second quarter of 2007 contributed to the
decline in the average realized natural gas price for the fourth quarter and full year 2007.

                                                                    Q uarter ended                    Y ear ended
                                                                    December 3 1                     December 3 1
                                                                  2007            2006            2007             2006

Key Production S tatistics
Net S ales
  Unite d Sta te s – Liq uid s (mb p d )                               60               74             64               76
  Unite d Sta te s – Na tura l Ga s (mmcfp d )                        474              522            477              532
    Inte rna tio na l – Liq uid s (mb p d )                           130              138            133              147
    Inte rna tio na l – Na tura l Ga s (mmcfp d )                     510              352            448              315

Net S ales from Continuing O perations (mboepd)                       354              357            351              365
Dis co ntinue d O p e ra tio ns (mb o e p d )                           -                -              -               12
Total Net S ales (mboepd)                                             354              357            351              377


During 2007, Marathon added net proved liquid hydrocarbon and natural gas reserves of 88 million barrels of
oil equivalent (mmboe), while producing 125 mmboe, resulting in a reserve replacement ratio of 70 percent.
For the three-year period ended Dec. 31, 2007, Marathon added net proved liquid hydrocarbon and natural
gas reserves of 516 mmboe, excluding dispositions of 46 mmboe, while producing 383 mmboe, resulting in an
average reserve replacement ratio of 135 percent. (The proven bitumen reserves at the AOSP are not included
in Marathon’s estimated net proved liquid hydrocarbon and natural gas reserves, but rather are reported
separately in the Oil Sands Mining segment.)

First production from the Alvheim/Vilje development in Norway is expected at the end of the first quarter of
2008, weather permitting. The peak net rate of approximately 75,000 boepd is expected to be achieved in
2008. The Volund development continues to make progress towards first production in the second half of 2009
and will be tied back to the Alvheim infrastructure. Marathon has a 65 percent interest in Alvheim and Volund
and a 47 percent interest in Vilje.

In the Gulf of Mexico, development of Neptune continues to progress. First oil is expected by the end of the
first quarter of 2008. Marathon has a 30 percent interest in Neptune.

Marathon is currently drilling an appraisal well on the Droshky discovery in the Gulf of Mexico. The Company
has secured an additional year of rig capacity in 2009 for development drilling in anticipation of a 2008 project
sanction. The timing of initial production will be dependent upon delivery of key equipment and regulatory
approvals, but could be as early as 2010.           Marathon holds a 100 percent working interest in the Droshky
prospect.

Also in the Gulf of Mexico, Marathon was high bidder on 27 blocks at the Minerals Management Service’s
Central Gulf of Mexico Lease Sale No. 205 in October 2007. These high bids total almost $222 million net to
Marathon.

During the fourth quarter of 2007, Marathon also completed the acquisition of more than 70,000 net leasehold
acres in the Bakken Shale play in North Dakota. The acreage brings Marathon’s total Bakken Shale leasehold


                              Marathon Oil Corporation Reports Fourth Quarter and Full Year 2007 Financial Results page 4
to more than 320,000 net acres. Marathon currently has six rigs running in its Bakken program and ended
2007 with a net production rate of 2,600 boepd.

The Company commenced its Piceance Basin activity in western Colorado and currently has two rigs running.
Marathon expects to drill approximately 165 total wells in the region over the next two years.

Marathon continues to grow an inventory of future growth opportunities with eight discoveries announced
during 2007 in deepwater Angola.              Announced in the fourth quarter, the Alho discovery was the 11th
discovery on Angola Block 32 and the 26th overall discovery in Marathon's deepwater exploration program on
Angola Blocks 31 and 32.

In addition, Marathon has been awarded two study agreements in Indonesia and farmed into additional study
agreements, which could lead to the acquisition of new leaseholds at a future lease sale. The Company also
signed a cooperation agreement with Naftogaz Ukrainy to study the potential of the Dnieper-Donets Basin in
the Ukraine.

Marathon exited its remaining 10 percent interest in the Ash Shaer and Cherrife natural gas fields in Syria
during the fourth quarter of 2007.

With the Alvheim/Vilje and Neptune developments coming online, Marathon expects 2008 production available
for sale to increase to a range of between 380 and 420 boepd. (This production guidance does not include
bitumen production from the AOSP, which will be reported in the Oil Sands Mining segment.) Despite the
challenges encountered with major project delivery in this volatile environment, the Company continues to be
on track to deliver compound average annual production growth of 6 to 9 percent from 2006 to 2010.


Oil Sands Mining

The Oil Sands Mining segment reported a loss of $63 million for the fourth quarter of 2007, which includes a
$39 million after-tax unrealized loss on derivative instruments held by Western at the acquisition date
intended to mitigate price risk related to future sales of synthetic crude oil.               Segment income was also
impacted during the fourth quarter due to a mid-November fire and subsequent curtailment of operations at
the Scotford upgrader, which upgrades the mined bitumen to synthetic crude oil.                         Maintenance work
scheduled for the first quarter of 2008 was accelerated and the Scotford upgrader returned to operation in late
December.

                                                                    Q uarter ended                  Y ear ended
                                                                    December 31                    December 31
                                                                  2007          2006             2007         2006
 Key O il Sands Mining Statistics
Net Bitume n Production (mbpd)(a)                                      15                -              4                 -
Net Synthetic Crude Oil Sales (mbpd)(a)                                17                -              4                 -
Synthe tic Crude Oil Ave ra ge Re alization (per bbl)(b) $          71.07                -         71.07                  -
                                                                               $             $                $
(a)
      The oil sands mining operations were acquired Oct. 18, 2007. Average daily volumes represent total volumes since the
      acquisition date over total days in the reporting period.
(b)
      Excludes losses on derivative instruments.


Marathon estimates that its net bitumen production in 2008 will be approximately 30 mboepd. Marathon
estimates its net share of the AOSP’s proven bitumen reserves to be 421 million barrels of bitumen.

                                  Marathon Oil Corporation Reports Fourth Quarter and Full Year 2007 Financial Results page 5
Marathon reached a $155 million settlement during the fourth quarter of 2007 to resolve certain insurance
claims by Western dating back to the startup of the mine. The settlement had no impact on segment income
for the fourth quarter of 2007.

The AOSP Phase 1 Expansion is currently under construction and it is anticipated that the expansion will be
complete in late 2010. The expansion includes construction of mining and extraction facilities at the Jackpine
mine; expansion of treatment facilities at the existing Muskeg River mine; expansion of the Scotford
upgrader; and development of related infrastructure.


Refining, Marketing and Transportation

Downstream segment income was $4 million in the fourth quarter of 2007 and $2.077 billion for the year,
compared to $533 million and $2.795 billion in the same periods of 2006, with the decrease in both periods
primarily a result of lower refining and wholesale marketing gross margins.            The refining and wholesale
marketing gross margin per gallon was 4.80 cents in the fourth quarter of 2007, compared to 17.07 cents in
the fourth quarter of 2006, and 18.48 cents for 2007, compared to 22.88 cents for 2006.

While the relevant market indicators [Light Louisiana Sweet (LLS) 6-3-2-1 crack spreads] in the Midwest
(Chicago) and Gulf Coast markets were weaker in the fourth quarter of 2007 compared to the fourth quarter
of 2006, the decline in Marathon’s refining and wholesale marketing gross margin was greater than that of the
market indicators as the Company’s wholesale price realizations in the fourth quarter of 2007 did not increase
over the comparable prior-year period as much as the average spot market prices used in the market
indicators.   In addition, the Company’s crude oil costs increased substantially more than the quarter-to-
quarter change in average LLS prices would indicate, primarily due to the shift in market structure from a
contango market in the fourth quarter of 2006 to a backwardated market in the fourth quarter of 2007.
Though the relevant market indicators for the full year 2007 were stronger than in 2006, Marathon’s refining
and wholesale marketing gross margin declined for that period primarily due to the significant and rapid
increase in crude oil prices during the year and lagging wholesale price realizations as discussed. The refining
and wholesale marketing gross margins for both the fourth quarter and full year 2007 were further reduced by
higher manufacturing costs related to planned maintenance at several refineries.           In addition to the lower
refining and wholesale marketing gross margins, segment income was impacted by higher operating and
administrative expenses in both periods.

Marathon’s refining and wholesale marketing gross margins included pre-tax derivatives losses of $427 million
for the fourth quarter and $899 million for the full year 2007, compared to pre-tax derivative gains of $194
million and $400 million in the same periods of 2006. The derivative changes reflect both the realized effects
of closed derivative positions as well as unrealized effects as a result of marking open derivative positions to
market.   Most derivatives have an underlying physical commodity transaction; however, the income effect
related to the derivatives and the income effect related to the underlying physical transactions may not
necessarily be recognized in net income in the same period.

Crude oil refined during the fourth quarter of 2007 averaged 956,000 barrels per day (bpd), which is
consistent with the throughput achieved in the fourth quarter of 2006. Total refinery inputs were lower in the
fourth quarter of 2007 compared to the fourth quarter of 2006, primarily due to the higher level of planned
maintenance completed on the fluid catalytic cracking units at three of the Company’s refineries during the
                            Marathon Oil Corporation Reports Fourth Quarter and Full Year 2007 Financial Results page 6
fourth quarter of 2007. Crude oil refined for the full year 2007 averaged a record 1,010,000 bpd, 30,000 bpd
higher than 2006. Total refinery throughputs also averaged a record 1,224,000 bpd for the full year 2007. .

                                                              Q uarter ended                      Y ear ended
                                                              December 3 1                       December 3 1
                                                            2007         2006                  2007         2006
Key Refining, Marketing & Transportation
 S tatistics
   C rud e O il Re fine d (mb p d )                             956               952            1,010               980
   O the r C ha rg e a nd Ble nd Sto cks (mb p d )              223               260              214               234
      Total Refinery Inputs (mbpd)                            1,179             1,212            1,224             1,214

Refined Products S ales Volumes (mbpd)                        1,432             1,389            1,410             1,425
Refining and W holesale Marketing Gross
  Margin ($ /gallon)                                       $0.0480           $0.1707          $0.1848           $0.2288


Speedway SuperAmerica LLC (SSA) gasoline and distillate gross margin per gallon averaged 11.31 cents
during the fourth quarter of 2007, up nearly 1 percent from the 11.21 cents realized in the fourth quarter of
2006, and averaged 11.19 cents for the full year 2007, down 3 percent from the 11.56 cents realized in 2006.
SSA’s same store merchandise sales increased 1.1 percent during the fourth quarter and 3.2 percent for the
full year 2007.

In the fourth quarter of 2007, Marathon’s Board of Directors approved a projected $1.9 billion heavy oil
upgrading and expansion project at the Company's Detroit refinery. Construction is expected to begin in early
2008, subject to obtaining the necessary permits from applicable regulatory agencies.

Construction continues to progress on the projected $3.2 billion Garyville refinery expansion project which will
increase the refinery’s capacity by 180,000 bpd. When completed in late 2009, this expansion will enable the
refinery to provide an additional 7.5 million gallons of clean transportation fuels to the market each day.


Integrated Gas

Integrated Gas segment income totaled $49 million in the fourth quarter of 2007 and $132 million for the full
year 2007, compared to a loss of $7 million and income of $16 million in the comparable periods of 2006.
During 2007, construction of the EG LNG Train 1 production facility was completed ahead of schedule and on
budget. The increases in segment income over the comparable prior-year periods were largely due to the fact
that this facility, in which Marathon holds a 60 percent interest, began operations in May 2007 and delivered
24 cargoes during the year. Following a shut-in for the repair of a minor leak, the LNG production facility
returned to normal operations in mid-November and has since produced at 92 percent of the 3.7 million
metric tones per annum nameplate capacity.           Additionally, income from the Company’s equity method
investment in Atlantic Methanol Production Company LLC was higher in both the fourth quarter and full year
2007 on increased methanol production and realized prices.

                                                            Q uarter ended                        Y ear ended
                                                            December 3 1                         December 3 1
                                                          2007          2006                   2007         2006
Key Integrated Gas S tatistics
Net S ales (metric tonnes per day)
  LNG                                                       3,890              901              3,310             1,026
  Me tha no l                                               1,376              807              1,308               905

                             Marathon Oil Corporation Reports Fourth Quarter and Full Year 2007 Financial Results page 7
Corporate

Marathon continued its $5 billion share repurchase program in 2007, repurchasing just over $2.5 billion of
common stock in less than two years under the program.            The Company currently anticipates completing
share repurchases by the end of 2009, although repurchases are likely to be less ratable than in prior years.
This program may be changed based on the Company’s financial condition or changes in market conditions
and is subject to termination prior to completion.

Marathon raised its quarterly dividend rate 20 percent in 2007, and this is the fifth consecutive year that the
Company has increased its dividend.

In April 2007, the Company's Board of Directors declared a two-for-one split of Marathon's common stock.
The stock split was effected in the form of a stock dividend distributed on June 18, 2007, to stockholders of
record at the close of business on May 23, 2007.


Special Items


Marathon has two long-term natural gas sales contracts in the United Kingdom that are accounted for as
derivative instruments.   Mark-to-market changes in the valuation of these contracts must be recognized in
current period income.    The non-cash after-tax mark-to-market losses on these two long-term natural gas
sales contracts related to Marathon’s Brae natural gas production totaled $62 million in the fourth quarter of
2007 and $118 million for the full year. Due to the volatility in the fair value of these contracts, Marathon
consistently excludes these non-cash gains and losses from net income adjusted for special items.

Marathon entered foreign currency derivative instruments to limit the Company’s exposure to changes in the
Canadian dollar exchange rate related to the cash portion of the Western purchase price. During the fourth
quarter of 2007, the after-tax gain on these derivative instruments was $38 million. The total after-tax gain
realized for the full year 2007 was $112 million. These gains on foreign currency derivative instruments have
been excluded from net income adjusted for special items.

Subsequent to Marathon’s acquisition of Western, decreases to the Canadian federal income tax rates were
enacted.   These rates will decrease from 32 percent to 25 percent by 2012.            The $193 million benefit of
applying this income tax rate change to the applicable net deferred tax liabilities has been excluded from net
income adjusted for special items for the fourth quarter and full year 2007.

Marathon extinguished a portion of its outstanding debt at a premium, recognizing a $1 million after-tax loss
in the fourth quarter of 2007 and a $10 million after-tax loss for the full year.          These losses have been
excluded from net income adjusted for special items.

Also excluded from full year 2007 net income adjusted for special items was an additional $8 million after-tax
gain related to the sale of the Company’s Russian oil exploration and production businesses in 2006.              This
special item was discussed in the second quarter of 2007.

The Company will conduct a conference call and webcast today, Jan. 31, 2008, at 2 p.m. EST during which it
will discuss fourth quarter and full year 2007 results. The webcast will include synchronized slides. To listen
to the webcast of the conference call and view the slides, visit the Marathon Web site at www.Marathon.com.


                            Marathon Oil Corporation Reports Fourth Quarter and Full Year 2007 Financial Results page 8
Replays of the webcast will be available through Feb. 13, 2008.               Quarterly financial and operational
information is also provided on Marathon’s Web site at http://ir.marathon.com in the Quarterly Investor
Packet.

                                                      - xxx -

In addition to net income determined in accordance with generally accepted accounting principles, Marathon
has provided supplementally “net income adjusted for special items,” a non-GAAP financial measure which
facilitates comparisons to earnings forecasts prepared by stock analysts and other third parties. Such
forecasts generally exclude the effects of items that are considered non-recurring, are difficult to predict or to
measure in advance or that are not directly related to Marathon's ongoing operations. A reconciliation between
GAAP net income and “net income adjusted for special items” is provided in a table on page 1 of this release.
“Net income adjusted for special items” should not be considered a substitute for net income as reported in
accordance with GAAP. Management, as well as certain investors, uses “net income adjusted for special items”
to evaluate Marathon's financial performance between periods. Management also uses “net income adjusted
for special items” to compare Marathon's performance to certain competitors.

Unlike capital expenditures reported under generally accepted accounting principles, the forecasted costs for
the Garyville refinery expansion project and the Detroit refinery heavy oil upgrading and expansion project
discussed in this release do not include capitalized interest. Capitalized interest is budgeted at the corporate
level.

This release contains forward-looking statements with respect to, the timing and levels of the Company's
worldwide liquid hydrocarbon and natural gas and condensate production, bitumen production, the
Alvheim/Vilje development, the Volund and Neptune developments, the Droshky prospect, potential
developments in Angola, anticipated future exploratory and development drilling activity, potential new
leaseholds in Indonesia, the AOSP expansion, the Garyville refinery expansion project, the Detroit refinery
heavy oil refining upgrading and expansion project, proved liquid hydrocarbon and natural gas reserves,
proven bitumen reserves and the common stock repurchase program. Some factors that could potentially
affect worldwide liquid hydrocarbon and natural gas and condensate production, bitumen production, the
Alvheim/Vilje, Volund and Neptune developments, the Droshky prospect, potential developments in Angola,
potential new leaseholds in Indonesia and anticipated future exploratory and development drilling activity
include pricing, supply and demand for petroleum products, the amount of capital available for exploration and
development, regulatory constraints, timing of commencing production from new wells, drilling rig availability,
unforeseen hazards such as weather conditions, acts of war or terrorist acts and the governmental or military
response thereto, and other geological, operating and economic considerations. Except for the Alvheim/Vilje,
Volund and Neptune developments, the foregoing forward-looking statements may be further affected by the
inability or delay in obtaining government and third-party approvals and permits. Worldwide production could
also be affected by the occurrence of acquisitions or dispositions of oil and gas properties. Factors that could
affect the AOSP expansion, the Garyville refinery expansion and the Detroit refinery heavy oil refining
upgrading and expansion projects include transportation logistics, availability of materials and labor,
unforeseen hazards such as weather conditions, delays in obtaining or conditions imposed by necessary
government and third-party approvals, and other risks customarily associated with construction projects. The
forward-looking statements related to proved reserves of liquid hydrocarbons and natural gas are based on
certain assumptions including, among others, presently known physical data concerning size and character of
reservoirs, economic recoverability, technology development, future drilling success, production experience,
industry economic conditions, levels of cash flow from operations and operating conditions. The forward-
looking statements regarding the proven bitumen reserves are based on presently known physical data,
economic recoverability and operating conditions. The common stock repurchase program could be affected by
changes in prices of and demand for crude oil, natural gas and refined products, actions of competitors,
disruptions or interruptions of the Company’s production or refining operations due to unforeseen hazards
such as weather conditions or acts of war or terrorist acts, and other operating and economic considerations.
The foregoing factors (among others) could cause actual results to differ materially from those set forth in the
forward-looking statements. In accordance with the quot;safe harborquot; provisions of the Private Securities Litigation
Reform Act of 1995, Marathon Oil Corporation has included in its Annual Report on Form 10-K for the year
ended December 31, 2006, and subsequent Forms 10-Q and 8-K, cautionary language identifying other
important factors, though not necessarily all such factors, that could cause future outcomes to differ
materially from those set forth in the forward-looking statements.

                            Marathon Oil Corporation Reports Fourth Quarter and Full Year 2007 Financial Results page 9
Cautionary Note to U.S. Investors - The United States Securities and Exchange Commission (SEC) permits
oil and gas companies, in their filings with the SEC, to disclose only proved oil and gas reserves that have
demonstrated by actual production or conclusive formation tests to be economically and legally producible
under existing economic and operating conditions. Marathon Oil Corporation uses certain terms in this press
release, such as heavy oil resources that the SEC's guidelines strictly prohibit us from including in filings with
the SEC. U.S. Investors are urged to consider closely the disclosures in Marathon's periodic filings with the
SEC, available from us at 5555 San Felipe, Houston, Texas 77056 and the Company's Web site at
http://www.Marathon.com. You can also obtain this information from the SEC by calling 1-800-SEC-0330.


Media Relations Contacts:               Lee Warren                713-296-4103
                                        Scott Scheffler           713-296-4102
Investor Relations Contacts:            Howard Thill              713-296-4140
                                        Michol Ecklund            713-296-3919


                           Marathon Oil Corporation Reports Fourth Quarter and Full Year 2007 Financial Results page 10
Condensed Consolidated Statements of Income (Unaudited)
                                                           Quarter ended                       Y ear ended
                                                           December 31                        December 31
(In millions, except per share data)                    2007              2006             2007             2006
Revenues and other income:
  Sales and other operating revenues                $                 $                $                $
                                                         17,704            13,274           62,800            57,973
    (including consumer excise taxes)
                                                               2               208             127             5,457
  Revenues from matching buy/sell
                                                             479               325           1,625             1,466
  Sales to related parties
                                                             151                93             545               391
  Income from equity method investments
                                                              16                49              36                77
  Net gain on disposal of assets
                                                              12                37              74                85
  Other income
                                                         18,364            13,986           65,207            65,449
     Total revenues and other income
Costs and expenses:
  Cost of revenues (excludes items below )               14,944              9,768          49,235            42,415
  Purchases related to matching buy/sell
                                                               2               191             149             5,396
     transactions
                                                              72                51             232               210
  Purchases from related parties
                                                           1,307             1,240           5,163             4,979
  Consumer excise taxes
                                                             415               388           1,613             1,518
  Depreciation, depletion and amortization
                                                             377               333           1,327             1,228
  Selling, general and administrative
                                                             108                91             394               371
  Other taxes
                                                             190               131             454               365
  Exploration expenses
                                                         17,415            12,193           58,567            56,482
      Total costs and expenses

Income from operations                                       949             1,793           6,640             8,967
  Net interest and other financing
                                                            (17)                 44               41               37
   income (costs)
  Gain on foreign currency derivative
   instruments                                                 62                 -             182                 -
                                                              (3)              (35)            (17)              (35)
  Loss on early extinguishment of debt
  Minority interests in loss of Equatorial
      LNG Holdings Limited                                       -                3                3               10
Income from continuing operations before
   income taxes                                              991             1,805           6,849             8,979
                                                             323               726           2,901             4,022
  Provision for income taxes
Income from continuing operations                            668             1,079           3,948             4,957
Discontinued operations                                          -                 -               8              277
Net income                                          $        668      $      1,079     $     3,956      $      5,234
  Income from continuing operations
    Per share – basic                                      $0.95             $1.54           $5.72             $6.92
    Per share – diluted                                    $0.94             $1.53           $5.68             $6.87
  Net income
   Per share – basic                                       $0.95             $1.54           $5.73             $7.31
   Per share – diluted                                     $0.94             $1.53           $5.69             $7.25
  Dividends paid per share                                 $0.24             $0.20           $0.92             $0.76
  Weighted average shares
                                                             708               699              690               716
   Basic
                                                             713               705              695               722
   Diluted


                           Marathon Oil Corporation Reports Fourth Quarter and Full Year 2007 Financial Results page 11
Selected Notes to Financial Statements (Unaudited)

1.   On October 18, 2007, Marathon purchased Western Oil Sands Inc. (Western) for cash and securities of
     $5.8 billion. Western’s outstanding debt was $1.1 billion at closing, for a total transaction value of $6.9
     billion. The acquisition was accounted for under the purchase method of accounting and, as such,
     Marathon’s results of operations include Western’s results from October 18, 2007.

2.   Equatorial Guinea LNG Holdings Limited (EGHoldings), in which Marathon holds a 60 percent interest, was
     formed for the purpose of constructing and operating an LNG production facility. During facility
     construction, EGHoldings was a variable interest entity (VIE) that was consolidated by Marathon because
     Marathon was its primary beneficiary. Once the LNG production facility commenced its primary operations
     and began to generate revenue in May 2007, EGHoldings was no longer a VIE. Effective May 1, 2007,
     Marathon no longer consolidates EGHoldings, despite the fact that the Company holds majority ownership,
     because the minority shareholders have rights limiting Marathon’s ability to exercise control over the
     entity. Marathon’s investment is accounted for prospectively using the equity method of accounting.

3.   On April 25, 2007, the Company’s Board of Directors declared a two-for-one split of the Company’s
     common stock. The stock split was effected in the form of a stock dividend distributed on June 18, 2007,
     to stockholders of record at the close of business on May 23, 2007. Stockholders received one additional
     share of Marathon Oil Corporation common stock for each share of common stock held as of the close of
     business on the record date. Common share and per share information for all periods presented in the
     condensed consolidated statements of income has been restated to reflect the stock split.


                            Marathon Oil Corporation Reports Fourth Quarter and Full Year 2007 Financial Results page 12
Preliminary Supplemental Statistics (Unaudited)

                                                                    Quarter ended                          Y ear ended
                                                                   December 31                        December 31
(Dollars in millions, except as noted)                           2007       2006                    2007       2006
SEGMENT INCOME (LOSS)
Exploration and Production
                                                                    153                167            623                873
  United States                                              $                 $                $                $
                                                                    312                140          1,106              1,130
  International
                                                                    465                307          1,729              2,003
     E&P segment
                                                                    (63)               -              (63)               -
Oil Sands Mining
                                                                      4                533          2,077              2,795
Refining, Marketing and Transportation
                                                                     49                  (7)          132                 16
Integrated Gas
                                                                    455                833          3,875              4,814
     Segment income
Items not allocated to segments, net of taxes
                                                                         45                 5        (104)               (212)
  Corporate and other unallocated items
  Gain (loss) on long-term U.K. natural gas
                                                                     (62)              139           (118)                232
    contracts
  Gain on foreign currency derivative
    instruments                                                          38             -              112                -
  Deferred income taxes
      – tax legislation changes                                     193                 -              193                 21
      – other adjustments                                            -                 93              -                  93
  Gain on dispositions                                               -                 31               8                274
                                                                         (1)          (22)            (10)               (22)
 Loss on early extinguishment of debt
                                                                    -                 -               -                   34
 Discontinued operations
                                                                    668             1,079           3,956              5,234
      Net income                                             $                 $                $                $
CAPITAL EXPENDITURES
                                                                    888               553           2,511              2,169
 Exploration and Production                                  $                 $                $                $
                                                                    165               -               165                -
 Oil Sands Mining
                                                                    659               389           1,640                916
 Refining, Marketing and Transportation
 Integrated Gas (a)                                                 -                  71               93               307
                                                                    -                 -               -                   45
 Discontinued Operations
                                                                      29               15               57                41
 Corporate
                                                                  1,741             1,028           4,466              3,478
       Total                                                 $                 $                $                $
EXPLORATION EXPENSES
                                                                    137                 60             274                169
 United States                                               $                 $                $                $
                                                                     53                 71             180                196
 International
                                                                    190                131             454                365
       Total                                                 $                 $                $                $
         Through April 2007, includes Equatorial Guinea LNG Holdings (EGHoldings) at 100 percent. Effective May 1, 2007,
   (a)

         Marathon no longer consolidates EGHoldings and its investment in EG Holdings is accounted for under the equity method of
         accounting; therefore, EGHoldings’ capital expenditures subsequent to April 2007 are not included in Marathon’s capital
         expenditures.


                               Marathon Oil Corporation Reports Fourth Quarter and Full Year 2007 Financial Results page 13
Preliminary Supplemental Statistics (Unaudited)

                                                                  Q uarter ended                         Y ear ended
                                                                  December 31                           December 3 1
                                                                2007         2006                     2007         2006
E&P O PERATING S TATISTICS
 Ne t Liquid Hydro ca rbo n Sa le s (mbpd)(b)
                                                                    60                   74                64                 76
   Unite d Sta te s
                                                                    34                   34                33                 35
   Euro pe
                                                                    96                  104              1 00                112
   Africa
                                                                   130                  138              1 33                147
         To ta l Inte rna tio na l
                                                                   190                  212              1 97                223
           W o rldw ide C o ntinuing O pe ra tio ns
                                                                                                                              12
            Dis co ntinue d O pe ra tio ns                                               –
                                                                     –                                      –
                                                                   190                  212              1 97                235
              W o rldw ide
                                        (b)(c)
 Ne t Na tura l Ga s Sa le s (mmcfd)
                                                                   474                  522              4 77                532
   Unite d Sta te s
                                                                   245                  262              2 16                243
   Euro pe
                                                                   265                   90              2 32                 72
   Africa
                                                                   510                  352              4 48                315
         To ta l Inte rna tio na l
                                                                   984                  874              9 25                847
              W o rldw ide
 To ta l W o rldw ide Sa le s (mbo e pd)
                                                                   354                  357              3 51                365
   C o ntinuing o pe ra tio ns
                                                                                                                              12
   Dis co ntinue d o pe ra tio ns                                                        –
                                                                     –                                      –
                                                                   354                  357              3 51                377
              W o rldw ide

Ave ra ge Re a liz a tio ns (d)
  Liquid Hydro ca rbo ns (pe r bbl)
    Unite d Sta te s                                 $            74.16       $       48.33      $      60.15       $       54.41
    Euro pe                                                       89.17               59.01             70.31               64.02
    Africa                                                        83.05               53.61             66.09               59.83
         To ta l Inte rna tio na l                                84.64               54.94             67.15               60.81
           W o rldw ide C o ntinuing O pe ra tio ns               81.33               52.63             64.86               58.63
           Dis co ntinue d O pe ra tio ns                                                                                   38.38
                                                                                        –
                                                                     –                                     –
              W o rldw ide                          $             81.33       $       52.63     $       64.86      $        57.58
  Na tura l Ga s (pe r mcf)
    Unite d Sta te s                                $               5.70      $         5.36    $         5.73     $         5.76
    Euro pe                                                         7.98                6.49              6.53               6.74
    Africa                                                          0.25                0.32              0.25               0.27
         To ta l Inte rna tio na l                                  3.96                4.90              3.28               5.27
              W o rldw ide                          $               4.80      $         5.17    $         4.54     $         5.58
         Amounts represent net sales after royalties, except for Ireland where amounts are before royalties.
   (b)

         Includes natural gas acquired for injection and subsequent resale of 41 mmcfd and 47 mmcfd for the fourth quarters of
   (c)

         2007 and 2006, and 47 mmcfd and 46 mmcfd for the years 2007 and 2006.
         Excludes gains and losses on traditional derivative instruments and the unrealized effects of long-term U.K. natural gas
   (d)

         contracts that are accounted for as derivatives.


                                Marathon Oil Corporation Reports Fourth Quarter and Full Year 2007 Financial Results page 14
Preliminary Supplemental Statistics (Unaudited) (continued)

                                                                             Quarter ended                          Y ear ended
                                                                             December 31                           December 31
 (Dollars in millions, except as noted)                                    2007        2006                      2007        2006
 OSM OPERATING STATISTICS
 Net Bitumen Production (mbpd)(e)                                                15                    -                 4                  -
                                                    (e)
 Net Synthetic Crude Oil Sales (mbpd)                                          17                      -              4                     -
 Synthetic Crude Oil Average Realization (per bbl)(f) $                     71.07                      -          71.07                     -
                                                                                        $                  $                  $
 RM&T OPERATING STATISTICS
 Refinery Runs (mbpd)
  Crude oil refined                                                           956                 952             1,010                 980
  Other charge and blend stocks                                               223                 260               214                 234
       Total                                                                1,179               1,212             1,224               1,214
 Refined Product Yields (mbpd)
  Gasoline                                                                    635                 681               646                 661
  Distillates                                                                 339                 342               349                 323
  Propane                                                                      21                  24                23                  23
  Feedstocks and special products                                              81                  74               108                 107
  Heavy fuel oil                                                               34                  34                27                  26
  Asphalt                                                                      84                  74                86                  89
       Total                                                                1,194               1,229             1,239               1,229
 Refined Products Sales Volumes (mbpd)(g)(h)                                1,432               1,389             1,410               1,425
 Matching buy/sell volumes included in above (h)                                                                                           24
                                                                                                    —
                                                                                  —                                      —
 Refining and W holesale Marketing Gross
      Margin (i)(j)                                                       0.0480              0.1707            0.1848        $     0.2288
                                                                     $                  $                  $
 Speedw ay SuperAmerica
  Retail outlets                                                           1,636               1,636                                       —
                                                                                                                         —
                                           (k)
                                                                             836                 842             3,356               3,301
      Gasoline and distillate sales
                                                    (j)
                                                                          0.1131              0.1121            0.1119              0.1156
   Gasoline and distillate gross margin                              $                  $                  $                  $
   Merchandise sales                                                 $       686        $        677       $     2,796        $      2,706
   Merchandise gross margin                                          $       172        $        170       $       705        $        667
 IG OPERATING STATISTICS
 Net Sales (metric tonnes per day)
   LNG                                                                      3,890                  901            3,310               1,026
                                                                            1,376                  807            1,308                 905
   Methanol
(e)
      The oil sands mining operations were acquired October 18, 2007. Average daily volumes represent total volumes since the
      acquisition date over total days in the reporting period.
(f)
      Excludes losses on derivative instruments.
(g)
      Total average daily volumes of all refined product sales to wholesale, branded and retail (SSA) customers.
(h)
      As a result of the change in accounting for matching buy/sell arrangements on April 1, 2006, the reported sales volumes will be
      lower than the volumes determined under the previous accounting practices.
(i)
      Sales revenue less cost of refinery inputs, purchased products and manufacturing expenses, including depreciation. As a result
      of the change in accounting for matching buy/sell transactions on April 1, 2006, the resulting per gallon statistic will be higher
      than the statistic that would have been calculated from amounts determined under previous accounting practices.
(j)
      Per gallon
(k)
      Millions of gallons


                                   Marathon Oil Corporation Reports Fourth Quarter and Full Year 2007 Financial Results page 15

Mais conteúdo relacionado

Mais procurados

Webcast q306 ing
Webcast q306 ingWebcast q306 ing
Webcast q306 ingPetrobras
 
Webcast 4Q09
Webcast 4Q09Webcast 4Q09
Webcast 4Q09Petrobras
 
marathon oil 2nd Quarter 2008
marathon oil  	  2nd Quarter 2008  marathon oil  	  2nd Quarter 2008
marathon oil 2nd Quarter 2008 finance4
 
Webcast 4 t11 inglês final
Webcast 4 t11 inglês finalWebcast 4 t11 inglês final
Webcast 4 t11 inglês finalPetrobras
 
spectra energy _2QEarningsRelease
spectra energy _2QEarningsReleasespectra energy _2QEarningsRelease
spectra energy _2QEarningsReleasefinance49
 
spectra energy 3Q07SpectraEnergyEarnings
spectra energy 3Q07SpectraEnergyEarningsspectra energy 3Q07SpectraEnergyEarnings
spectra energy 3Q07SpectraEnergyEarningsfinance49
 
OGX 4Q12 Earnings Presentation
OGX 4Q12 Earnings PresentationOGX 4Q12 Earnings Presentation
OGX 4Q12 Earnings PresentationOgx2011
 
Webcast: Results Announcement - 1st Quarter 2006 (Brazilian Corporate Law)
Webcast: Results Announcement - 1st Quarter 2006 (Brazilian Corporate Law)Webcast: Results Announcement - 1st Quarter 2006 (Brazilian Corporate Law)
Webcast: Results Announcement - 1st Quarter 2006 (Brazilian Corporate Law)Petrobras
 
monsanto 11-08-07-8
monsanto 11-08-07-8monsanto 11-08-07-8
monsanto 11-08-07-8finance28
 
Webcast 4 t07_ing
Webcast 4 t07_ingWebcast 4 t07_ing
Webcast 4 t07_ingPetrobras
 
Webcast 2Q10 IFRS
Webcast 2Q10 IFRSWebcast 2Q10 IFRS
Webcast 2Q10 IFRSPetrobras
 
bnsf 3Q_2005_Investors_Report
bnsf 3Q_2005_Investors_Reportbnsf 3Q_2005_Investors_Report
bnsf 3Q_2005_Investors_Reportfinance16
 
Earning Presentation of General Motors: Q4 2007
Earning Presentation of General Motors: Q4 2007Earning Presentation of General Motors: Q4 2007
Earning Presentation of General Motors: Q4 2007investorrelation
 
GM_Earning Release_Q4_08_Chart Set
GM_Earning Release_Q4_08_Chart SetGM_Earning Release_Q4_08_Chart Set
GM_Earning Release_Q4_08_Chart SetManya Mohan
 
gmac Robert Hull, GMAC Chief Financial Officer 2007 Fourth Quarter and Full-Y...
gmac Robert Hull, GMAC Chief Financial Officer 2007 Fourth Quarter and Full-Y...gmac Robert Hull, GMAC Chief Financial Officer 2007 Fourth Quarter and Full-Y...
gmac Robert Hull, GMAC Chief Financial Officer 2007 Fourth Quarter and Full-Y...finance8
 
raytheon Q4 Earnings Presentation
raytheon Q4 Earnings Presentationraytheon Q4 Earnings Presentation
raytheon Q4 Earnings Presentationfinance12
 
Earning Presentation of General Motors: Q3 2007
Earning Presentation of General Motors: Q3 2007Earning Presentation of General Motors: Q3 2007
Earning Presentation of General Motors: Q3 2007investorrelation
 
bnsf 3Q 2007 investors_Report
bnsf 3Q 2007 investors_Reportbnsf 3Q 2007 investors_Report
bnsf 3Q 2007 investors_Reportfinance16
 

Mais procurados (20)

Webcast q306 ing
Webcast q306 ingWebcast q306 ing
Webcast q306 ing
 
Webcast 4Q09
Webcast 4Q09Webcast 4Q09
Webcast 4Q09
 
ford 2008 Q2 Financial Result
ford 2008 Q2 Financial Resultford 2008 Q2 Financial Result
ford 2008 Q2 Financial Result
 
marathon oil 2nd Quarter 2008
marathon oil  	  2nd Quarter 2008  marathon oil  	  2nd Quarter 2008
marathon oil 2nd Quarter 2008
 
Webcast 4 t11 inglês final
Webcast 4 t11 inglês finalWebcast 4 t11 inglês final
Webcast 4 t11 inglês final
 
spectra energy _2QEarningsRelease
spectra energy _2QEarningsReleasespectra energy _2QEarningsRelease
spectra energy _2QEarningsRelease
 
spectra energy 3Q07SpectraEnergyEarnings
spectra energy 3Q07SpectraEnergyEarningsspectra energy 3Q07SpectraEnergyEarnings
spectra energy 3Q07SpectraEnergyEarnings
 
OGX 4Q12 Earnings Presentation
OGX 4Q12 Earnings PresentationOGX 4Q12 Earnings Presentation
OGX 4Q12 Earnings Presentation
 
Webcast: Results Announcement - 1st Quarter 2006 (Brazilian Corporate Law)
Webcast: Results Announcement - 1st Quarter 2006 (Brazilian Corporate Law)Webcast: Results Announcement - 1st Quarter 2006 (Brazilian Corporate Law)
Webcast: Results Announcement - 1st Quarter 2006 (Brazilian Corporate Law)
 
monsanto 11-08-07-8
monsanto 11-08-07-8monsanto 11-08-07-8
monsanto 11-08-07-8
 
Webcast 4 t07_ing
Webcast 4 t07_ingWebcast 4 t07_ing
Webcast 4 t07_ing
 
Webcast 2Q10 IFRS
Webcast 2Q10 IFRSWebcast 2Q10 IFRS
Webcast 2Q10 IFRS
 
bnsf 3Q_2005_Investors_Report
bnsf 3Q_2005_Investors_Reportbnsf 3Q_2005_Investors_Report
bnsf 3Q_2005_Investors_Report
 
ford 2007 Q4 and Full Year Financial Result
ford 2007 Q4 and Full Year Financial Resultford 2007 Q4 and Full Year Financial Result
ford 2007 Q4 and Full Year Financial Result
 
Earning Presentation of General Motors: Q4 2007
Earning Presentation of General Motors: Q4 2007Earning Presentation of General Motors: Q4 2007
Earning Presentation of General Motors: Q4 2007
 
GM_Earning Release_Q4_08_Chart Set
GM_Earning Release_Q4_08_Chart SetGM_Earning Release_Q4_08_Chart Set
GM_Earning Release_Q4_08_Chart Set
 
gmac Robert Hull, GMAC Chief Financial Officer 2007 Fourth Quarter and Full-Y...
gmac Robert Hull, GMAC Chief Financial Officer 2007 Fourth Quarter and Full-Y...gmac Robert Hull, GMAC Chief Financial Officer 2007 Fourth Quarter and Full-Y...
gmac Robert Hull, GMAC Chief Financial Officer 2007 Fourth Quarter and Full-Y...
 
raytheon Q4 Earnings Presentation
raytheon Q4 Earnings Presentationraytheon Q4 Earnings Presentation
raytheon Q4 Earnings Presentation
 
Earning Presentation of General Motors: Q3 2007
Earning Presentation of General Motors: Q3 2007Earning Presentation of General Motors: Q3 2007
Earning Presentation of General Motors: Q3 2007
 
bnsf 3Q 2007 investors_Report
bnsf 3Q 2007 investors_Reportbnsf 3Q 2007 investors_Report
bnsf 3Q 2007 investors_Report
 

Destaque

marathon oil 2nd Quarter 2005
marathon oil   	  2nd Quarter 2005 marathon oil   	  2nd Quarter 2005
marathon oil 2nd Quarter 2005 finance4
 
Anthem, Inc. Reports Stronger than Expected Third Quarter Earnings
Anthem, Inc. Reports Stronger than Expected Third Quarter EarningsAnthem, Inc. Reports Stronger than Expected Third Quarter Earnings
Anthem, Inc. Reports Stronger than Expected Third Quarter Earningsfinance4
 
marathon oil 3rd Quarter 2006
marathon oil  	  3rd Quarter 2006marathon oil  	  3rd Quarter 2006
marathon oil 3rd Quarter 2006finance4
 
Anthem, Inc. Reports Strong Third Quarter Results
	Anthem, Inc. Reports Strong Third Quarter Results	Anthem, Inc. Reports Strong Third Quarter Results
Anthem, Inc. Reports Strong Third Quarter Resultsfinance4
 
johnson & johnson 2003 Annual Report
johnson & johnson 2003 Annual Reportjohnson & johnson 2003 Annual Report
johnson & johnson 2003 Annual Reportfinance4
 
marathon oil 1st Quarter 2004
marathon oil   	  1st Quarter 2004marathon oil   	  1st Quarter 2004
marathon oil 1st Quarter 2004finance4
 
marathon oil 4th Quarter 2002
marathon oil   	  4th Quarter 2002marathon oil   	  4th Quarter 2002
marathon oil 4th Quarter 2002finance4
 
2Q06 GAAP Reconciliations
	2Q06 GAAP Reconciliations	2Q06 GAAP Reconciliations
2Q06 GAAP Reconciliationsfinance4
 
Third Quarter 2002 Earnings Conference Call Transcript
Third Quarter 2002 Earnings Conference Call TranscriptThird Quarter 2002 Earnings Conference Call Transcript
Third Quarter 2002 Earnings Conference Call Transcriptfinance4
 
united technologies 2003 Annual English
united technologies 2003 Annual Englishunited technologies 2003 Annual English
united technologies 2003 Annual Englishfinance4
 
marathon oil 2005 Annual Report
marathon oil 2005 Annual Reportmarathon oil 2005 Annual Report
marathon oil 2005 Annual Reportfinance4
 
johnson & johnson Sales of Key Products Franchises Q4 2008
johnson & johnson Sales of Key Products Franchises Q4 2008johnson & johnson Sales of Key Products Franchises Q4 2008
johnson & johnson Sales of Key Products Franchises Q4 2008finance4
 
Anthem, Inc. Reports Results for Third Quarter 2001
Anthem, Inc. Reports Results for Third Quarter 2001Anthem, Inc. Reports Results for Third Quarter 2001
Anthem, Inc. Reports Results for Third Quarter 2001finance4
 
johnson & johnson 2008 Notice of Annual Meeting and Proxy Statement
johnson & johnson 2008 Notice of Annual Meeting and Proxy Statementjohnson & johnson 2008 Notice of Annual Meeting and Proxy Statement
johnson & johnson 2008 Notice of Annual Meeting and Proxy Statementfinance4
 
walgreen 2007 Annual Report
walgreen 2007 Annual Reportwalgreen 2007 Annual Report
walgreen 2007 Annual Reportfinance4
 
johnson & johnson View Presentation
johnson & johnson View Presentation johnson & johnson View Presentation
johnson & johnson View Presentation finance4
 
walgreen Audit Committee Charter
 walgreen Audit Committee Charter walgreen Audit Committee Charter
walgreen Audit Committee Charterfinance4
 
johnson & johnson 2007 Proxy Statement
johnson & johnson 2007 Proxy Statementjohnson & johnson 2007 Proxy Statement
johnson & johnson 2007 Proxy Statementfinance4
 

Destaque (18)

marathon oil 2nd Quarter 2005
marathon oil   	  2nd Quarter 2005 marathon oil   	  2nd Quarter 2005
marathon oil 2nd Quarter 2005
 
Anthem, Inc. Reports Stronger than Expected Third Quarter Earnings
Anthem, Inc. Reports Stronger than Expected Third Quarter EarningsAnthem, Inc. Reports Stronger than Expected Third Quarter Earnings
Anthem, Inc. Reports Stronger than Expected Third Quarter Earnings
 
marathon oil 3rd Quarter 2006
marathon oil  	  3rd Quarter 2006marathon oil  	  3rd Quarter 2006
marathon oil 3rd Quarter 2006
 
Anthem, Inc. Reports Strong Third Quarter Results
	Anthem, Inc. Reports Strong Third Quarter Results	Anthem, Inc. Reports Strong Third Quarter Results
Anthem, Inc. Reports Strong Third Quarter Results
 
johnson & johnson 2003 Annual Report
johnson & johnson 2003 Annual Reportjohnson & johnson 2003 Annual Report
johnson & johnson 2003 Annual Report
 
marathon oil 1st Quarter 2004
marathon oil   	  1st Quarter 2004marathon oil   	  1st Quarter 2004
marathon oil 1st Quarter 2004
 
marathon oil 4th Quarter 2002
marathon oil   	  4th Quarter 2002marathon oil   	  4th Quarter 2002
marathon oil 4th Quarter 2002
 
2Q06 GAAP Reconciliations
	2Q06 GAAP Reconciliations	2Q06 GAAP Reconciliations
2Q06 GAAP Reconciliations
 
Third Quarter 2002 Earnings Conference Call Transcript
Third Quarter 2002 Earnings Conference Call TranscriptThird Quarter 2002 Earnings Conference Call Transcript
Third Quarter 2002 Earnings Conference Call Transcript
 
united technologies 2003 Annual English
united technologies 2003 Annual Englishunited technologies 2003 Annual English
united technologies 2003 Annual English
 
marathon oil 2005 Annual Report
marathon oil 2005 Annual Reportmarathon oil 2005 Annual Report
marathon oil 2005 Annual Report
 
johnson & johnson Sales of Key Products Franchises Q4 2008
johnson & johnson Sales of Key Products Franchises Q4 2008johnson & johnson Sales of Key Products Franchises Q4 2008
johnson & johnson Sales of Key Products Franchises Q4 2008
 
Anthem, Inc. Reports Results for Third Quarter 2001
Anthem, Inc. Reports Results for Third Quarter 2001Anthem, Inc. Reports Results for Third Quarter 2001
Anthem, Inc. Reports Results for Third Quarter 2001
 
johnson & johnson 2008 Notice of Annual Meeting and Proxy Statement
johnson & johnson 2008 Notice of Annual Meeting and Proxy Statementjohnson & johnson 2008 Notice of Annual Meeting and Proxy Statement
johnson & johnson 2008 Notice of Annual Meeting and Proxy Statement
 
walgreen 2007 Annual Report
walgreen 2007 Annual Reportwalgreen 2007 Annual Report
walgreen 2007 Annual Report
 
johnson & johnson View Presentation
johnson & johnson View Presentation johnson & johnson View Presentation
johnson & johnson View Presentation
 
walgreen Audit Committee Charter
 walgreen Audit Committee Charter walgreen Audit Committee Charter
walgreen Audit Committee Charter
 
johnson & johnson 2007 Proxy Statement
johnson & johnson 2007 Proxy Statementjohnson & johnson 2007 Proxy Statement
johnson & johnson 2007 Proxy Statement
 

Semelhante a marathon oil 4th Quarter 2007

marathon oil 1st Quarter 2007
marathon oil  	  1st Quarter 2007marathon oil  	  1st Quarter 2007
marathon oil 1st Quarter 2007finance4
 
marathon oil 2nd Quarter 2007
marathon oil   2nd Quarter 2007marathon oil   2nd Quarter 2007
marathon oil 2nd Quarter 2007finance4
 
el paso 08_072QEarnings
el paso  08_072QEarningsel paso  08_072QEarnings
el paso 08_072QEarningsfinance49
 
marathon oil 2nd Quarter 2006
marathon oil  	  2nd Quarter 2006marathon oil  	  2nd Quarter 2006
marathon oil 2nd Quarter 2006finance4
 
marathon oil 1st Quarter 2006
marathon oil  	  1st Quarter 2006 marathon oil  	  1st Quarter 2006
marathon oil 1st Quarter 2006 finance4
 
bnsf 2Q 2007 Investors Report
bnsf 2Q 2007 Investors Reportbnsf 2Q 2007 Investors Report
bnsf 2Q 2007 Investors Reportfinance16
 
marathon oil 3rd Quarter 2005
marathon oil   	  3rd Quarter 2005marathon oil   	  3rd Quarter 2005
marathon oil 3rd Quarter 2005finance4
 
spectra energy 2Q_2007_SpectraEnergyEarnings
spectra energy 2Q_2007_SpectraEnergyEarningsspectra energy 2Q_2007_SpectraEnergyEarnings
spectra energy 2Q_2007_SpectraEnergyEarningsfinance49
 
GM_Earning Release_Q2_08_Chart Set
GM_Earning Release_Q2_08_Chart SetGM_Earning Release_Q2_08_Chart Set
GM_Earning Release_Q2_08_Chart SetManya Mohan
 
Services - GMAC Annual and Fourth Quarter Earnings
Services - GMAC Annual and Fourth Quarter Earnings Services - GMAC Annual and Fourth Quarter Earnings
Services - GMAC Annual and Fourth Quarter Earnings finance8
 
bnsf 3Q 2006 Investors Report
bnsf 3Q 2006 Investors Reportbnsf 3Q 2006 Investors Report
bnsf 3Q 2006 Investors Reportfinance16
 
4Q/06_Slides
4Q/06_Slides4Q/06_Slides
4Q/06_Slidesfinance21
 
marathon oil 4th Quarter 2005
marathon oil  	  4th Quarter 2005marathon oil  	  4th Quarter 2005
marathon oil 4th Quarter 2005finance4
 
Earning Presentation of General Motors: Q2 2008
Earning Presentation of General Motors: Q2 2008Earning Presentation of General Motors: Q2 2008
Earning Presentation of General Motors: Q2 2008investorrelation
 
marathon oil 1st Quarter 2008
marathon oil 1st Quarter 2008marathon oil 1st Quarter 2008
marathon oil 1st Quarter 2008finance4
 
fannie mae Investor Summary 2005
fannie mae Investor Summary 2005fannie mae Investor Summary 2005
fannie mae Investor Summary 2005finance6
 
Sanjiv Khattri, Executive Vice President and CFO of GMAC Financial Services 2...
Sanjiv Khattri, Executive Vice President and CFO of GMAC Financial Services 2...Sanjiv Khattri, Executive Vice President and CFO of GMAC Financial Services 2...
Sanjiv Khattri, Executive Vice President and CFO of GMAC Financial Services 2...finance8
 
Financial analysis 2006 ing
Financial analysis 2006 ingFinancial analysis 2006 ing
Financial analysis 2006 ingPetrobras
 
Financial analysis 2006 ing
Financial analysis 2006 ingFinancial analysis 2006 ing
Financial analysis 2006 ingPetrobras
 
raytheon Q4 Earnings Presentation
raytheon Q4 Earnings Presentationraytheon Q4 Earnings Presentation
raytheon Q4 Earnings Presentationfinance12
 

Semelhante a marathon oil 4th Quarter 2007 (20)

marathon oil 1st Quarter 2007
marathon oil  	  1st Quarter 2007marathon oil  	  1st Quarter 2007
marathon oil 1st Quarter 2007
 
marathon oil 2nd Quarter 2007
marathon oil   2nd Quarter 2007marathon oil   2nd Quarter 2007
marathon oil 2nd Quarter 2007
 
el paso 08_072QEarnings
el paso  08_072QEarningsel paso  08_072QEarnings
el paso 08_072QEarnings
 
marathon oil 2nd Quarter 2006
marathon oil  	  2nd Quarter 2006marathon oil  	  2nd Quarter 2006
marathon oil 2nd Quarter 2006
 
marathon oil 1st Quarter 2006
marathon oil  	  1st Quarter 2006 marathon oil  	  1st Quarter 2006
marathon oil 1st Quarter 2006
 
bnsf 2Q 2007 Investors Report
bnsf 2Q 2007 Investors Reportbnsf 2Q 2007 Investors Report
bnsf 2Q 2007 Investors Report
 
marathon oil 3rd Quarter 2005
marathon oil   	  3rd Quarter 2005marathon oil   	  3rd Quarter 2005
marathon oil 3rd Quarter 2005
 
spectra energy 2Q_2007_SpectraEnergyEarnings
spectra energy 2Q_2007_SpectraEnergyEarningsspectra energy 2Q_2007_SpectraEnergyEarnings
spectra energy 2Q_2007_SpectraEnergyEarnings
 
GM_Earning Release_Q2_08_Chart Set
GM_Earning Release_Q2_08_Chart SetGM_Earning Release_Q2_08_Chart Set
GM_Earning Release_Q2_08_Chart Set
 
Services - GMAC Annual and Fourth Quarter Earnings
Services - GMAC Annual and Fourth Quarter Earnings Services - GMAC Annual and Fourth Quarter Earnings
Services - GMAC Annual and Fourth Quarter Earnings
 
bnsf 3Q 2006 Investors Report
bnsf 3Q 2006 Investors Reportbnsf 3Q 2006 Investors Report
bnsf 3Q 2006 Investors Report
 
4Q/06_Slides
4Q/06_Slides4Q/06_Slides
4Q/06_Slides
 
marathon oil 4th Quarter 2005
marathon oil  	  4th Quarter 2005marathon oil  	  4th Quarter 2005
marathon oil 4th Quarter 2005
 
Earning Presentation of General Motors: Q2 2008
Earning Presentation of General Motors: Q2 2008Earning Presentation of General Motors: Q2 2008
Earning Presentation of General Motors: Q2 2008
 
marathon oil 1st Quarter 2008
marathon oil 1st Quarter 2008marathon oil 1st Quarter 2008
marathon oil 1st Quarter 2008
 
fannie mae Investor Summary 2005
fannie mae Investor Summary 2005fannie mae Investor Summary 2005
fannie mae Investor Summary 2005
 
Sanjiv Khattri, Executive Vice President and CFO of GMAC Financial Services 2...
Sanjiv Khattri, Executive Vice President and CFO of GMAC Financial Services 2...Sanjiv Khattri, Executive Vice President and CFO of GMAC Financial Services 2...
Sanjiv Khattri, Executive Vice President and CFO of GMAC Financial Services 2...
 
Financial analysis 2006 ing
Financial analysis 2006 ingFinancial analysis 2006 ing
Financial analysis 2006 ing
 
Financial analysis 2006 ing
Financial analysis 2006 ingFinancial analysis 2006 ing
Financial analysis 2006 ing
 
raytheon Q4 Earnings Presentation
raytheon Q4 Earnings Presentationraytheon Q4 Earnings Presentation
raytheon Q4 Earnings Presentation
 

Mais de finance4

walgreen Finance Committee Charter
 walgreen Finance Committee Charter walgreen Finance Committee Charter
walgreen Finance Committee Charterfinance4
 
walgreen Compensation Committee Charter
 walgreen Compensation Committee Charter walgreen Compensation Committee Charter
walgreen Compensation Committee Charterfinance4
 
walgreen Nominating and Governance Committee Charter
 walgreen Nominating and Governance Committee Charter   	 walgreen Nominating and Governance Committee Charter
walgreen Nominating and Governance Committee Charter finance4
 
walgreen Code of Ethics for Financial Executives
 walgreen Code of Ethics for Financial Executives walgreen Code of Ethics for Financial Executives
walgreen Code of Ethics for Financial Executivesfinance4
 
Ethics Policy Statement walgreen
Ethics Policy Statement walgreenEthics Policy Statement walgreen
Ethics Policy Statement walgreenfinance4
 
walgreen Corporate Governance Guidelines
walgreen Corporate Governance Guidelineswalgreen Corporate Governance Guidelines
walgreen Corporate Governance Guidelinesfinance4
 
walgreen Walgreen Co. First Quarter 2008 Earnings Conference
walgreen Walgreen Co. First Quarter 2008 Earnings Conference walgreen Walgreen Co. First Quarter 2008 Earnings Conference
walgreen Walgreen Co. First Quarter 2008 Earnings Conference finance4
 
walgreen Raymond James Institutional Investors Conference
walgreen Raymond James Institutional Investors Conference  walgreen Raymond James Institutional Investors Conference
walgreen Raymond James Institutional Investors Conference finance4
 
Walgreen Co. I-Trax and Whole Health Management
 Walgreen Co. I-Trax and Whole Health Management  Walgreen Co. I-Trax and Whole Health Management
Walgreen Co. I-Trax and Whole Health Management finance4
 
Walgreen Co. Second Quarter 2008 Earnings
Walgreen Co. Second Quarter 2008 Earnings Walgreen Co. Second Quarter 2008 Earnings
Walgreen Co. Second Quarter 2008 Earnings finance4
 
walgreen Lehman Brothers Eleventh Annual Retail and
walgreen Lehman Brothers Eleventh Annual Retail and walgreen Lehman Brothers Eleventh Annual Retail and
walgreen Lehman Brothers Eleventh Annual Retail and finance4
 
Bank of America 2008 Health Care Conference
Bank of America 2008 Health Care Conference  Bank of America 2008 Health Care Conference
Bank of America 2008 Health Care Conference finance4
 
Sanford C. Bernstein 24th Annual Strategic Decisions
Sanford C. Bernstein 24th Annual Strategic Decisions Sanford C. Bernstein 24th Annual Strategic Decisions
Sanford C. Bernstein 24th Annual Strategic Decisions finance4
 
Walgreen Co.Third Quarter 2008 Earnings Conference
Walgreen Co.Third Quarter 2008 Earnings ConferenceWalgreen Co.Third Quarter 2008 Earnings Conference
Walgreen Co.Third Quarter 2008 Earnings Conferencefinance4
 
Walgreen Co. Fourth Quarter 2008 Earnings
Walgreen Co. Fourth Quarter 2008 Earnings Walgreen Co. Fourth Quarter 2008 Earnings
Walgreen Co. Fourth Quarter 2008 Earnings finance4
 
Walgreen Co. 2008 Analyst Day
Walgreen Co. 2008 Analyst DayWalgreen Co. 2008 Analyst Day
Walgreen Co. 2008 Analyst Dayfinance4
 
Walgreen Co. First Quarter 2009 Earnings Conference
Walgreen Co. First Quarter 2009 Earnings Conference Walgreen Co. First Quarter 2009 Earnings Conference
Walgreen Co. First Quarter 2009 Earnings Conference finance4
 
Walgreens Creates New Health and Wellness Division as Part of Strategic Move ...
Walgreens Creates New Health and Wellness Division as Part of Strategic Move ...Walgreens Creates New Health and Wellness Division as Part of Strategic Move ...
Walgreens Creates New Health and Wellness Division as Part of Strategic Move ...finance4
 
walgreen 2004 10-K/A
walgreen  2004 10-K/Awalgreen  2004 10-K/A
walgreen 2004 10-K/Afinance4
 
walgreen 2004 Proxy Statement
walgreen 2004 Proxy Statement walgreen 2004 Proxy Statement
walgreen 2004 Proxy Statement finance4
 

Mais de finance4 (20)

walgreen Finance Committee Charter
 walgreen Finance Committee Charter walgreen Finance Committee Charter
walgreen Finance Committee Charter
 
walgreen Compensation Committee Charter
 walgreen Compensation Committee Charter walgreen Compensation Committee Charter
walgreen Compensation Committee Charter
 
walgreen Nominating and Governance Committee Charter
 walgreen Nominating and Governance Committee Charter   	 walgreen Nominating and Governance Committee Charter
walgreen Nominating and Governance Committee Charter
 
walgreen Code of Ethics for Financial Executives
 walgreen Code of Ethics for Financial Executives walgreen Code of Ethics for Financial Executives
walgreen Code of Ethics for Financial Executives
 
Ethics Policy Statement walgreen
Ethics Policy Statement walgreenEthics Policy Statement walgreen
Ethics Policy Statement walgreen
 
walgreen Corporate Governance Guidelines
walgreen Corporate Governance Guidelineswalgreen Corporate Governance Guidelines
walgreen Corporate Governance Guidelines
 
walgreen Walgreen Co. First Quarter 2008 Earnings Conference
walgreen Walgreen Co. First Quarter 2008 Earnings Conference walgreen Walgreen Co. First Quarter 2008 Earnings Conference
walgreen Walgreen Co. First Quarter 2008 Earnings Conference
 
walgreen Raymond James Institutional Investors Conference
walgreen Raymond James Institutional Investors Conference  walgreen Raymond James Institutional Investors Conference
walgreen Raymond James Institutional Investors Conference
 
Walgreen Co. I-Trax and Whole Health Management
 Walgreen Co. I-Trax and Whole Health Management  Walgreen Co. I-Trax and Whole Health Management
Walgreen Co. I-Trax and Whole Health Management
 
Walgreen Co. Second Quarter 2008 Earnings
Walgreen Co. Second Quarter 2008 Earnings Walgreen Co. Second Quarter 2008 Earnings
Walgreen Co. Second Quarter 2008 Earnings
 
walgreen Lehman Brothers Eleventh Annual Retail and
walgreen Lehman Brothers Eleventh Annual Retail and walgreen Lehman Brothers Eleventh Annual Retail and
walgreen Lehman Brothers Eleventh Annual Retail and
 
Bank of America 2008 Health Care Conference
Bank of America 2008 Health Care Conference  Bank of America 2008 Health Care Conference
Bank of America 2008 Health Care Conference
 
Sanford C. Bernstein 24th Annual Strategic Decisions
Sanford C. Bernstein 24th Annual Strategic Decisions Sanford C. Bernstein 24th Annual Strategic Decisions
Sanford C. Bernstein 24th Annual Strategic Decisions
 
Walgreen Co.Third Quarter 2008 Earnings Conference
Walgreen Co.Third Quarter 2008 Earnings ConferenceWalgreen Co.Third Quarter 2008 Earnings Conference
Walgreen Co.Third Quarter 2008 Earnings Conference
 
Walgreen Co. Fourth Quarter 2008 Earnings
Walgreen Co. Fourth Quarter 2008 Earnings Walgreen Co. Fourth Quarter 2008 Earnings
Walgreen Co. Fourth Quarter 2008 Earnings
 
Walgreen Co. 2008 Analyst Day
Walgreen Co. 2008 Analyst DayWalgreen Co. 2008 Analyst Day
Walgreen Co. 2008 Analyst Day
 
Walgreen Co. First Quarter 2009 Earnings Conference
Walgreen Co. First Quarter 2009 Earnings Conference Walgreen Co. First Quarter 2009 Earnings Conference
Walgreen Co. First Quarter 2009 Earnings Conference
 
Walgreens Creates New Health and Wellness Division as Part of Strategic Move ...
Walgreens Creates New Health and Wellness Division as Part of Strategic Move ...Walgreens Creates New Health and Wellness Division as Part of Strategic Move ...
Walgreens Creates New Health and Wellness Division as Part of Strategic Move ...
 
walgreen 2004 10-K/A
walgreen  2004 10-K/Awalgreen  2004 10-K/A
walgreen 2004 10-K/A
 
walgreen 2004 Proxy Statement
walgreen 2004 Proxy Statement walgreen 2004 Proxy Statement
walgreen 2004 Proxy Statement
 

Último

Booking open Available Pune Call Girls Wadgaon Sheri 6297143586 Call Hot Ind...
Booking open Available Pune Call Girls Wadgaon Sheri  6297143586 Call Hot Ind...Booking open Available Pune Call Girls Wadgaon Sheri  6297143586 Call Hot Ind...
Booking open Available Pune Call Girls Wadgaon Sheri 6297143586 Call Hot Ind...Call Girls in Nagpur High Profile
 
Basic concepts related to Financial modelling
Basic concepts related to Financial modellingBasic concepts related to Financial modelling
Basic concepts related to Financial modellingbaijup5
 
03_Emmanuel Ndiaye_Degroof Petercam.pptx
03_Emmanuel Ndiaye_Degroof Petercam.pptx03_Emmanuel Ndiaye_Degroof Petercam.pptx
03_Emmanuel Ndiaye_Degroof Petercam.pptxFinTech Belgium
 
Stock Market Brief Deck (Under Pressure).pdf
Stock Market Brief Deck (Under Pressure).pdfStock Market Brief Deck (Under Pressure).pdf
Stock Market Brief Deck (Under Pressure).pdfMichael Silva
 
02_Fabio Colombo_Accenture_MeetupDora&Cybersecurity.pptx
02_Fabio Colombo_Accenture_MeetupDora&Cybersecurity.pptx02_Fabio Colombo_Accenture_MeetupDora&Cybersecurity.pptx
02_Fabio Colombo_Accenture_MeetupDora&Cybersecurity.pptxFinTech Belgium
 
Top Rated Pune Call Girls Viman Nagar ⟟ 6297143586 ⟟ Call Me For Genuine Sex...
Top Rated  Pune Call Girls Viman Nagar ⟟ 6297143586 ⟟ Call Me For Genuine Sex...Top Rated  Pune Call Girls Viman Nagar ⟟ 6297143586 ⟟ Call Me For Genuine Sex...
Top Rated Pune Call Girls Viman Nagar ⟟ 6297143586 ⟟ Call Me For Genuine Sex...Call Girls in Nagpur High Profile
 
CALL ON ➥8923113531 🔝Call Girls Gomti Nagar Lucknow best sexual service
CALL ON ➥8923113531 🔝Call Girls Gomti Nagar Lucknow best sexual serviceCALL ON ➥8923113531 🔝Call Girls Gomti Nagar Lucknow best sexual service
CALL ON ➥8923113531 🔝Call Girls Gomti Nagar Lucknow best sexual serviceanilsa9823
 
Call US 📞 9892124323 ✅ Kurla Call Girls In Kurla ( Mumbai ) secure service
Call US 📞 9892124323 ✅ Kurla Call Girls In Kurla ( Mumbai ) secure serviceCall US 📞 9892124323 ✅ Kurla Call Girls In Kurla ( Mumbai ) secure service
Call US 📞 9892124323 ✅ Kurla Call Girls In Kurla ( Mumbai ) secure servicePooja Nehwal
 
Solution Manual for Financial Accounting, 11th Edition by Robert Libby, Patri...
Solution Manual for Financial Accounting, 11th Edition by Robert Libby, Patri...Solution Manual for Financial Accounting, 11th Edition by Robert Libby, Patri...
Solution Manual for Financial Accounting, 11th Edition by Robert Libby, Patri...ssifa0344
 
High Class Call Girls Nashik Maya 7001305949 Independent Escort Service Nashik
High Class Call Girls Nashik Maya 7001305949 Independent Escort Service NashikHigh Class Call Girls Nashik Maya 7001305949 Independent Escort Service Nashik
High Class Call Girls Nashik Maya 7001305949 Independent Escort Service NashikCall Girls in Nagpur High Profile
 
Independent Call Girl Number in Kurla Mumbai📲 Pooja Nehwal 9892124323 💞 Full ...
Independent Call Girl Number in Kurla Mumbai📲 Pooja Nehwal 9892124323 💞 Full ...Independent Call Girl Number in Kurla Mumbai📲 Pooja Nehwal 9892124323 💞 Full ...
Independent Call Girl Number in Kurla Mumbai📲 Pooja Nehwal 9892124323 💞 Full ...Pooja Nehwal
 
Pooja 9892124323 : Call Girl in Juhu Escorts Service Free Home Delivery
Pooja 9892124323 : Call Girl in Juhu Escorts Service Free Home DeliveryPooja 9892124323 : Call Girl in Juhu Escorts Service Free Home Delivery
Pooja 9892124323 : Call Girl in Juhu Escorts Service Free Home DeliveryPooja Nehwal
 
The Economic History of the U.S. Lecture 26.pdf
The Economic History of the U.S. Lecture 26.pdfThe Economic History of the U.S. Lecture 26.pdf
The Economic History of the U.S. Lecture 26.pdfGale Pooley
 
(ANIKA) Budhwar Peth Call Girls Just Call 7001035870 [ Cash on Delivery ] Pun...
(ANIKA) Budhwar Peth Call Girls Just Call 7001035870 [ Cash on Delivery ] Pun...(ANIKA) Budhwar Peth Call Girls Just Call 7001035870 [ Cash on Delivery ] Pun...
(ANIKA) Budhwar Peth Call Girls Just Call 7001035870 [ Cash on Delivery ] Pun...ranjana rawat
 
Call Girls Koregaon Park Call Me 7737669865 Budget Friendly No Advance Booking
Call Girls Koregaon Park Call Me 7737669865 Budget Friendly No Advance BookingCall Girls Koregaon Park Call Me 7737669865 Budget Friendly No Advance Booking
Call Girls Koregaon Park Call Me 7737669865 Budget Friendly No Advance Bookingroncy bisnoi
 

Último (20)

Booking open Available Pune Call Girls Wadgaon Sheri 6297143586 Call Hot Ind...
Booking open Available Pune Call Girls Wadgaon Sheri  6297143586 Call Hot Ind...Booking open Available Pune Call Girls Wadgaon Sheri  6297143586 Call Hot Ind...
Booking open Available Pune Call Girls Wadgaon Sheri 6297143586 Call Hot Ind...
 
Basic concepts related to Financial modelling
Basic concepts related to Financial modellingBasic concepts related to Financial modelling
Basic concepts related to Financial modelling
 
03_Emmanuel Ndiaye_Degroof Petercam.pptx
03_Emmanuel Ndiaye_Degroof Petercam.pptx03_Emmanuel Ndiaye_Degroof Petercam.pptx
03_Emmanuel Ndiaye_Degroof Petercam.pptx
 
(INDIRA) Call Girl Mumbai Call Now 8250077686 Mumbai Escorts 24x7
(INDIRA) Call Girl Mumbai Call Now 8250077686 Mumbai Escorts 24x7(INDIRA) Call Girl Mumbai Call Now 8250077686 Mumbai Escorts 24x7
(INDIRA) Call Girl Mumbai Call Now 8250077686 Mumbai Escorts 24x7
 
Stock Market Brief Deck (Under Pressure).pdf
Stock Market Brief Deck (Under Pressure).pdfStock Market Brief Deck (Under Pressure).pdf
Stock Market Brief Deck (Under Pressure).pdf
 
02_Fabio Colombo_Accenture_MeetupDora&Cybersecurity.pptx
02_Fabio Colombo_Accenture_MeetupDora&Cybersecurity.pptx02_Fabio Colombo_Accenture_MeetupDora&Cybersecurity.pptx
02_Fabio Colombo_Accenture_MeetupDora&Cybersecurity.pptx
 
Top Rated Pune Call Girls Viman Nagar ⟟ 6297143586 ⟟ Call Me For Genuine Sex...
Top Rated  Pune Call Girls Viman Nagar ⟟ 6297143586 ⟟ Call Me For Genuine Sex...Top Rated  Pune Call Girls Viman Nagar ⟟ 6297143586 ⟟ Call Me For Genuine Sex...
Top Rated Pune Call Girls Viman Nagar ⟟ 6297143586 ⟟ Call Me For Genuine Sex...
 
CALL ON ➥8923113531 🔝Call Girls Gomti Nagar Lucknow best sexual service
CALL ON ➥8923113531 🔝Call Girls Gomti Nagar Lucknow best sexual serviceCALL ON ➥8923113531 🔝Call Girls Gomti Nagar Lucknow best sexual service
CALL ON ➥8923113531 🔝Call Girls Gomti Nagar Lucknow best sexual service
 
(Vedika) Low Rate Call Girls in Pune Call Now 8250077686 Pune Escorts 24x7
(Vedika) Low Rate Call Girls in Pune Call Now 8250077686 Pune Escorts 24x7(Vedika) Low Rate Call Girls in Pune Call Now 8250077686 Pune Escorts 24x7
(Vedika) Low Rate Call Girls in Pune Call Now 8250077686 Pune Escorts 24x7
 
Call US 📞 9892124323 ✅ Kurla Call Girls In Kurla ( Mumbai ) secure service
Call US 📞 9892124323 ✅ Kurla Call Girls In Kurla ( Mumbai ) secure serviceCall US 📞 9892124323 ✅ Kurla Call Girls In Kurla ( Mumbai ) secure service
Call US 📞 9892124323 ✅ Kurla Call Girls In Kurla ( Mumbai ) secure service
 
Solution Manual for Financial Accounting, 11th Edition by Robert Libby, Patri...
Solution Manual for Financial Accounting, 11th Edition by Robert Libby, Patri...Solution Manual for Financial Accounting, 11th Edition by Robert Libby, Patri...
Solution Manual for Financial Accounting, 11th Edition by Robert Libby, Patri...
 
High Class Call Girls Nashik Maya 7001305949 Independent Escort Service Nashik
High Class Call Girls Nashik Maya 7001305949 Independent Escort Service NashikHigh Class Call Girls Nashik Maya 7001305949 Independent Escort Service Nashik
High Class Call Girls Nashik Maya 7001305949 Independent Escort Service Nashik
 
Independent Call Girl Number in Kurla Mumbai📲 Pooja Nehwal 9892124323 💞 Full ...
Independent Call Girl Number in Kurla Mumbai📲 Pooja Nehwal 9892124323 💞 Full ...Independent Call Girl Number in Kurla Mumbai📲 Pooja Nehwal 9892124323 💞 Full ...
Independent Call Girl Number in Kurla Mumbai📲 Pooja Nehwal 9892124323 💞 Full ...
 
Pooja 9892124323 : Call Girl in Juhu Escorts Service Free Home Delivery
Pooja 9892124323 : Call Girl in Juhu Escorts Service Free Home DeliveryPooja 9892124323 : Call Girl in Juhu Escorts Service Free Home Delivery
Pooja 9892124323 : Call Girl in Juhu Escorts Service Free Home Delivery
 
The Economic History of the U.S. Lecture 26.pdf
The Economic History of the U.S. Lecture 26.pdfThe Economic History of the U.S. Lecture 26.pdf
The Economic History of the U.S. Lecture 26.pdf
 
VIP Call Girl Service Andheri West ⚡ 9920725232 What It Takes To Be The Best ...
VIP Call Girl Service Andheri West ⚡ 9920725232 What It Takes To Be The Best ...VIP Call Girl Service Andheri West ⚡ 9920725232 What It Takes To Be The Best ...
VIP Call Girl Service Andheri West ⚡ 9920725232 What It Takes To Be The Best ...
 
(ANIKA) Budhwar Peth Call Girls Just Call 7001035870 [ Cash on Delivery ] Pun...
(ANIKA) Budhwar Peth Call Girls Just Call 7001035870 [ Cash on Delivery ] Pun...(ANIKA) Budhwar Peth Call Girls Just Call 7001035870 [ Cash on Delivery ] Pun...
(ANIKA) Budhwar Peth Call Girls Just Call 7001035870 [ Cash on Delivery ] Pun...
 
Call Girls Koregaon Park Call Me 7737669865 Budget Friendly No Advance Booking
Call Girls Koregaon Park Call Me 7737669865 Budget Friendly No Advance BookingCall Girls Koregaon Park Call Me 7737669865 Budget Friendly No Advance Booking
Call Girls Koregaon Park Call Me 7737669865 Budget Friendly No Advance Booking
 
VIP Independent Call Girls in Andheri 🌹 9920725232 ( Call Me ) Mumbai Escorts...
VIP Independent Call Girls in Andheri 🌹 9920725232 ( Call Me ) Mumbai Escorts...VIP Independent Call Girls in Andheri 🌹 9920725232 ( Call Me ) Mumbai Escorts...
VIP Independent Call Girls in Andheri 🌹 9920725232 ( Call Me ) Mumbai Escorts...
 
Veritas Interim Report 1 January–31 March 2024
Veritas Interim Report 1 January–31 March 2024Veritas Interim Report 1 January–31 March 2024
Veritas Interim Report 1 January–31 March 2024
 

marathon oil 4th Quarter 2007

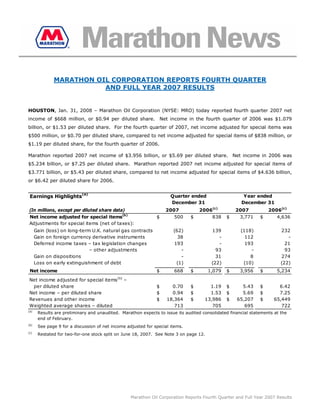
  • 1. MARATHON OIL CORPORATION REPORTS FOURTH QUARTER AND FULL YEAR 2007 RESULTS HOUSTON, Jan. 31, 2008 – Marathon Oil Corporation (NYSE: MRO) today reported fourth quarter 2007 net income of $668 million, or $0.94 per diluted share. Net income in the fourth quarter of 2006 was $1.079 billion, or $1.53 per diluted share. For the fourth quarter of 2007, net income adjusted for special items was $500 million, or $0.70 per diluted share, compared to net income adjusted for special items of $838 million, or $1.19 per diluted share, for the fourth quarter of 2006. Marathon reported 2007 net income of $3.956 billion, or $5.69 per diluted share. Net income in 2006 was $5.234 billion, or $7.25 per diluted share. Marathon reported 2007 net income adjusted for special items of $3.771 billion, or $5.43 per diluted share, compared to net income adjusted for special items of $4.636 billion, or $6.42 per diluted share for 2006. (a) Quarter ended Year ended Earnings Highlights December 31 December 31 2006(c) 2006(c) (In millions, except per diluted share data) 2007 2007 Net income adjusted for special items(b) $ 500 $ 838 $ 3,771 $ 4,636 Adjustments for special items (net of taxes): Gain (loss) on long-term U.K. natural gas contracts (62) 139 (118) 232 Gain on foreign currency derivative instruments 38 - 112 - Deferred income taxes – tax legislation changes 193 - 193 21 – other adjustments - 93 - 93 Gain on dispositions - 31 8 274 Loss on early extinguishment of debt (1) (22) (10) (22) Net income $ 668 $ 1,079 $ 3,956 $ 5,234 (b) Net income adjusted for special items – per diluted share $ 0.70 $ 1.19 $ 5.43 $ 6.42 Net income – per diluted share $ 0.94 $ 1.53 $ 5.69 $ 7.25 Revenues and other income $ 18,364 $ 13,986 $ 65,207 $ 65,449 Weighted average shares – diluted 713 705 695 722 (a) Results are preliminary and unaudited. Marathon expects to issue its audited consolidated financial statements at the end of February. (b) See page 9 for a discussion of net income adjusted for special items. (c) Restated for two-for-one stock split on June 18, 2007. See Note 3 on page 12. Marathon Oil Corporation Reports Fourth Quarter and Full Year 2007 Results
  • 2. Full Year Key Highlights • Closed $6.9 billion Western Oil Sands Inc. acquisition • Completed Equatorial Guinea Liquefied Natural Gas (EG LNG) Train 1 on budget and ahead of schedule • Discovered Droshky field (100 percent working interest) in Gulf of Mexico • Announced eight exploration discoveries in deepwater Angola • Was high bidder on 27 blocks at Central Gulf of Mexico Lease Sale No. 205 • Began construction on projected $3.2 billion Garyville, La. refinery expansion • Approved projected $1.9 billion Detroit refinery heavy oil upgrading and expansion project • Achieved record full-year refinery crude oil and total throughputs • Raised quarterly dividend rate 20 percent • Repurchased approximately 16 million shares, extended stock repurchase authorization to $5 billion • Completed two-for-one common stock split “The fourth quarter of 2007 was a difficult quarter that included: lower downstream margins driven primarily by rapidly rising crude prices; relatively flat upstream production due to delays in the Alvheim project and unscheduled downtime for warranty repairs at our Equatorial Guinea LNG production facility; unscheduled downtime at our Athabasca Oil Sands Project in Canada; and higher exploration costs,” said Clarence P. Cazalot, Jr., Marathon president and CEO. “However, reflecting on all of 2007, we had significant accomplishments in each of our business segments; and, we remain confident in Marathon’s integrated business strategy. Last year included the acquisition of Western Oil Sands Inc., the completion of the EG LNG Train 1 production facility ahead of schedule and on budget and groundbreaking on our projected $3.2 billion refinery expansion in Garyville, La. We also continued to achieve significant exploration success in Angola and the Gulf of Mexico, and we anticipate sanctioning major projects in both those areas during 2008. “We expect 2008 will show significant growth as Marathon is uniquely positioned with a broad portfolio of projects,” Cazalot added. “Marathon continues to maintain financial discipline while delivering value to investors through multiple reinvestment opportunities, dividends and share repurchases.” Western Oil Sands Inc. Acquisition On Oct. 18, 2007, Marathon purchased Western Oil Sands Inc. (Western) for cash and securities of $5.8 billion and outstanding debt of $1.1 billion at closing, for a total transaction value of $6.9 billion. The acquisition included a 20 percent interest in the outside-operated Athabasca Oil Sands Project (AOSP), which includes the Muskeg River mine and the Scotford upgrader. The acquisition was accounted for under the purchase method of accounting and, as such, Marathon’s results of operations include Western’s results from the date of closing. The newly acquired oil sands mining operations have been reported in a separate Oil Sands Mining segment. Also included in this acquisition were heavy oil resources which may be recovered using in-situ Marathon Oil Corporation Reports Fourth Quarter and Full Year 2007 Financial Results page 2
  • 3. recovery techniques. Activities related to these resources have been reported in the Exploration and Production segment. Segment Results Total segment income was $455 million in the fourth quarter of 2007 and $3.875 billion for the full year 2007 compared with $833 million and $4.814 billion in the same periods of 2006. Quarter ended Y ear ended December 31 December 31 (In millions) 2007 2006 2007 2006 Segment Income (Loss) Exploration and Production 153 167 623 873 United States $ $ $ $ 312 140 1,106 1,130 International 465 307 1,729 2,003 Total E&P (63) - (63) - Oil Sands Mining 4 533 2,077 2,795 Refining, Marketing and Transportation 49 (7) 132 16 Integrated Gas 455 833 3,875 4,814 $ $ $ $ Segment Income(a) (a) See Preliminary Supplemental Statistics on page 13 for a reconciliation of segment income to net income as reported under generally accepted accounting principles. Exploration and Production Upstream segment income totaled $465 million in the fourth quarter of 2007, compared to $307 million in the fourth quarter of 2006, primarily as a result of higher liquid hydrocarbon realizations which were partially offset by lower liquid hydrocarbon sales volumes and increased exploration expenses. For the year, upstream segment income was $1.729 billion, compared to $2.003 billion for 2006, primarily as a result of lower liquid hydrocarbon sales volumes and natural gas realizations and increased exploration expenses, partially offset by higher liquid hydrocarbon realizations and natural gas sales volumes. Sales volumes averaged 354,000 barrels of oil equivalent per day (boepd) for the fourth quarter of 2007 and 351,000 boepd for the full year 2007, and production available for sale averaged 352,000 boepd and 353,000 boepd in the same periods. United States upstream income was $153 million in the fourth quarter of 2007 and $623 million for the year, compared to $167 million and $873 million in the same periods of 2006. Contributing to the decreases for both periods were increased exploration expenses and lower liquid hydrocarbon and natural gas sales volumes, partially offset by higher liquid hydrocarbon realizations. The largest sales volume declines in both periods were associated with expected production declines for Gulf of Mexico and Permian Basin properties. Exploration expenses increased $77 million in the fourth quarter of 2007 and $105 million for the year compared to the same periods of 2006, primarily as a result of expensing non-commercial wells on the Flathead prospect in the Gulf of Mexico in the fourth quarter of 2007. International upstream income was $312 million in the fourth quarter of 2007 compared to $140 million in the same period of 2006, primarily due to higher liquid hydrocarbon realizations. International upstream income was $1.106 billion for the year, compared to $1.130 billion in 2006, primarily as a result of lower liquid hydrocarbon sales volumes and natural gas realizations, partially offset by higher liquid hydrocarbon Marathon Oil Corporation Reports Fourth Quarter and Full Year 2007 Financial Results page 3
  • 4. realizations and natural gas sales volumes. The increase in Equatorial Guinea natural gas sales volumes due to the start-up of the EG LNG Train 1 production facility in the second quarter of 2007 contributed to the decline in the average realized natural gas price for the fourth quarter and full year 2007. Q uarter ended Y ear ended December 3 1 December 3 1 2007 2006 2007 2006 Key Production S tatistics Net S ales Unite d Sta te s – Liq uid s (mb p d ) 60 74 64 76 Unite d Sta te s – Na tura l Ga s (mmcfp d ) 474 522 477 532 Inte rna tio na l – Liq uid s (mb p d ) 130 138 133 147 Inte rna tio na l – Na tura l Ga s (mmcfp d ) 510 352 448 315 Net S ales from Continuing O perations (mboepd) 354 357 351 365 Dis co ntinue d O p e ra tio ns (mb o e p d ) - - - 12 Total Net S ales (mboepd) 354 357 351 377 During 2007, Marathon added net proved liquid hydrocarbon and natural gas reserves of 88 million barrels of oil equivalent (mmboe), while producing 125 mmboe, resulting in a reserve replacement ratio of 70 percent. For the three-year period ended Dec. 31, 2007, Marathon added net proved liquid hydrocarbon and natural gas reserves of 516 mmboe, excluding dispositions of 46 mmboe, while producing 383 mmboe, resulting in an average reserve replacement ratio of 135 percent. (The proven bitumen reserves at the AOSP are not included in Marathon’s estimated net proved liquid hydrocarbon and natural gas reserves, but rather are reported separately in the Oil Sands Mining segment.) First production from the Alvheim/Vilje development in Norway is expected at the end of the first quarter of 2008, weather permitting. The peak net rate of approximately 75,000 boepd is expected to be achieved in 2008. The Volund development continues to make progress towards first production in the second half of 2009 and will be tied back to the Alvheim infrastructure. Marathon has a 65 percent interest in Alvheim and Volund and a 47 percent interest in Vilje. In the Gulf of Mexico, development of Neptune continues to progress. First oil is expected by the end of the first quarter of 2008. Marathon has a 30 percent interest in Neptune. Marathon is currently drilling an appraisal well on the Droshky discovery in the Gulf of Mexico. The Company has secured an additional year of rig capacity in 2009 for development drilling in anticipation of a 2008 project sanction. The timing of initial production will be dependent upon delivery of key equipment and regulatory approvals, but could be as early as 2010. Marathon holds a 100 percent working interest in the Droshky prospect. Also in the Gulf of Mexico, Marathon was high bidder on 27 blocks at the Minerals Management Service’s Central Gulf of Mexico Lease Sale No. 205 in October 2007. These high bids total almost $222 million net to Marathon. During the fourth quarter of 2007, Marathon also completed the acquisition of more than 70,000 net leasehold acres in the Bakken Shale play in North Dakota. The acreage brings Marathon’s total Bakken Shale leasehold Marathon Oil Corporation Reports Fourth Quarter and Full Year 2007 Financial Results page 4
  • 5. to more than 320,000 net acres. Marathon currently has six rigs running in its Bakken program and ended 2007 with a net production rate of 2,600 boepd. The Company commenced its Piceance Basin activity in western Colorado and currently has two rigs running. Marathon expects to drill approximately 165 total wells in the region over the next two years. Marathon continues to grow an inventory of future growth opportunities with eight discoveries announced during 2007 in deepwater Angola. Announced in the fourth quarter, the Alho discovery was the 11th discovery on Angola Block 32 and the 26th overall discovery in Marathon's deepwater exploration program on Angola Blocks 31 and 32. In addition, Marathon has been awarded two study agreements in Indonesia and farmed into additional study agreements, which could lead to the acquisition of new leaseholds at a future lease sale. The Company also signed a cooperation agreement with Naftogaz Ukrainy to study the potential of the Dnieper-Donets Basin in the Ukraine. Marathon exited its remaining 10 percent interest in the Ash Shaer and Cherrife natural gas fields in Syria during the fourth quarter of 2007. With the Alvheim/Vilje and Neptune developments coming online, Marathon expects 2008 production available for sale to increase to a range of between 380 and 420 boepd. (This production guidance does not include bitumen production from the AOSP, which will be reported in the Oil Sands Mining segment.) Despite the challenges encountered with major project delivery in this volatile environment, the Company continues to be on track to deliver compound average annual production growth of 6 to 9 percent from 2006 to 2010. Oil Sands Mining The Oil Sands Mining segment reported a loss of $63 million for the fourth quarter of 2007, which includes a $39 million after-tax unrealized loss on derivative instruments held by Western at the acquisition date intended to mitigate price risk related to future sales of synthetic crude oil. Segment income was also impacted during the fourth quarter due to a mid-November fire and subsequent curtailment of operations at the Scotford upgrader, which upgrades the mined bitumen to synthetic crude oil. Maintenance work scheduled for the first quarter of 2008 was accelerated and the Scotford upgrader returned to operation in late December. Q uarter ended Y ear ended December 31 December 31 2007 2006 2007 2006 Key O il Sands Mining Statistics Net Bitume n Production (mbpd)(a) 15 - 4 - Net Synthetic Crude Oil Sales (mbpd)(a) 17 - 4 - Synthe tic Crude Oil Ave ra ge Re alization (per bbl)(b) $ 71.07 - 71.07 - $ $ $ (a) The oil sands mining operations were acquired Oct. 18, 2007. Average daily volumes represent total volumes since the acquisition date over total days in the reporting period. (b) Excludes losses on derivative instruments. Marathon estimates that its net bitumen production in 2008 will be approximately 30 mboepd. Marathon estimates its net share of the AOSP’s proven bitumen reserves to be 421 million barrels of bitumen. Marathon Oil Corporation Reports Fourth Quarter and Full Year 2007 Financial Results page 5
  • 6. Marathon reached a $155 million settlement during the fourth quarter of 2007 to resolve certain insurance claims by Western dating back to the startup of the mine. The settlement had no impact on segment income for the fourth quarter of 2007. The AOSP Phase 1 Expansion is currently under construction and it is anticipated that the expansion will be complete in late 2010. The expansion includes construction of mining and extraction facilities at the Jackpine mine; expansion of treatment facilities at the existing Muskeg River mine; expansion of the Scotford upgrader; and development of related infrastructure. Refining, Marketing and Transportation Downstream segment income was $4 million in the fourth quarter of 2007 and $2.077 billion for the year, compared to $533 million and $2.795 billion in the same periods of 2006, with the decrease in both periods primarily a result of lower refining and wholesale marketing gross margins. The refining and wholesale marketing gross margin per gallon was 4.80 cents in the fourth quarter of 2007, compared to 17.07 cents in the fourth quarter of 2006, and 18.48 cents for 2007, compared to 22.88 cents for 2006. While the relevant market indicators [Light Louisiana Sweet (LLS) 6-3-2-1 crack spreads] in the Midwest (Chicago) and Gulf Coast markets were weaker in the fourth quarter of 2007 compared to the fourth quarter of 2006, the decline in Marathon’s refining and wholesale marketing gross margin was greater than that of the market indicators as the Company’s wholesale price realizations in the fourth quarter of 2007 did not increase over the comparable prior-year period as much as the average spot market prices used in the market indicators. In addition, the Company’s crude oil costs increased substantially more than the quarter-to- quarter change in average LLS prices would indicate, primarily due to the shift in market structure from a contango market in the fourth quarter of 2006 to a backwardated market in the fourth quarter of 2007. Though the relevant market indicators for the full year 2007 were stronger than in 2006, Marathon’s refining and wholesale marketing gross margin declined for that period primarily due to the significant and rapid increase in crude oil prices during the year and lagging wholesale price realizations as discussed. The refining and wholesale marketing gross margins for both the fourth quarter and full year 2007 were further reduced by higher manufacturing costs related to planned maintenance at several refineries. In addition to the lower refining and wholesale marketing gross margins, segment income was impacted by higher operating and administrative expenses in both periods. Marathon’s refining and wholesale marketing gross margins included pre-tax derivatives losses of $427 million for the fourth quarter and $899 million for the full year 2007, compared to pre-tax derivative gains of $194 million and $400 million in the same periods of 2006. The derivative changes reflect both the realized effects of closed derivative positions as well as unrealized effects as a result of marking open derivative positions to market. Most derivatives have an underlying physical commodity transaction; however, the income effect related to the derivatives and the income effect related to the underlying physical transactions may not necessarily be recognized in net income in the same period. Crude oil refined during the fourth quarter of 2007 averaged 956,000 barrels per day (bpd), which is consistent with the throughput achieved in the fourth quarter of 2006. Total refinery inputs were lower in the fourth quarter of 2007 compared to the fourth quarter of 2006, primarily due to the higher level of planned maintenance completed on the fluid catalytic cracking units at three of the Company’s refineries during the Marathon Oil Corporation Reports Fourth Quarter and Full Year 2007 Financial Results page 6
  • 7. fourth quarter of 2007. Crude oil refined for the full year 2007 averaged a record 1,010,000 bpd, 30,000 bpd higher than 2006. Total refinery throughputs also averaged a record 1,224,000 bpd for the full year 2007. . Q uarter ended Y ear ended December 3 1 December 3 1 2007 2006 2007 2006 Key Refining, Marketing & Transportation S tatistics C rud e O il Re fine d (mb p d ) 956 952 1,010 980 O the r C ha rg e a nd Ble nd Sto cks (mb p d ) 223 260 214 234 Total Refinery Inputs (mbpd) 1,179 1,212 1,224 1,214 Refined Products S ales Volumes (mbpd) 1,432 1,389 1,410 1,425 Refining and W holesale Marketing Gross Margin ($ /gallon) $0.0480 $0.1707 $0.1848 $0.2288 Speedway SuperAmerica LLC (SSA) gasoline and distillate gross margin per gallon averaged 11.31 cents during the fourth quarter of 2007, up nearly 1 percent from the 11.21 cents realized in the fourth quarter of 2006, and averaged 11.19 cents for the full year 2007, down 3 percent from the 11.56 cents realized in 2006. SSA’s same store merchandise sales increased 1.1 percent during the fourth quarter and 3.2 percent for the full year 2007. In the fourth quarter of 2007, Marathon’s Board of Directors approved a projected $1.9 billion heavy oil upgrading and expansion project at the Company's Detroit refinery. Construction is expected to begin in early 2008, subject to obtaining the necessary permits from applicable regulatory agencies. Construction continues to progress on the projected $3.2 billion Garyville refinery expansion project which will increase the refinery’s capacity by 180,000 bpd. When completed in late 2009, this expansion will enable the refinery to provide an additional 7.5 million gallons of clean transportation fuels to the market each day. Integrated Gas Integrated Gas segment income totaled $49 million in the fourth quarter of 2007 and $132 million for the full year 2007, compared to a loss of $7 million and income of $16 million in the comparable periods of 2006. During 2007, construction of the EG LNG Train 1 production facility was completed ahead of schedule and on budget. The increases in segment income over the comparable prior-year periods were largely due to the fact that this facility, in which Marathon holds a 60 percent interest, began operations in May 2007 and delivered 24 cargoes during the year. Following a shut-in for the repair of a minor leak, the LNG production facility returned to normal operations in mid-November and has since produced at 92 percent of the 3.7 million metric tones per annum nameplate capacity. Additionally, income from the Company’s equity method investment in Atlantic Methanol Production Company LLC was higher in both the fourth quarter and full year 2007 on increased methanol production and realized prices. Q uarter ended Y ear ended December 3 1 December 3 1 2007 2006 2007 2006 Key Integrated Gas S tatistics Net S ales (metric tonnes per day) LNG 3,890 901 3,310 1,026 Me tha no l 1,376 807 1,308 905 Marathon Oil Corporation Reports Fourth Quarter and Full Year 2007 Financial Results page 7
  • 8. Corporate Marathon continued its $5 billion share repurchase program in 2007, repurchasing just over $2.5 billion of common stock in less than two years under the program. The Company currently anticipates completing share repurchases by the end of 2009, although repurchases are likely to be less ratable than in prior years. This program may be changed based on the Company’s financial condition or changes in market conditions and is subject to termination prior to completion. Marathon raised its quarterly dividend rate 20 percent in 2007, and this is the fifth consecutive year that the Company has increased its dividend. In April 2007, the Company's Board of Directors declared a two-for-one split of Marathon's common stock. The stock split was effected in the form of a stock dividend distributed on June 18, 2007, to stockholders of record at the close of business on May 23, 2007. Special Items Marathon has two long-term natural gas sales contracts in the United Kingdom that are accounted for as derivative instruments. Mark-to-market changes in the valuation of these contracts must be recognized in current period income. The non-cash after-tax mark-to-market losses on these two long-term natural gas sales contracts related to Marathon’s Brae natural gas production totaled $62 million in the fourth quarter of 2007 and $118 million for the full year. Due to the volatility in the fair value of these contracts, Marathon consistently excludes these non-cash gains and losses from net income adjusted for special items. Marathon entered foreign currency derivative instruments to limit the Company’s exposure to changes in the Canadian dollar exchange rate related to the cash portion of the Western purchase price. During the fourth quarter of 2007, the after-tax gain on these derivative instruments was $38 million. The total after-tax gain realized for the full year 2007 was $112 million. These gains on foreign currency derivative instruments have been excluded from net income adjusted for special items. Subsequent to Marathon’s acquisition of Western, decreases to the Canadian federal income tax rates were enacted. These rates will decrease from 32 percent to 25 percent by 2012. The $193 million benefit of applying this income tax rate change to the applicable net deferred tax liabilities has been excluded from net income adjusted for special items for the fourth quarter and full year 2007. Marathon extinguished a portion of its outstanding debt at a premium, recognizing a $1 million after-tax loss in the fourth quarter of 2007 and a $10 million after-tax loss for the full year. These losses have been excluded from net income adjusted for special items. Also excluded from full year 2007 net income adjusted for special items was an additional $8 million after-tax gain related to the sale of the Company’s Russian oil exploration and production businesses in 2006. This special item was discussed in the second quarter of 2007. The Company will conduct a conference call and webcast today, Jan. 31, 2008, at 2 p.m. EST during which it will discuss fourth quarter and full year 2007 results. The webcast will include synchronized slides. To listen to the webcast of the conference call and view the slides, visit the Marathon Web site at www.Marathon.com. Marathon Oil Corporation Reports Fourth Quarter and Full Year 2007 Financial Results page 8
  • 9. Replays of the webcast will be available through Feb. 13, 2008. Quarterly financial and operational information is also provided on Marathon’s Web site at http://ir.marathon.com in the Quarterly Investor Packet. - xxx - In addition to net income determined in accordance with generally accepted accounting principles, Marathon has provided supplementally “net income adjusted for special items,” a non-GAAP financial measure which facilitates comparisons to earnings forecasts prepared by stock analysts and other third parties. Such forecasts generally exclude the effects of items that are considered non-recurring, are difficult to predict or to measure in advance or that are not directly related to Marathon's ongoing operations. A reconciliation between GAAP net income and “net income adjusted for special items” is provided in a table on page 1 of this release. “Net income adjusted for special items” should not be considered a substitute for net income as reported in accordance with GAAP. Management, as well as certain investors, uses “net income adjusted for special items” to evaluate Marathon's financial performance between periods. Management also uses “net income adjusted for special items” to compare Marathon's performance to certain competitors. Unlike capital expenditures reported under generally accepted accounting principles, the forecasted costs for the Garyville refinery expansion project and the Detroit refinery heavy oil upgrading and expansion project discussed in this release do not include capitalized interest. Capitalized interest is budgeted at the corporate level. This release contains forward-looking statements with respect to, the timing and levels of the Company's worldwide liquid hydrocarbon and natural gas and condensate production, bitumen production, the Alvheim/Vilje development, the Volund and Neptune developments, the Droshky prospect, potential developments in Angola, anticipated future exploratory and development drilling activity, potential new leaseholds in Indonesia, the AOSP expansion, the Garyville refinery expansion project, the Detroit refinery heavy oil refining upgrading and expansion project, proved liquid hydrocarbon and natural gas reserves, proven bitumen reserves and the common stock repurchase program. Some factors that could potentially affect worldwide liquid hydrocarbon and natural gas and condensate production, bitumen production, the Alvheim/Vilje, Volund and Neptune developments, the Droshky prospect, potential developments in Angola, potential new leaseholds in Indonesia and anticipated future exploratory and development drilling activity include pricing, supply and demand for petroleum products, the amount of capital available for exploration and development, regulatory constraints, timing of commencing production from new wells, drilling rig availability, unforeseen hazards such as weather conditions, acts of war or terrorist acts and the governmental or military response thereto, and other geological, operating and economic considerations. Except for the Alvheim/Vilje, Volund and Neptune developments, the foregoing forward-looking statements may be further affected by the inability or delay in obtaining government and third-party approvals and permits. Worldwide production could also be affected by the occurrence of acquisitions or dispositions of oil and gas properties. Factors that could affect the AOSP expansion, the Garyville refinery expansion and the Detroit refinery heavy oil refining upgrading and expansion projects include transportation logistics, availability of materials and labor, unforeseen hazards such as weather conditions, delays in obtaining or conditions imposed by necessary government and third-party approvals, and other risks customarily associated with construction projects. The forward-looking statements related to proved reserves of liquid hydrocarbons and natural gas are based on certain assumptions including, among others, presently known physical data concerning size and character of reservoirs, economic recoverability, technology development, future drilling success, production experience, industry economic conditions, levels of cash flow from operations and operating conditions. The forward- looking statements regarding the proven bitumen reserves are based on presently known physical data, economic recoverability and operating conditions. The common stock repurchase program could be affected by changes in prices of and demand for crude oil, natural gas and refined products, actions of competitors, disruptions or interruptions of the Company’s production or refining operations due to unforeseen hazards such as weather conditions or acts of war or terrorist acts, and other operating and economic considerations. The foregoing factors (among others) could cause actual results to differ materially from those set forth in the forward-looking statements. In accordance with the quot;safe harborquot; provisions of the Private Securities Litigation Reform Act of 1995, Marathon Oil Corporation has included in its Annual Report on Form 10-K for the year ended December 31, 2006, and subsequent Forms 10-Q and 8-K, cautionary language identifying other important factors, though not necessarily all such factors, that could cause future outcomes to differ materially from those set forth in the forward-looking statements. Marathon Oil Corporation Reports Fourth Quarter and Full Year 2007 Financial Results page 9
  • 10. Cautionary Note to U.S. Investors - The United States Securities and Exchange Commission (SEC) permits oil and gas companies, in their filings with the SEC, to disclose only proved oil and gas reserves that have demonstrated by actual production or conclusive formation tests to be economically and legally producible under existing economic and operating conditions. Marathon Oil Corporation uses certain terms in this press release, such as heavy oil resources that the SEC's guidelines strictly prohibit us from including in filings with the SEC. U.S. Investors are urged to consider closely the disclosures in Marathon's periodic filings with the SEC, available from us at 5555 San Felipe, Houston, Texas 77056 and the Company's Web site at http://www.Marathon.com. You can also obtain this information from the SEC by calling 1-800-SEC-0330. Media Relations Contacts: Lee Warren 713-296-4103 Scott Scheffler 713-296-4102 Investor Relations Contacts: Howard Thill 713-296-4140 Michol Ecklund 713-296-3919 Marathon Oil Corporation Reports Fourth Quarter and Full Year 2007 Financial Results page 10
  • 11. Condensed Consolidated Statements of Income (Unaudited) Quarter ended Y ear ended December 31 December 31 (In millions, except per share data) 2007 2006 2007 2006 Revenues and other income: Sales and other operating revenues $ $ $ $ 17,704 13,274 62,800 57,973 (including consumer excise taxes) 2 208 127 5,457 Revenues from matching buy/sell 479 325 1,625 1,466 Sales to related parties 151 93 545 391 Income from equity method investments 16 49 36 77 Net gain on disposal of assets 12 37 74 85 Other income 18,364 13,986 65,207 65,449 Total revenues and other income Costs and expenses: Cost of revenues (excludes items below ) 14,944 9,768 49,235 42,415 Purchases related to matching buy/sell 2 191 149 5,396 transactions 72 51 232 210 Purchases from related parties 1,307 1,240 5,163 4,979 Consumer excise taxes 415 388 1,613 1,518 Depreciation, depletion and amortization 377 333 1,327 1,228 Selling, general and administrative 108 91 394 371 Other taxes 190 131 454 365 Exploration expenses 17,415 12,193 58,567 56,482 Total costs and expenses Income from operations 949 1,793 6,640 8,967 Net interest and other financing (17) 44 41 37 income (costs) Gain on foreign currency derivative instruments 62 - 182 - (3) (35) (17) (35) Loss on early extinguishment of debt Minority interests in loss of Equatorial LNG Holdings Limited - 3 3 10 Income from continuing operations before income taxes 991 1,805 6,849 8,979 323 726 2,901 4,022 Provision for income taxes Income from continuing operations 668 1,079 3,948 4,957 Discontinued operations - - 8 277 Net income $ 668 $ 1,079 $ 3,956 $ 5,234 Income from continuing operations Per share – basic $0.95 $1.54 $5.72 $6.92 Per share – diluted $0.94 $1.53 $5.68 $6.87 Net income Per share – basic $0.95 $1.54 $5.73 $7.31 Per share – diluted $0.94 $1.53 $5.69 $7.25 Dividends paid per share $0.24 $0.20 $0.92 $0.76 Weighted average shares 708 699 690 716 Basic 713 705 695 722 Diluted Marathon Oil Corporation Reports Fourth Quarter and Full Year 2007 Financial Results page 11
  • 12. Selected Notes to Financial Statements (Unaudited) 1. On October 18, 2007, Marathon purchased Western Oil Sands Inc. (Western) for cash and securities of $5.8 billion. Western’s outstanding debt was $1.1 billion at closing, for a total transaction value of $6.9 billion. The acquisition was accounted for under the purchase method of accounting and, as such, Marathon’s results of operations include Western’s results from October 18, 2007. 2. Equatorial Guinea LNG Holdings Limited (EGHoldings), in which Marathon holds a 60 percent interest, was formed for the purpose of constructing and operating an LNG production facility. During facility construction, EGHoldings was a variable interest entity (VIE) that was consolidated by Marathon because Marathon was its primary beneficiary. Once the LNG production facility commenced its primary operations and began to generate revenue in May 2007, EGHoldings was no longer a VIE. Effective May 1, 2007, Marathon no longer consolidates EGHoldings, despite the fact that the Company holds majority ownership, because the minority shareholders have rights limiting Marathon’s ability to exercise control over the entity. Marathon’s investment is accounted for prospectively using the equity method of accounting. 3. On April 25, 2007, the Company’s Board of Directors declared a two-for-one split of the Company’s common stock. The stock split was effected in the form of a stock dividend distributed on June 18, 2007, to stockholders of record at the close of business on May 23, 2007. Stockholders received one additional share of Marathon Oil Corporation common stock for each share of common stock held as of the close of business on the record date. Common share and per share information for all periods presented in the condensed consolidated statements of income has been restated to reflect the stock split. Marathon Oil Corporation Reports Fourth Quarter and Full Year 2007 Financial Results page 12
  • 13. Preliminary Supplemental Statistics (Unaudited) Quarter ended Y ear ended December 31 December 31 (Dollars in millions, except as noted) 2007 2006 2007 2006 SEGMENT INCOME (LOSS) Exploration and Production 153 167 623 873 United States $ $ $ $ 312 140 1,106 1,130 International 465 307 1,729 2,003 E&P segment (63) - (63) - Oil Sands Mining 4 533 2,077 2,795 Refining, Marketing and Transportation 49 (7) 132 16 Integrated Gas 455 833 3,875 4,814 Segment income Items not allocated to segments, net of taxes 45 5 (104) (212) Corporate and other unallocated items Gain (loss) on long-term U.K. natural gas (62) 139 (118) 232 contracts Gain on foreign currency derivative instruments 38 - 112 - Deferred income taxes – tax legislation changes 193 - 193 21 – other adjustments - 93 - 93 Gain on dispositions - 31 8 274 (1) (22) (10) (22) Loss on early extinguishment of debt - - - 34 Discontinued operations 668 1,079 3,956 5,234 Net income $ $ $ $ CAPITAL EXPENDITURES 888 553 2,511 2,169 Exploration and Production $ $ $ $ 165 - 165 - Oil Sands Mining 659 389 1,640 916 Refining, Marketing and Transportation Integrated Gas (a) - 71 93 307 - - - 45 Discontinued Operations 29 15 57 41 Corporate 1,741 1,028 4,466 3,478 Total $ $ $ $ EXPLORATION EXPENSES 137 60 274 169 United States $ $ $ $ 53 71 180 196 International 190 131 454 365 Total $ $ $ $ Through April 2007, includes Equatorial Guinea LNG Holdings (EGHoldings) at 100 percent. Effective May 1, 2007, (a) Marathon no longer consolidates EGHoldings and its investment in EG Holdings is accounted for under the equity method of accounting; therefore, EGHoldings’ capital expenditures subsequent to April 2007 are not included in Marathon’s capital expenditures. Marathon Oil Corporation Reports Fourth Quarter and Full Year 2007 Financial Results page 13
  • 14. Preliminary Supplemental Statistics (Unaudited) Q uarter ended Y ear ended December 31 December 3 1 2007 2006 2007 2006 E&P O PERATING S TATISTICS Ne t Liquid Hydro ca rbo n Sa le s (mbpd)(b) 60 74 64 76 Unite d Sta te s 34 34 33 35 Euro pe 96 104 1 00 112 Africa 130 138 1 33 147 To ta l Inte rna tio na l 190 212 1 97 223 W o rldw ide C o ntinuing O pe ra tio ns 12 Dis co ntinue d O pe ra tio ns – – – 190 212 1 97 235 W o rldw ide (b)(c) Ne t Na tura l Ga s Sa le s (mmcfd) 474 522 4 77 532 Unite d Sta te s 245 262 2 16 243 Euro pe 265 90 2 32 72 Africa 510 352 4 48 315 To ta l Inte rna tio na l 984 874 9 25 847 W o rldw ide To ta l W o rldw ide Sa le s (mbo e pd) 354 357 3 51 365 C o ntinuing o pe ra tio ns 12 Dis co ntinue d o pe ra tio ns – – – 354 357 3 51 377 W o rldw ide Ave ra ge Re a liz a tio ns (d) Liquid Hydro ca rbo ns (pe r bbl) Unite d Sta te s $ 74.16 $ 48.33 $ 60.15 $ 54.41 Euro pe 89.17 59.01 70.31 64.02 Africa 83.05 53.61 66.09 59.83 To ta l Inte rna tio na l 84.64 54.94 67.15 60.81 W o rldw ide C o ntinuing O pe ra tio ns 81.33 52.63 64.86 58.63 Dis co ntinue d O pe ra tio ns 38.38 – – – W o rldw ide $ 81.33 $ 52.63 $ 64.86 $ 57.58 Na tura l Ga s (pe r mcf) Unite d Sta te s $ 5.70 $ 5.36 $ 5.73 $ 5.76 Euro pe 7.98 6.49 6.53 6.74 Africa 0.25 0.32 0.25 0.27 To ta l Inte rna tio na l 3.96 4.90 3.28 5.27 W o rldw ide $ 4.80 $ 5.17 $ 4.54 $ 5.58 Amounts represent net sales after royalties, except for Ireland where amounts are before royalties. (b) Includes natural gas acquired for injection and subsequent resale of 41 mmcfd and 47 mmcfd for the fourth quarters of (c) 2007 and 2006, and 47 mmcfd and 46 mmcfd for the years 2007 and 2006. Excludes gains and losses on traditional derivative instruments and the unrealized effects of long-term U.K. natural gas (d) contracts that are accounted for as derivatives. Marathon Oil Corporation Reports Fourth Quarter and Full Year 2007 Financial Results page 14
  • 15. Preliminary Supplemental Statistics (Unaudited) (continued) Quarter ended Y ear ended December 31 December 31 (Dollars in millions, except as noted) 2007 2006 2007 2006 OSM OPERATING STATISTICS Net Bitumen Production (mbpd)(e) 15 - 4 - (e) Net Synthetic Crude Oil Sales (mbpd) 17 - 4 - Synthetic Crude Oil Average Realization (per bbl)(f) $ 71.07 - 71.07 - $ $ $ RM&T OPERATING STATISTICS Refinery Runs (mbpd) Crude oil refined 956 952 1,010 980 Other charge and blend stocks 223 260 214 234 Total 1,179 1,212 1,224 1,214 Refined Product Yields (mbpd) Gasoline 635 681 646 661 Distillates 339 342 349 323 Propane 21 24 23 23 Feedstocks and special products 81 74 108 107 Heavy fuel oil 34 34 27 26 Asphalt 84 74 86 89 Total 1,194 1,229 1,239 1,229 Refined Products Sales Volumes (mbpd)(g)(h) 1,432 1,389 1,410 1,425 Matching buy/sell volumes included in above (h) 24 — — — Refining and W holesale Marketing Gross Margin (i)(j) 0.0480 0.1707 0.1848 $ 0.2288 $ $ $ Speedw ay SuperAmerica Retail outlets 1,636 1,636 — — (k) 836 842 3,356 3,301 Gasoline and distillate sales (j) 0.1131 0.1121 0.1119 0.1156 Gasoline and distillate gross margin $ $ $ $ Merchandise sales $ 686 $ 677 $ 2,796 $ 2,706 Merchandise gross margin $ 172 $ 170 $ 705 $ 667 IG OPERATING STATISTICS Net Sales (metric tonnes per day) LNG 3,890 901 3,310 1,026 1,376 807 1,308 905 Methanol (e) The oil sands mining operations were acquired October 18, 2007. Average daily volumes represent total volumes since the acquisition date over total days in the reporting period. (f) Excludes losses on derivative instruments. (g) Total average daily volumes of all refined product sales to wholesale, branded and retail (SSA) customers. (h) As a result of the change in accounting for matching buy/sell arrangements on April 1, 2006, the reported sales volumes will be lower than the volumes determined under the previous accounting practices. (i) Sales revenue less cost of refinery inputs, purchased products and manufacturing expenses, including depreciation. As a result of the change in accounting for matching buy/sell transactions on April 1, 2006, the resulting per gallon statistic will be higher than the statistic that would have been calculated from amounts determined under previous accounting practices. (j) Per gallon (k) Millions of gallons Marathon Oil Corporation Reports Fourth Quarter and Full Year 2007 Financial Results page 15