First, earnings per share for the first quarter of 2007 were $0.92 compared to $0.67 in the first quarter of 2006. Normalized non-GAAP earnings, excluding special items, were $0.88 per share for the first quarter of 2007. Higher electric distribution deliveries and generation revenues increased earnings, while higher fuel and purchased power expenses and lower distribution rates reduced earnings. Overall, normalized earnings increased due to various factors including higher sales volumes and market prices.
1. Consolidated Report to the Financial Community
First Quarter 2007
(Released May 3, 2007) (Unaudited)
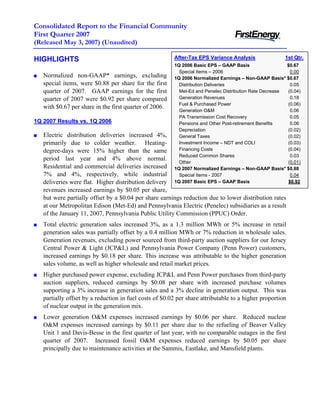
After-Tax EPS Variance Analysis 1st Qtr.
HIGHLIGHTS
1Q 2006 Basic EPS – GAAP Basis $0.67
Special Items – 2006 0.00
Normalized non-GAAP* earnings, excluding 1Q 2006 Normalized Earnings – Non-GAAP Basis* $0.67
special items, were $0.88 per share for the first Distribution Deliveries 0.05
quarter of 2007. GAAP earnings for the first Met-Ed and Penelec Distribution Rate Decrease (0.04)
Generation Revenues 0.18
quarter of 2007 were $0.92 per share compared
Fuel & Purchased Power (0.06)
with $0.67 per share in the first quarter of 2006.
Generation O&M 0.06
PA Transmission Cost Recovery 0.05
1Q 2007 Results vs. 1Q 2006 Pensions and Other Post-retirement Benefits 0.06
Depreciation (0.02)
Electric distribution deliveries increased 4%, General Taxes (0.02)
primarily due to colder weather. Heating- Investment Income – NDT and COLI (0.03)
Financing Costs (0.04)
degree-days were 15% higher than the same
Reduced Common Shares 0.03
period last year and 4% above normal.
Other (0.01)
Residential and commercial deliveries increased 1Q 2007 Normalized Earnings – Non-GAAP Basis* $0.88
7% and 4%, respectively, while industrial Special Items - 2007 0.04
deliveries were flat. Higher distribution delivery 1Q 2007 Basic EPS – GAAP Basis $0.92
revenues increased earnings by $0.05 per share,
but were partially offset by a $0.04 per share earnings reduction due to lower distribution rates
at our Metropolitan Edison (Met-Ed) and Pennsylvania Electric (Penelec) subsidiaries as a result
of the January 11, 2007, Pennsylvania Public Utility Commission (PPUC) Order.
Total electric generation sales increased 3%, as a 1.3 million MWh or 5% increase in retail
generation sales was partially offset by a 0.4 million MWh or 7% reduction in wholesale sales.
Generation revenues, excluding power sourced from third-party auction suppliers for our Jersey
Central Power & Light (JCP&L) and Pennsylvania Power Company (Penn Power) customers,
increased earnings by $0.18 per share. This increase was attributable to the higher generation
sales volume, as well as higher wholesale and retail market prices.
Higher purchased power expense, excluding JCP&L and Penn Power purchases from third-party
auction suppliers, reduced earnings by $0.08 per share with increased purchase volumes
supporting a 3% increase in generation sales and a 3% decline in generation output. This was
partially offset by a reduction in fuel costs of $0.02 per share attributable to a higher proportion
of nuclear output in the generation mix.
Lower generation O&M expenses increased earnings by $0.06 per share. Reduced nuclear
O&M expenses increased earnings by $0.11 per share due to the refueling of Beaver Valley
Unit 1 and Davis-Besse in the first quarter of last year, with no comparable outages in the first
quarter of 2007. Increased fossil O&M expenses reduced earnings by $0.05 per share
principally due to maintenance activities at the Sammis, Eastlake, and Mansfield plants.
2. The deferral and recovery of incremental Met-Ed and Penelec transmission charges increased
earnings by $0.05 per share. The companies were authorized by the PPUC in May 2006 to defer
these charges, retroactive to the beginning of the year. Thus, results from the first quarter of
2006 do not reflect the deferral, while the first quarter of 2007 reflects actual recovery of these
transmission expenses following the January 11, 2007, PPUC Order in the Met-Ed and Penelec
rate cases.
Reduced pensions and other post-retirement benefit costs increased earnings by $0.06 per share
mainly due to retiree health care design changes, as well as the impact of the $300 million
voluntary contribution to the pension plan made in January 2007.
Incremental property and plant additions increased depreciation by $0.02 per share.
Increased general taxes reduced earnings by $0.02 per share primarily due to higher gross
receipts taxes in Pennsylvania, higher kilowatt-hour taxes in Ohio, and higher property taxes.
Investment income related to nuclear decommissioning trusts and corporate-owned life
insurance decreased $0.03 per share.
Increased financing costs lowered earnings by $0.04 per share, primarily attributable to short-
term borrowing levels related to interim funding of the share repurchase programs and the $300-
million pension plan contribution.
The reduction in shares outstanding due to the accelerated repurchases of 10.6 million and 14.4
million common shares in August 2006 and March 2007, respectively, enhanced earnings by
$0.03 per share.
Two special items were recognized during the first quarter of 2007. The first item resulted from
a PPUC order authorizing Met-Ed and Penelec to create a new regulatory asset for costs
associated with decommissioning the Saxton Nuclear Research Reactor. This item increased
earnings by $0.05 per share. The second item relates to a $0.01 per share reduction in earnings
from impairment of securities held in trust for future nuclear decommissioning activities.
2007 Earnings Guidance
Normalized non-GAAP earnings guidance for 2007, excluding special items, remains at $4.05
to $4.25 per share.
* The 2007 GAAP to non-GAAP reconciliation statements can be found on page 10 of this report and all GAAP to non-GAAP
reconciliation statements are available on the Investor Information section of FirstEnergy Corp.'s Web site at
www.firstenergycorp.com/ir.
For additional information, please contact:
Ronald E. Seeholzer Kurt E. Turosky Rey Y. Jimenez
Vice President, Investor Relations Director, Investor Relations Principal, Investor Relations
(330) 384-5783 (330) 384-5500 (330) 761-4239
Consolidated Report to the Financial Community – 1st Quarter 2007 2
3. FirstEnergy Corp.
Consolidated Statements of Income
(Unaudited)
(In millions, except for per share amounts)
Three Months Ended March 31,
2007 2006 Change
Revenues
(1) Electric sales $ 2,764 $ 2,511 $ 253
(2) FE Facilities - 15 (15)
(3) Other 209 179 30
(4) Total Revenues 2,973 2,705 268
Expenses
(5) Fuel 262 282 (20)
(6) Purchased power 859 716 143
(7) Other operating expenses 749 738 11
(8) FE Facilities - 16 (16)
(9) Provision for depreciation 156 148 8
(10) Amortization of regulatory assets 251 221 30
(11) Deferral of new regulatory assets (144) (80) (64)
(12) General taxes 203 193 10
(13) Total Expenses 2,336 2,234 102
(14) Operating Income 637 471 166
Other Income (Expense)
(15) Investment income 33 43 (10)
(16) Interest expense (185) (165) (20)
(17) Capitalized interest 5 7 (2)
(18) Subsidiaries' preferred stock dividends - (2) 2
(19) (147) (117) (30)
Total Other Income (Expense)
(20) Income From Continuing Operations
490 354 136
Before Income Taxes
(21) Income taxes 200 135 65
(22) Income From Continuing Operations 290 219 71
(23) Discontinued operations - 2 (2)
(24) Net Income $ 290 $ 221 $ 69
Basic Earnings Per Common Share:
(25) Income from continuing operations $ 0.92 $ 0.67 $ 0.25
(26) Discontinued operations - - -
(27) Basic Earnings Per Common Share $ 0.92 $ 0.67 $ 0.25
(28) Weighted Average Number of
314 329 (15)
Basic Shares Outstanding
Diluted Earnings Per Common Share:
(29) Income from continuing operations $ 0.92 $ 0.67 $ 0.25
(30) Discontinued operations - - -
(31) Diluted Earnings Per Common Share $ 0.92 $ 0.67 $ 0.25
(32) Weighted Average Number of
316 330 (14)
Diluted Shares Outstanding
______________________________________________________________________________________________________
Consolidated Report to the Financial Community – 1st Quarter 2007 3
4. FirstEnergy Corp.
Consolidated Income Segments
(Unaudited)
(In millions)
Three Months Ended March 31, 2007
Ohio
Energy Competitive Transitional
Energy Reconciling
Delivery Generation
Services (b) Adjustments
Services (a) Services (c) Other (d) Consolidated
Revenues
(1) Electric sales $ 1,875 $ 276 $ 613 $ - $ - $ 2,764
(2) FE Facilities - - - - - -
(3) Other 165 52 6 12 (26) 209
(4) Internal revenues - 714 - - (714) -
(5) 2,040 1,042 619 12 (740) 2,973
Total Revenues
Expenses
(6) Fuel - 262 - - - 262
(7) Purchased power 844 185 544 - (714) 859
(8) Other operating expenses 408 307 49 3 (18) 749
(9) FE Facilities - - - - - -
(10) Provision for depreciation 98 51 - 1 6 156
(11) Amortization of regulatory assets 246 - 5 - - 251
(12) Deferral of new regulatory assets (124) - (20) - - (144)
(13) General taxes 165 28 2 - 8 203
(14) Total Expenses 1,637 833 580 4 (718) 2,336
(15) Operating Income 403 209 39 8 (22) 637
Other Income (Expense)
(16) Investment income 70 3 1 - (41) 33
(17) Interest expense (109) (52) (1) (2) (21) (185)
(18) Capitalized interest 2 3 - - - 5
(19) Subsidiaries' preferred stock dividends - - - - - -
(20) (37) (46) - (2) (62) (147)
Total Other Income (Expense)
(21) Income From Continuing Operations
366 163 39 6 (84) 490
Before Income Taxes
(22) Income taxes 148 65 15 5 (33) 200
(23) Income From Continuing Operations 218 98 24 1 (51) 290
(24) Discontinued operations - - - - - -
(25) Net Income $ 218 $ 98 $ 24 $ 1 $ (51) $ 290
(a) Consists of regulated transmission and distribution operations, including transition cost recovery, and provider of last resort generation service for
FirstEnergy's Pennsylvania and New Jersey electric utility subsidiaries.
(b) Consists of unregulated generation and commodity operations, including competitive electric sales, and generation sales to affiliated electric utilities.
(c) Represents provider of last resort generation service by FirstEnergy's Ohio electric utility subsidiaries.
(d) Primarily consists of telecommunications services.
______________________________________________________________________________________________________
Consolidated Report to the Financial Community – 1st Quarter 2007 4
5. FirstEnergy Corp.
Consolidated Income Segments
(Unaudited)
(In millions)
Three Months Ended March 31, 2006
Ohio
Energy Competitive Transitional
Energy Reconciling
Delivery Generation
Revenues Services (b) Adjustments
Services (a) Services (c) Other (d) Consolidated
(1) Electric sales $ 1,668 $ 304 $ 539 $ - $ - $ 2,511
(2) FE Facilities - - - 15 - 15
(3) Other 128 51 4 13 (17) 179
(4) Internal revenues 9 611 - - (620) -
(5) 1,805 966 543 28 (637) 2,705
Total Revenues
Expenses
(6) Fuel 1 281 - - - 282
(7) Purchased power 692 187 457 - (620) 716
(8) Other operating expenses 366 344 56 3 (31) 738
(9) FE Facilities - - - 16 - 16
(10) Provision for depreciation 96 46 - 1 5 148
(11) Amortization of regulatory assets 217 - 4 - - 221
(12) Deferral of new regulatory assets (55) - (25) - - (80)
(13) General taxes 158 26 1 1 7 193
(14) Total Expenses 1,475 884 493 21 (639) 2,234
(15) Operating Income 330 82 50 7 2 471
Other Income (Expense)
(16) Investment income 84 15 - - (56) 43
(17) Interest expense (100) (47) - (1) (17) (165)
(18) Capitalized interest 3 3 - - 1 7
(19) Subsidiaries' preferred stock dividends (2) - - - - (2)
(20) (15) (29) - (1) (72) (117)
Total Other Income (Expense)
(21) Income From Continuing Operations
315 53 50 6 (70) 354
Before Income Taxes
(22) Income taxes 126 21 20 (6) (26) 135
(23) Income From Continuing Operations 189 32 30 12 (44) 219
(24) Discontinued operations - - - 2 - 2
(25) Net Income $ 189 $ 32 $ 30 $ 14 $ (44) $ 221
(a) Consists of regulated transmission and distribution operations, including transition cost recovery, and provider of last resort generation service for
FirstEnergy's Pennsylvania and New Jersey electric utility subsidiaries.
(b) Consists of unregulated generation and commodity operations, including competitive electric sales, and generation sales to affiliated electric utilities.
(c) Represents provider of last resort generation service by FirstEnergy's Ohio electric utility subsidiaries.
(d) Consists of telecommunications services and non-core businesses divested in 2006 (Facilities Services Group and MYR).
______________________________________________________________________________________________________
Consolidated Report to the Financial Community – 1st Quarter 2007 5
6. FirstEnergy Corp.
Consolidated Income Segments
(Unaudited)
(In millions)
Three Months Ended March 31, 2007 vs. Three Months Ended March 31, 2006
Ohio
Energy Competitive Transitional
Energy Reconciling
Delivery Generation
Revenues Services (b) Adjustments
Services (a) Services (c) Other (d) Consolidated
(1) Electric sales $ 207 $ (28) $ 74 $ - $ - $ 253
(2) FE Facilities - - - (15) - (15)
(3) Other 37 1 2 (1) (9) 30
(4) Internal revenues (9) 103 - - (94) -
(5) Total Revenues 235 76 76 (16) (103) 268
Expenses
(6) Fuel (1) (19) - - - (20)
(7) Purchased power 152 (2) 87 - (94) 143
(8) Other operating expenses 42 (37) (7) - 13 11
(9) FE Facilities - - - (16) - (16)
(10) Provision for depreciation 2 5 - - 1 8
(11) Amortization of regulatory assets 29 - 1 - - 30
(12) Deferral of new regulatory assets (69) - 5 - - (64)
(13) General taxes 7 2 1 (1) 1 10
(14) Total Expenses 162 (51) 87 (17) (79) 102
(15) Operating Income 73 127 (11) 1 (24) 166
Other Income (Expense)
(16) Investment income (14) (12) 1 - 15 (10)
(17) Interest expense (9) (5) (1) (1) (4) (20)
(18) Capitalized interest (1) - - - (1) (2)
(19) Subsidiaries' preferred stock dividends 2 - - - - 2
(20) (22) (17) - (1) 10 (30)
Total Other Income (Expense)
(21) Income From Continuing Operations
51 110 (11) - (14) 136
Before Income Taxes
(22) Income taxes 22 44 (5) 11 (7) 65
(23) Income From Continuing Operations 29 66 (6) (11) (7) 71
(24) Discontinued operations - - - (2) - (2)
(25) Net Income $ 29 $ 66 $ (6) $ (13) $ (7) $ 69
(a) Consists of regulated transmission and distribution operations, including transition cost recovery, and provider of last resort generation service for
FirstEnergy's Pennsylvania and New Jersey electric utility subsidiaries.
(b) Consists of unregulated generation and commodity operations, including competitive electric sales, and generation sales to affiliated electric utilities.
(c) Represents provider of last resort generation service by FirstEnergy's Ohio electric utility subsidiaries.
(d) Consists of telecommunications services and non-core businesses divested in 2006 (Facilities Services Group and MYR).
______________________________________________________________________________________________________
Consolidated Report to the Financial Community – 1st Quarter 2007 6
7. FirstEnergy Corp.
Financial Statements
(Unaudited)
(In millions)
Condensed Consolidated Balance Sheets
March 31, December 31,
2007 2006
Assets
Current Assets:
Cash and cash equivalents $ 89 $ 90
Receivables 1,434 1,267
Other 824 726
Total Current Assets 2,347 2,083
Property, Plant and Equipment 14,786 14,667
Investments 3,525 3,534
Deferred Charges and Other Assets 11,132 10,912
Total Assets $ 31,790 $ 31,196
Liabilities and Capitalization
Current Liabilities:
Currently payable long-term debt $ 2,092 $ 1,867
Short-term borrowings 2,247 1,108
Accounts payable 625 726
Other 1,432 1,554
Total Current Liabilities 6,396 5,255
Capitalization:
Common stockholders' equity 8,299 9,035
Long-term debt and other long-term obligations 8,548 8,535
Total Capitalization 16,847 17,570
Noncurrent Liabilities 8,547 8,371
Total Liabilities and Capitalization $ 31,790 $ 31,196
General Information
Three Months Ended March 31,
2007 2006
Debt and equity securities redemptions $ (904) $ (94)
New long-term debt issues $ 250 $ -
Short-term debt increase $ 1,139 $ 200
Capital expenditures $ 296 $ 447
Adjusted Capitalization (Including Off-Balance Sheet Items) - Rating Agency View
As of March 31,
2007 % Total 2006 % Total
Total common equity $ 8,299 38% $ 9,320 43%
Preferred stock - 0% 154 1%
Long-term debt* 10,220 46% 9,859 46%
Short-term debt 2,247 10% 931 4%
Off-balance sheet debt equivalents:
Sale-leaseback net debt equivalents 1,235 6% 1,297 6%
Total $ 22,001 100% $ 21,561 100%
* Includes amounts due to be paid within one year and excludes JCP&L securitization debt of
$420 million and $260 million in 2007 and 2006, respectively.
______________________________________________________________________________________________________
Consolidated Report to the Financial Community – 1st Quarter 2007 7
8. FirstEnergy Corp.
Financial Statements
(Unaudited)
(In millions)
Condensed Consolidated Statements of Cash Flows
Three Months Ended March 31,
2007 2006
Cash flows from operating activities:
Net income $ 290 $ 221
Adjustments to reconcile net income to net cash from
operating activities:
Depreciation, amortization, and deferral
of regulatory assets 263 289
Deferred purchased power and other costs (116) (104)
Deferred income taxes and investment tax credits 53 6
Deferred rents and lease market valuation liability (25) (38)
Pension trust contribution (300) -
Cash collateral, net 6 (106)
Electric service prepayment programs (17) (14)
Change in working capital and other (229) 70
Cash flows provided from (used for)
(75) 324
operating activities:
Cash flows provided from (used for)
346 (50)
financing activities:
(272) (310)
Cash flows used for investing activities
$ (1) $ (36)
Net decrease in cash and cash equivalents
Deferrals and Amortizations
Three Months Ended March 31,
2007 2006 Change
Ohio Regulatory Assets
$ 1,844 $ 1,924
Deferred Balance - Beginning
Shopping incentives - 3 $ (3)
Interest on shopping incentives 10 10 -
MISO costs and interest 8 4 4
RCP distribution reliability costs and interest 46 39 7
RCP fuel costs and interest 14 21 (7)
Other regulatory assets 6 3 3
$ 84 $ 80 $ 4
Current period deferrals
Amortization
Ohio transition costs $ (68) $ (72) $ 4
Shopping incentives (30) (30) -
MISO costs (5) (5) -
Other (5) (6) 1
$ (108) $ (113) $ 5
Current period amortization
$ 1,820 $ 1,891
Deferred Balance - Ending
Pennsylvania Deferred PJM Costs
Beginning balance $ 157 $ -
Deferral of PJM transmission costs 35 - $ 35
$ 192 $ -
Ending Balance
New Jersey Deferred Energy Costs
Beginning balance $ 369 $ 541
Deferral (recovery) of energy costs (12) 17 $ (29)
$ 357 $ 558
Ending Balance
______________________________________________________________________________________________________
Consolidated Report to the Financial Community – 1st Quarter 2007 8
9. FirstEnergy Corp.
Statistical Summary
(Unaudited)
ELECTRIC SALES STATISTICS Three Months Ended March 31,
(in millions of kWhs) 2007 2006 Change
Electric Generation Sales
Retail - Regulated 24,809 24,006 3.3%
Retail - Competitive 3,206 2,719 17.9%
Total Retail 28,015 26,725 4.8%
Wholesale 5,063 5,422 -6.6%
Total Electric Generation Sales 33,078 32,147 2.9%
Electric Distribution Deliveries
Ohio - Residential 4,831 4,443 8.7%
- Commercial 3,795 3,644 4.1%
- Industrial 5,679 5,659 0.4%
- Other 94 91 3.3%
Total Ohio 14,399 13,837 4.1%
Pennsylvania - Residential 3,303 3,092 6.8%
- Commercial 2,771 2,650 4.6%
- Industrial 2,542 2,563 -0.8%
- Other 20 20 0.0%
Total Pennsylvania 8,636 8,325 3.7%
New Jersey - Residential 2,353 2,254 4.4%
- Commercial 2,297 2,204 4.2%
- Industrial 702 691 1.6%
- Other 21 22 -4.5%
Total New Jersey 5,373 5,171 3.9%
Total Residential 10,487 9,789 7.1%
Total Commercial 8,863 8,498 4.3%
Total Industrial 8,923 8,913 0.1%
Total Other 135 133 1.5%
Total Distribution Deliveries 28,408 27,333 3.9%
Electric Sales Shopped
Ohio - Residential 560 596 -6.0%
- Commercial 880 957 -8.0%
- Industrial 642 734 -12.5%
Total Ohio 2,082 2,287 -9.0%
Pennsylvania - Residential - 1 -100.0%
- Commercial 108 1 -
- Industrial 415 131 216.8%
Total Pennsylvania 523 133 293.2%
New Jersey - Residential - - -
- Commercial 475 403 17.9%
- Industrial 519 504 3.0%
Total New Jersey 994 907 9.6%
Total Electric Sales Shopped 3,599 3,327 8.2%
Three Months Ended
Operating Statistics March 31,
2007 2006
Capacity Factors:
Fossil - Baseload 64% 83%
Fossil - Load Following 74% 69%
Peaking 0% 0%
Nuclear 99% 85%
Generation Output:
Fossil - Baseload 32% 41%
Fossil - Load Following 25% 23%
Peaking 0% 0%
Nuclear 43% 36%
Three Months Ended March 31,
Weather 2007 2006 Normal
Composite Heating-Degree-Days 2,908 2,523 2,804
Composite Cooling-Degree-Days 1 - 8
______________________________________________________________________________________________________
Consolidated Report to the Financial Community – 1st Quarter 2007 9
10. FirstEnergy Corp.
2007 EPS Reconciliations
(Unaudited)
Special Items
Three Months Ended March 31,
2007 2006
Pre-tax Items - Income Increase (Decrease)
Gain (Loss) on Non-Core Asset Sales of:
Loss on sale on MYR 60% interest (a) $ - $ (5)
Saxton Decommissioning costs regulatory assets (b) 27 -
Trust securities impairment (c) (5) -
$ 22 $ (5)
Total-Pretax Items
EPS Effect $ 0.04 $ -
(a) Included in quot;Other operating expensesquot;
(b) Included in quot;Deferral of new regulatory assetsquot;
(c) Included in quot;Investment incomequot;
2007 Earnings Per Share (EPS)
(Reconciliation of GAAP to Non-GAAP)
ACTUAL Non-GAAP
Three Months Guidance For
Ended March 31 Year 2007
$ 0.92 $4.09 - $4.29
Basic EPS (GAAP basis)
Excluding Special Items:
New Regulatory Asset Authorized by PPUC (0.05) (0.05)
Trust securities impairment 0.01 0.01
$ 0.88 $4.05 - $4.25
Basic EPS (Non-GAAP basis)
______________________________________________________________________________________________________
Consolidated Report to the Financial Community – 1st Quarter 2007 10
11. RECENT DEVELOPMENTS
Share Repurchase Programs
On March 2, 2007, FirstEnergy repurchased approximately 14.4 million shares, or 4.5 percent of its outstanding
common stock, under an accelerated share repurchase (ASR) agreement with an affiliate of Morgan Stanley & Co.
Incorporated (Morgan Stanley). The initial purchase price was $900 million, or $62.63 per share. The final
purchase price will be adjusted to reflect the volume-weighted average price of our stock during the period of time
that Morgan Stanley will acquire the shares (up to approximately one year from inception). The ASR was
completed under a January 30, 2007, Board of Directors’ authorization to repurchase up to 16 million shares of
outstanding common stock.
On April 2, 2007, an affiliate of J.P. Morgan Securities (J.P. Morgan) completed its acquisition of common shares
under FirstEnergy’s prior ASR program of 10.6 million shares, which was executed in August 2006. In settling
the transaction, FirstEnergy paid J.P. Morgan approximately $27 million (direct charge to common stockholders’
equity) for a purchase price adjustment and true-up of dividends paid on shares that J.P. Morgan had not
repurchased as of the respective record dates.
Under the two ASR programs, FirstEnergy has repurchased approximately 25 million common shares, or
8 percent of the total outstanding as of July 2006.
FirstEnergy Solutions Corp. Credit Ratings
On March 26, 2007, Standard & Poor’s Rating Services (S&P) assigned its corporate credit rating of BBB to
FirstEnergy Solutions Corp. (FES), an unregulated subsidiary of FirstEnergy. FES also received an issuer rating
of Baa2 from Moody’s Investor Services (Moody’s) on March 27, 2007. FES is the holding company of
FirstEnergy Generation Corp. and FirstEnergy Nuclear Generation Corp., the owners of FirstEnergy’s fossil and
nuclear generation assets, respectively. Both S&P and Moody’s cited the strength of FirstEnergy’s generation
portfolio as a key contributor to the investment grade credit ratings. On April 20, 2007, FirstEnergy filed a Form
8-K with the Securities and Exchange Commission furnishing FES’ audited financial statements for the three
years ended December 31, 2006.
The Cleveland Electric Illuminating Company Debt Offering
On March 27, 2007, The Cleveland Electric Illuminating Company (CEI) issued $250 million of 5.70% Senior
Notes due 2017. The proceeds from the transaction will be used to meet CEI’s 2007 maturing long-term debt
obligations of $120 million and to repay short-term borrowings.
NRC Oversight Update
On March 2, 2007, the Nuclear Regulatory Commission (NRC) returned FirstEnergy’s Perry Nuclear Power Plant
to routine agency oversight as a result of sufficient corrective actions that have been taken over the last two-and-a-
half years. The Perry Plant had been operating under heightened NRC oversight since August 2004.
Refueling Outage at Perry Nuclear Power Plant
FirstEnergy’s Perry Plant began its regularly scheduled refueling outage on April 2, 2007. Major work activities to
be done on the 1,258-megawatt (MW) facility include replacing approximately one-third of the fuel assemblies in
the reactor and two of the three low-pressure turbine rotors in the main generator.
Power Uprates
In March 2007, FirstEnergy’s Beaver Valley Unit 1 completed the final phase of an extended power uprate project
to add additional capacity to our system. This is its second power uprate in the past 12 months. Capacity testing
will be conducted later this year to verify the actual megawatts gained. This power uprate was achieved in support
of FirstEnergy’s strategy to maximize the full potential of its existing generation assets.
Consolidated Report to the Financial Community – 1st Quarter 2007 11
12. Environmental Update
In March 2007, a selective non-catalytic reduction (SNCR) system was placed in-service at the 597-MW Eastlake
Unit 5 upon completion of a scheduled maintenance outage. The SNCR installation is part of FirstEnergy’s
overall Air Quality Compliance Strategy and was required under the New Source Review consent decree. The
SNCR is expected to reduce NOx emissions and help achieve reductions required by the EPA’s NOx Transport
Rule.
Sale and Leaseback of Bruce Mansfield Unit 1
On January 31, 2007, FirstEnergy announced its intention to pursue a sale and leaseback transaction for its owned
portion of Bruce Mansfield Unit 1. FirstEnergy anticipates the after-tax proceeds of this proposed transaction to
be approximately $1.2 billion. The proceeds are expected to be used to repay short-term borrowings incurred to
fund the recently executed ASR program and the recent pension plan contribution. The Company is targeting a
second quarter of 2007 closing for the transaction, including related lease debt financing.
Met-Ed and Penelec Rate Transition Plan Update
On January 11, 2007, the Pennsylvania Public Utility Commission (PPUC) issued its order in the Metropolitan
Edison (Met-Ed) and Pennsylvania Electric Company (Penelec) Rate Transition Plan cases, approving net T&D
rate increases for Met-Ed of 5% ($59 million) and Penelec of 4.5% ($50 million). Several parties to the
proceeding, including Met-Ed and Penelec, have filed appeals of the PPUC’s decision to the Pennsylvania
Commonwealth Court. The companies appealed the Commission’s decision on the denial of generation rate relief
and on a consolidated income tax adjustment related to cost of capital. The appeals are currently pending.
Met-Ed and Penelec NUG Accounting Case Update
A hearing was held on February 21, 2007, in the Met-Ed and Penelec Non-Utility Generation (NUG) accounting
case. Met-Ed and Penelec are seeking to modify the NUG purchased power stranded costs accounting
methodology to eliminate reductions of the deferred cost balance during periods in which market prices exceeded
NUG payments. The value at issue in this request is estimated to be approximately $40 million for the period
1999 through 2006. Legal briefs were filed in March 2007 and the companies are currently awaiting the
Administrative Law Judge’s Recommended Decision.
Pennsylvania Power Company Default Service Plan
On May 2, 2007, Pennsylvania Power Company (Penn Power) made a filing with the PPUC proposing how it will
procure the power supply needed for default service customers beginning June 1, 2008. Penn Power customers
transitioned to a fully competitive market on January 1, 2007, and the default service plan that the Commission
previously approved covered a 17-month period through May 31, 2008. The filing proposes that Penn Power
procure a full requirements product, by class, through multiple Requests for Proposal with staggered delivery
periods extending through May 2011. It also proposes a 3-year phase-out of promotional generation rates. The
Company expects the Commission to address the filing later this year.
Forward-looking Statements. This Consolidated Report to the Financial Community includes forward-looking statements based on information currently
available to management. Such statements are subject to certain risks and uncertainties. These statements typically contain, but are not limited to, the terms
“anticipate,” “potential,” “expect,” “believe,” “estimate” and similar words. Actual results may differ materially due to the speed and nature of increased
competition and deregulation in the electric utility industry, economic or weather conditions affecting future sales and margins, changes in markets for energy
services, changing energy and commodity market prices, replacement power costs being higher than anticipated or inadequately hedged, the continued ability of
our regulated utilities to collect transition and other charges or to recover increased transmission costs, maintenance costs being higher than anticipated,
legislative and regulatory changes (including revised environmental requirements), and the legal and regulatory changes resulting from the implementation of
the Energy Policy Act of 2005 (including, but not limited to, the repeal of the Public Utility Holding Company Act of 1935), the uncertainty of the timing and
amounts of the capital expenditures needed to, among other things, implement the Air Quality Compliance Plan (including that such amounts could be higher
than anticipated) or levels of emission reductions related to the Consent Decree resolving the New Source Review litigation, adverse regulatory or legal
decisions and outcomes (including, but not limited to, the revocation of necessary licenses or operating permits and oversight) by the Nuclear Regulatory
Commission and the various state public utility commissions as disclosed in our Securities and Exchange Commission filings, the timing and outcome of
various proceedings before the Public Utilities Commission of Ohio (PUCO) (including, but not limited to, the successful resolution of the issues remanded to
the PUCO by the Ohio Supreme Court regarding the Rate Stabilization Plan) and the PPUC (including the transition rate plan filings for Met-Ed and Penelec
and the Pennsylvania Power Company Default Service Plan filing), the continuing availability and operation of generating units, the ability of generating units
to continue to operate at, or near full capacity, the inability to accomplish or realize anticipated benefits from strategic goals (including employee workforce
initiatives), the anticipated benefits from voluntary pension plan contributions, the ability to improve electric commodity margins and to experience growth in
the distribution business, the ability to access the public securities and other capital markets and the cost of such capital, the outcome, cost and other effects of
present and potential legal and administrative proceedings and claims related to the August 14, 2003 regional power outage, the successful structuring and
completion of a potential sale and leaseback transaction for Bruce Mansfield Unit 1 currently under consideration by management, any purchase price
adjustment under the accelerated share repurchase program announced on March 2, 2007, the risks and other factors discussed from time to time in our
Securities and Exchange Commission filings, including our annual report on Form 10-K for the year ended December 31, 2006, and other similar factors. Also,
a security rating is not a recommendation to buy, sell or hold securities and it may be subject to revision or withdrawal at any time and each such rating should
be evaluated independently of any other rating. We expressly disclaim any current intention to update any forward-looking statements contained herein as a
result of new information, future events, or otherwise.
Consolidated Report to the Financial Community – 1st Quarter 2007 12