
Recomendados
Recomendados
Mais conteúdo relacionado
Mais procurados
Mais procurados (16)
Destaque
Destaque (20)
Semelhante a qwest communications 2Q 08 Financials
Semelhante a qwest communications 2Q 08 Financials (20)
Mais de finance19
Mais de finance19 (20)
Último
Último (20)
qwest communications 2Q 08 Financials
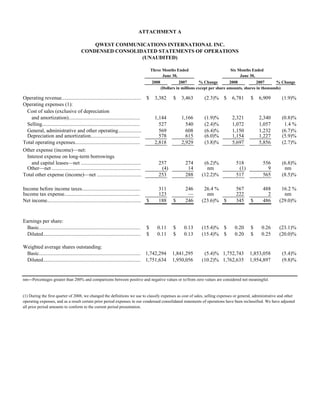
- 1. ATTACHMENT A QWEST COMMUNICATIONS INTERNATIONAL INC. CONDENSED CONSOLIDATED STATEMENTS OF OPERATIONS (UNAUDITED) Three Months Ended Six Months Ended June 30, June 30, 2008 2007 % Change 2008 2007 % Change (Dollars in millions except per share amounts, shares in thousands) Operating revenue............................................................. $ 3,382 $ 3,463 (2.3)% $ 6,781 $ 6,909 (1.9)% Operating expenses (1): Cost of sales (exclusive of depreciation and amortization)....................................................... 1,144 1,166 (1.9)% 2,321 2,340 (0.8)% Selling........................................................................... 527 540 (2.4)% 1,072 1,057 1.4 % General, administrative and other operating.................. 569 608 (6.4)% 1,150 1,232 (6.7)% Depreciation and amortization...................................... 578 615 (6.0)% 1,154 1,227 (5.9)% Total operating expenses.................................................. 2,818 2,929 (3.8)% 5,697 5,856 (2.7)% Other expense (income)—net: Interest expense on long-term borrowings and capital leases—net .............................................. 257 274 (6.2)% 518 556 (6.8)% Other—net .................................................................... (4) 14 nm (1) 9 nm Total other expense (income)—net .................................. 253 288 (12.2)% 517 565 (8.5)% Income before income taxes............................................. 311 246 26.4 % 567 488 16.2 % Income tax expense.......................................................... 123 — nm 222 2 nm Net income........................................................................ $ 188 $ 246 (23.6)% $ 345 $ 486 (29.0)% Earnings per share: Basic.............................................................................. $ 0.11 $ 0.13 (15.4)% $ 0.20 $ 0.26 (23.1)% Diluted........................................................................... $ 0.11 $ 0.13 (15.4)% $ 0.20 $ 0.25 (20.0)% Weighted average shares outstanding: Basic.............................................................................. 1,742,294 1,841,295 (5.4)% 1,752,743 1,853,058 (5.4)% Diluted........................................................................... 1,751,634 1,950,056 (10.2)% 1,762,635 1,954,897 (9.8)% nm—Percentages greater than 200% and comparisons between positive and negative values or to/from zero values are considered not meaningful. (1) During the first quarter of 2008, we changed the definitions we use to classify expenses as cost of sales, selling expenses or general, administrative and other operating expenses, and as a result certain prior period expenses in our condensed consolidated statements of operations have been reclassified. We have adjusted all prior period amounts to conform to the current period presentation.
- 2. ATTACHMENT B QWEST COMMUNICATIONS INTERNATIONAL INC. CONDENSED CONSOLIDATED BALANCE SHEETS (UNAUDITED) June 30, December 31, 2008 2007 (Dollars in millions) ASSETS Current assets: Cash and cash equivalents................................................................. $ 755 $ 902 Other................................................................................................. 2,503 2,671 Total current assets............................................................................... 3,258 3,573 Property, plant and equipment—net and other..................................... 18,636 18,959 Total assets........................................................................................... $ 21,894 $ 22,532 LIABILITIES AND STOCKHOLDERS' EQUITY Current liabilities: Current portion of long-term borrowings ......................................... $ 851 $ 601 Accounts payable and other.............................................................. 3,082 3,608 Total current liabilities......................................................................... 3,933 4,209 Long-term borrowings—net................................................................. 13,370 13,650 Other..................................................................................................... 4,088 4,110 Total liabilities..................................................................................... 21,391 21,969 Stockholders' equity ............................................................................ 503 563 Total liabilities and stockholders' equity.............................................. $ 21,894 $ 22,532
- 3. ATTACHMENT C QWEST COMMUNICATIONS INTERNATIONAL INC. CONDENSED CONSOLIDATED STATEMENTS OF CASH FLOWS (UNAUDITED) Six Months Ended June 30, 2008 2007 (Dollars in millions) Cash provided by operating activities.................................................. $ 1,297 $ 1,373 Cash used for investing activities......................................................... (901) (728) Cash used for financing activities......................................................... (543) (1,017) Decrease in cash and cash equivalents................................................. $ (147) $ (372)
- 4. ATTACHMENT D QWEST COMMUNICATIONS INTERNATIONAL INC. SELECTED CONSOLIDATED DATA (UNAUDITED) Three Months Ended June 30, 2008 2007 % Change (Dollars in millions) Operating revenue (1): Segment revenue: Business markets: Voice services............................................................................... $ 371 $ 383 (3.1)% Data and Internet services............................................................. 644 587 9.7 % Total business markets..................................................................... 1,015 970 4.6 % Mass markets: Voice services............................................................................... 988 1,074 (8.0)% Data, Internet and video services.................................................. 339 289 17.3 % Wireless services........................................................................... 125 133 (6.0)% Total mass markets........................................................................... 1,452 1,496 (2.9)% Wholesale markets: Voice services............................................................................... 453 526 (13.9)% Data and Internet services............................................................. 370 371 (0.3)% Total wholesale markets................................................................... 823 897 (8.2)% Total segment operating revenue......................................................... 3,290 3,363 (2.2)% Other revenue (primarily USF surcharges) ......................................... 92 100 (8.0)% Total operating revenue ......................................................................... $ 3,382 $ 3,463 (2.3)% Segment margins (1): Business markets................................................................................. 38.8% 39.9% Mass markets....................................................................................... 49.9% 48.5% Wholesale markets............................................................................... 57.4% 58.1% Capital expenditures (2):......................................................................... $ 534 $ 426 25.4 % As of June 30, 2008 2007 % Change (Amounts in thousands, except for employees) Operating metrics: Total employees.................................................................................. 35,111 37,585 (6.6)% Access lines (1): Business markets.............................................................................. 2,721 2,830 (3.9)% Mass markets.................................................................................... 8,258 9,057 (8.8)% Wholesale markets (3)...................................................................... 1,210 1,385 (12.6)% Total access lines................................................................................. 12,189 13,272 (8.2)% Mass markets connections: Access lines (1): Consumer primary lines................................................................ 6,339 7,015 (9.6)% Consumer additional lines............................................................. 603 713 (15.4)% Small business lines...................................................................... 1,316 1,329 (1.0)% Total access lines............................................................................. 8,258 9,057 (8.8)% Other connections: Broadband subscribers (4)............................................................ 2,732 2,405 13.6 % Video subscribers (4).................................................................... 722 554 30.3 % Wireless subscribers..................................................................... 811 807 0.5 % Total other connections.................................................................... 4,265 3,766 13.3 % Total mass markets connections.......................................................... 12,523 12,823 (2.3)% Three Months Ended June 30, 2008 2007 % Change Consumer ARPU (in dollars) (5):........................................................ $ 55 $ 52 5.8 % Wholesale minutes of use from carriers and CLECs (in millions)....... 9,986 10,859 (8.0)%
- 5. ATTACHMENT D (CONTINUED) QWEST COMMUNICATIONS INTERNATIONAL INC. SELECTED CONSOLIDATED DATA (UNAUDITED) (1) During the first quarter of 2008, we changed our segments. Our new segments are business markets, mass markets and wholesale markets. We centrally manage revenue from USF (Universal Service Fund) surcharges, consequently, it is not assigned to any of our segments. We have adjusted all prior period revenue amounts to conform to the current period presentation. We have also adjusted access line amounts to conform to this new presentation. Segment margin represents segment income as as a percentage of segment revenue. Segment income is net of direct costs incurred by the segment, such as segment specific employee-costs, bad debt, equipment sales costs and other non-employee related costs. Additionally, we assign other expenses to the segments using an activity-based costing methodology. Assigned expenses include network expenses, facility costs, and various other costs. (2) Capital expenditures exclude assets acquired through capital leases. (3) Wholesale markets access lines include UNE (Unbundled Network Elements) lines. (4) Broadband and video subscribers include certain business markets customers. (5) Consumer ARPU (Average Revenue Per Unit) is measured as consumer revenue, which includes revenue from voice services, data, Internet and video services, in the period divided by the average number of primary access lines for the period. We believe this metric can be a useful measure of the revenue performance of our consumer business within our mass markets segment on a per-customer basis. We use ARPU internally to assess the revenue performance of our consumer business within our mass markets segment and the impact on this business of periodic customer initiatives and product roll-outs. ARPU is not a measure determined in accordance with accounting principles generally accepted in the United States of America, or GAAP, and should not be considered as a substitute for our mass markets segment revenue or any other measure determined in accordance with GAAP. During the first quarter of 2008, we revised the consumer ARPU calculation to exclude Universal Service Fund revenue, which was previously reported in voice services revenue. This change is consistent with our current presentation of segment revenue described above. We have adjusted all prior period amounts to conform to the current period presentation.
- 6. ATTACHMENT E QWEST COMMUNICATIONS INTERNATIONAL INC. RECONCILIATION OF NON-GAAP FINANCIAL MEASURES (UNAUDITED) Three Months Ended Six Months Ended June 30, June 30, 2008 2007 2008 2007 (Dollars in millions) Operating revenue.............................................................................................. $ 3,382 $ 3,463 $ 6,781 $ 6,909 Cost of sales (exclusive of depreciation and amortization) ............................. (1,144) (1,166) (2,321) (2,340) Selling expenses................................................................................................. (527) (540) (1,072) (1,057) General, administrative and other operating expenses...................................... (569) (608) (1,150) (1,232) EBITDA (1)........................................................................................................ $ 1,142 $ 1,149 $ 2,238 $ 2,280 EBITDA—as adjusted (1): ............................................................................. $ 1,142 $ 1,149 $ 2,283 $ 2,320 Less: Legal reserve.......................................................................................... (40) — (40) (40) Less: Property tax settlement.......................................................................... 40 — 40 — Less: Realignment, severance and related costs............................................ — — (45) — EBITDA (1):..................................................................................................... 1,142 1,149 2,238 2,280 Depreciation and amortization....................................................................... (578) (615) (1,154) (1,227) Total other expense (income)—net ............................................................... (253) (288) (517) (565) Income tax expense......................................................................................... (123) — (222) (2) Net income...................................................................................................... $ 188 $ 246 $ 345 $ 486 EBITDA margin—as adjusted (1): EBITDA—as adjusted ................................................................................... $ 1,142 $ 1,149 $ 2,283 $ 2,320 Divided by total operating revenue................................................................ $ 3,382 $ 3,463 $ 6,781 $ 6,909 EBITDA margin—as adjusted ...................................................................... 33.8% 33.2% 33.7% 33.6% EBITDA margin (1): EBITDA.......................................................................................................... $ 1,142 $ 1,149 $ 2,238 $ 2,280 Divided by total operating revenue................................................................ $ 3,382 $ 3,463 $ 6,781 $ 6,909 EBITDA margin.............................................................................................. 33.8% 33.2% 33.0% 33.0% Free cash flow from operations (2): Cash provided by operating activities............................................................ $ 909 $ 1,105 $ 1,297 $ 1,373 Less: expenditures for property, plant and equipment and capitalized software.................................................... (534) (426) (950) (744) Free cash flow from operations...................................................................... 375 679 347 629 Add: certain one-time settlement payments .................................................. 85 — 169 200 Adjusted free cash flow from operations....................................................... $ 460 $ 679 $ 516 $ 829
- 7. ATTACHMENT E (CONTINUED) QWEST COMMUNICATIONS INTERNATIONAL INC. RECONCILIATION OF NON-GAAP FINANCIAL MEASURES (UNAUDITED) As of June 30, 2008 2007 (Dollars in millions) Net debt (3): Current portion of long-term borrowings....................................................... $ 851 $ 1,304 Long-term borrowings—net........................................................................... 13,370 13,207 Total borrowings—net.................................................................................... 14,221 14,511 Less: cash and cash equivalents .................................................................... (755) (869) Less: short-term investments.......................................................................... (36) (240) Less: long-term investments........................................................................... (119) — Net debt........................................................................................................... $ 13,311 $ 13,402 (1) EBITDA, EBITDA margin, EBITDA—as adjusted and EBITDA margin—as adjusted are non-GAAP financial measures. Other companies may calculate these measures (or similarly titled measures) differently. We believe these measures provide useful information to investors in evaluating our capital-intensive business because they reflect our operating performance before the impacts of non-cash items and are indicators of our ability to service debt, pay taxes and fund discretionary spending such as capital expenditures. Management also uses EBITDA for a number of purposes, including setting targets for compensation and assessing the performance of our operations. (2) Free cash flow and adjusted free cash flow from operations are non-GAAP financial measures that indicate cash generated by our business after operating expenses, capital expenditures, interest expense and income tax expense. We believe these measures provide useful information to our investors for purposes of evaluating our ability to satisfy our debt and other mandatory payment obligations and because they reflect cash flows available for financing activities, voluntary debt repayment and to strengthen our balance sheet. This is of particular relevance for our business given our significant debt balance. We also use free cash flow and adjusted free cash flow from operations internally for a variety of purposes, including setting targets for compensation and budgeting our cash needs. These measures are not determined in accordance with GAAP and should not be considered as a substitute for “income before income taxes” or “cash provided by operating activities” or any other measure determined in accordance with GAAP. Due to the forward-looking nature of expected free cash flow amounts for 2008, information to reconcile this non-GAAP financial measure is not available at this time. (3) Net debt is a non-GAAP financial measure that we calculate as our total borrowings (current plus long-term) less our cash and cash equivalents and short- and long-term investments. We believe net debt is helpful in analyzing our leverage, and management uses this measure in making decisions regarding potential financings. Net debt is not a measure determined in accordance with GAAP and should not be considered as a substitute for “current portion of long-term borrowings” or “long-term borrowings” or any other measure determined in accordance with GAAP.