
Recomendados
Mais conteúdo relacionado
Mais procurados
Mais procurados (16)
Destaque
Semelhante a Reconciliation of GAAP to Non-GAAP Financial Measures
Semelhante a Reconciliation of GAAP to Non-GAAP Financial Measures (20)
Mais de finance13
Mais de finance13 (20)
Último
Último (20)
Reconciliation of GAAP to Non-GAAP Financial Measures
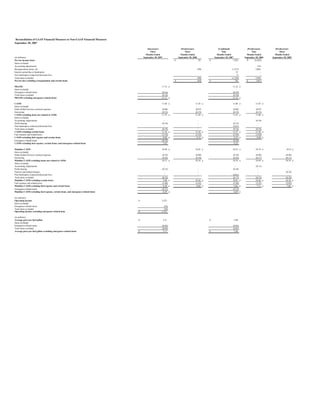
- 1. Reconciliation of GAAP Financial Measures to Non-GAAP Financial Measures September 30, 2007 (Successor) (Predecessor) (Combined) (Predecessor) (Predecessor) Three Three Nine Nine Three Months Ended Months Ended Months Ended Months Ended Months Ended (in millions) September 30, 2007 September 30, 2006 September 30, 2007 September 30, 2006 September 30, 2005 Pre-tax income (loss) $ 29 $ 1,924 $ (4,262) Items excluded Accounting adjustments 310 Reorganization items, net (98) (1,215) 3,685 Interest earned due to bankruptcy 12 - Post bankruptcy-related professional fees 9 - Total items excluded (98) (1,194) 3,995 Pre-tax loss excluding reorganization and certain items $ (69) $ 730 $ (267) PRASM 11.33 ¢ 11.25 ¢ Items excluded: Emergence-related items (0.16) (0.10) Total items excluded (0.16) (0.10) PRASM excluding emergence-related items 11.17 ¢ 11.15 ¢ CASM 11.66 ¢ 11.56 ¢ 11.69 ¢ 11.82 ¢ Items excluded: Delta Global Services external expenses (0.08) (0.07) (0.09) (0.07) Insourcing (0.23) (0.15) (0.19) (0.15) CASM excluding items not related to ASMs 11.35 ¢ 11.34 ¢ 11.41 ¢ 11.60 ¢ Items excluded: Accounting Adjustments - - - (0.10) Profit sharing (0.19) - (0.13) - Post bankruptcy-related professional fees - - (0.01) Total items excluded (0.19) - (0.14) (0.10) CASM excluding certain items 11.16 ¢ 11.34 ¢ 11.27 ¢ 11.50 ¢ Fuel expense and related taxes (3.10) (3.22) (2.92) (3.02) CASM excluding fuel expense and certain items 8.06 ¢ 8.12 ¢ 8.35 ¢ 8.48 ¢ Emergence-related items (0.19) (0.10) CASM excluding fuel expense, certain items, and emergence-related items 7.87 8.25 Mainline CASM 10.49 ¢ 10.42 ¢ 10.52 ¢ 10.74 ¢ 10.51 ¢ Items excluded: Delta Global Services external expenses (0.10) (0.08) (0.10) (0.08) (0.06) Insourcing (0.26) (0.18) (0.24) (0.17) (0.11) Mainline CASM excluding items not related to ASMs 10.13 ¢ 10.16 ¢ 10.18 ¢ 10.49 ¢ 10.34 ¢ Items excluded: Accounting Adjustments - - - (0.13) - Profit sharing (0.23) - (0.16) - - Pension and related charges - - - - (0.24) Post bankruptcy-related professional fees - - (0.01) - - Total items excluded (0.23) - (0.17) (0.13) (0.24) Mainline CASM excluding certain items 9.90 ¢ 10.16 ¢ 10.01 ¢ 10.36 ¢ 10.10 ¢ Fuel expense and related taxes (3.40) (3.47) (3.20) (3.25) (3.05) Mainline CASM excluding fuel expense and certain items 6.50 ¢ 6.69 ¢ 6.81 ¢ 7.11 ¢ 7.05 ¢ Emergence-related items (0.21) (0.12) Mainline CASM excluding fuel expense, certain items, and emergence-related items 6.29 ¢ 6.69 ¢ (in millions) Operating income $ 5,227 Items excluded: Emergence-related items (76) Total items excluded (76) Operating income excluding emergence-related item $ 5,151 (in millions) Average price per fuel gallon $ 2.21 $ 2.09 Items excluded: Emergence-related items (0.04) (0.03) Total items excluded (0.04) (0.03) Average price per fuel gallon excluding emergence-related items $ 2.17 $ 2.06
- 2. (in millions) EBITDAR and EBITDAR Margin Net income as reported $ 220 Items excluded: Non-operating expenses 90 Income taxes 143 Depreciation and amortization 297 Aircraft rent 60 Emergence-related items 16 Total items excluded 606 EBITDAR excluding reorganization, certain items and emergence-related items $ 826 EBITDAR margin excluding reorganization, certain items and emergence-related items 16% (Combined) (Predecessor) Eight Year Months Ended Ended August 31, 2007 December 31, 2005 PRASM 11.33 ¢ 9.31 ¢ Accounting Adjustment - - PRASM excluding accounting adjustment 11.33 ¢ 9.31 ¢ Adjustment for charter revenue (0.15) (0.05) PRASM excluding charter revenue 11.18 ¢ 9.26 ¢ Length of haul adjustment (0.17) (0.64) Length of Haul adjusted PRASM excluding special items and charter revenue 11.01 ¢ 8.62 ¢ Industry average PRASM 11.50 ¢ 9.93 ¢ Percentage of industry average 96% 86% Forecast (Successor) (Predecessor) (Predecessor) (in millions) December 31, 2007 September 30, 2005 June 30, 2005 Adjusted Net Debt Debt and capital lease obligations $ 8,906 $ 7,592 $ 14,082 Plus 7x LTM aircraft rent 1,721 4,249 4,529 Adjusted total debt $ 10,627 $ 11,841 $ 18,611 Less: Cash and cash equivalentsand short-term investments (2,940) (1,361) (1,671) Adjusted net debt $ 7,687 $ 10,480 $ 16,940 (Predecessor) (Predecessor) Year Year Ended Ended December 31, 2006 December 31, 2005 (in millions) Free Cash Flow Net cash provided by (used in) operating activities $ 993 $ (307) Net cash (used in) provided by investing activities (361) 22 Adjustment: Proceeds from sale of ASA - (417) Change in Short-term investments 614 (336) Total Free Cash Flow $ 1,246 $ (1,038) (Successor) (Predecessor) ` Five Months Four Months Ended Ended September 30, 2007 April 30, 2007 Revenue Passenger Miles (RPMs) Consolidated 55,791 37,036 Mainline 47,530 31,288 Available Seat Miles (ASMs) Consolidated 67,013 47,337 Mainline 56,724 39,667
- 3. Three Months Ended September 30, 1997 1998 1999 2000 2001 2002 2003 2004 2005 2006 2007 September Quarter Pre-Tax Income Trend Pre tax income $ 418 $ 538 $ 569 $ 392 $ (408) $ (527) $ (254) $ (652) $ (1,107) $ 29 $ 363 Items excluded: Accounting adjustments - - - - - - - 54 85 - - Pensions settlements, asset writedowns, restructuring and related items, net - - 149 22 68 225 - - - - - Gain on sale of investments - - (252) - (11) - - - - - - Early extinguishment of long-term debt - - - - - - (15) - - - - Stabiliazation Act compensation - - - - (171) (34) - - - - - Gain on equity investments - - - (16) - - - - - - - Reorganization expense, net - - - - - - - - 607 (98) - Total items excluded $ - $ - $ (103) $ 6 $ (114) $ 191 $ (15) $ 54 $ 692 $ (98) $ - Pre-tax income (loss) excluding reorganization and certain items $ 418 $ 538 $ 466 $ 398 $ (522) $ (336) $ (269) $ (598) $ (415) $ (69) $ 363 Pre-tax income (loss) excluding reorganization and certain items $ 418 $ 538 $ 466 $ 398 $ (522) $ (336) $ (269) $ (598) $ (415) $ (69) $ 363 Add: fuel expense, including contract carriers 459 389 413 577 513 518 542 863 1,301 1,489 - Less: fuel expense, including contract carriers (at 2007 price of $2.21 per gallon) 1,559 1,611 1,615 1,688 1,519 1,497 1,422 1,522 1,535 1,466 - Adjusted pre-tax income (loss) $ (682) $ (684) $ (736) $ (713) $ (1,528) $ (1,315) $ (1,149) $ (1,257) $ (649) $ (46) $ 363
- 4. Note: In connection with its emergence from bankruptcy on April 30, 2007, Delta adopted fresh start reporting in accordance with American Institute of Certified Public Accountants’ Statement of Position 90-7, “Financial Reporting by Entities in Reorganization under the Bankruptcy Code.” The adoption of fresh start reporting results in Delta’s becoming a new entity for financial reporting purposes. Accordingly, Delta’s consolidated financial statements after April 30, 2007 are not comparable to its financial statements for any period prior to emergence. However, to provide a basis of comparison to prior year results, Delta has combined the results for the four months ended April 30, 2007 with the five months ended September 30, 2007. The above tables show a reconciliation of certain combined GAAP measures adjusted for the following items: • Cost per available seat mile (CASM) excludes $125 million and $89 million for the three months ended September 30, 2007 and 2006, respectively, and $322 million and $241 million for the nine months ended September 30, 2007 and 2006, respectively, in expenses related to providing maintenance and staffing services to third parties as these costs are not associated with the generation of a seat mile. • Delta excludes reorganization and related and certain items because management believes the exclusion of these items is helpful to investors to evaluate the company’s recurring operational performance. • Passenger revenue per available seat mile (PRASM) excludes the impact of fresh start reporting as management believes the exclusion of this item is helpful to investors to evaluate the company's recurring operational performance • Delta presents length-of-haul adjusted PRASM excluding charter revenue because management believes this provides a more meaningful comparison of the company’s PRASM to the industry. • Delta presents mainline cost per available seat mile (CASM) excluding fuel expense because management believes high fuel prices mask the progress that achieved toward it business plan targets. • EBITDAR has been presented as management believes it is helpful to investors in utilizing EBITDAR as a proxy for operating cash flow on a period over period basis. • Delta uses adjusted total debt, including aircraft rent, in addition to long-term adjusted debt and capital leases, to present estimated financial obligations. Delta reduces total debt by cash and cash equivalents and short-term investments, to present the amount of additional assets needed to satisfy the debt. • Delta presents quarterly pre-tax income trend adjusted for 2007 fuel prices as management believes this provides a more meaningful comparision versus prior years. • Delta presents free cash flow because management believes this metric is helpful to investors to evaluate factors causing changes in the company’s liquidity position.