1. Deere & Company
Other Financial Information
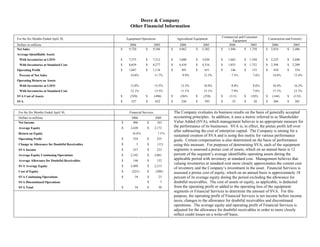
Commercial and Consumer
For the Six Months Ended April 30, Equipment Operations Agricultural Equipment Construction and Forestry
Equipment
Dollars in millions 2006 2005 2006 2005 2006 2005 2006 2005
$ 9,720 $ 9,546 $ 4,962 $ 5,302 $ 1,948 $ 1,758 $ 2,810 $ 2,486
Net Sales
Average Identifiable Assets
$ 7,573 $ 7,212 $ 3,686 $ 3,620 $ 1,662 $ 1,544 $ 2,225 $ 2,048
With Inventories at LIFO
$ 8,659 $ 8,277 $ 4,410 $ 4,316 $ 1,855 $ 1,752 $ 2,394 $ 2,209
With Inventories at Standard Cost
$ 1,047 $ 1,118 $ 491 $ 651 $ 146 $ 133 $ 410 $ 334
Operating Profit
10.8% 11.7% 9.9% 12.3% 7.5% 7.6% 14.6% 13.4%
Percent of Net Sales
Operating Return on Assets
13.8% 15.5% 13.3% 18.0% 8.8% 8.6% 18.4% 16.3%
With Inventories at LIFO
12.1% 13.5% 11.1% 15.1% 7.9% 7.6% 17.1% 15.1%
With Inventories at Standard Cost
$ (520) $ (496) $ (265) $ (258) $ (111) $ (105) $ (144) $ (133)
SVA Cost of Assets
$ 527 $ 622 $ 226 $ 393 $ 35 $ 28 $ 266 $ 201
SVA
The Company evaluates its business results on the basis of generally accepted
For the Six Months Ended April 30, Financial Services
accounting principles. In addition, it uses a metric referred to as Shareholder
Dollars in millions 2006 2005
Value Added (SVA), which management believes is an appropriate measure for
$ 406 $ 163
Net Income
the performance of its businesses. SVA is, in effect, the pretax profit left over
$ 2,420 $ 2,172
Average Equity
after subtracting the cost of enterprise capital. The Company is aiming for a
16.8% 7.5%
Return on Equity
sustained creation of SVA and is using this metric for various performance
$ 254 $ 235
Operating Profit goals. Certain compensation is also determined on the basis of performance
$ 3 $ (12)
Change in Allowance for Doubtful Receivables using this measure. For purposes of determining SVA, each of the equipment
segments is assessed a pretax cost of assets, which on an annual basis is 12
$ 257 $ 223
SVA Income
percent of the segment’s average identifiable operating assets during the
$ 2,342 $ 2,061
Average Equity Continuing Operations
applicable period with inventory at standard cost. Management believes that
$ 146 $ 152
Average Allowance for Doubtful Receivables
valuing inventories at standard cost more closely approximates the current cost
$ 2,488 $ 2,213
SVA Average Equity
of inventory and the Company’s investment in the asset. Financial Services is
$ (223) $ (200)
Cost of Equity assessed a pretax cost of equity, which on an annual basis is approximately 18
$ 34 $ 23 percent of its average equity during the period excluding the allowance for
SVA Continuing Operations
doubtful receivables. The cost of assets or equity, as applicable, is deducted
$ 7
SVA Discontinued Operations
from the operating profit or added to the operating loss of the equipment
$ 34 $ 30
SVA Total
segments or Financial Services to determine the amount of SVA. For this
purpose, the operating profit of Financial Services is net income before income
taxes, changes to the allowance for doubtful receivables and discontinued
operations. The average equity and operating profit of Financial Services is
adjusted for the allowance for doubtful receivables in order to more closely
reflect credit losses on a write-off basis.