
Recomendados
Mais conteúdo relacionado
Mais procurados
Mais procurados (16)
Destaque
Semelhante a conoco phillips 2007Third Quarter
Semelhante a conoco phillips 2007Third Quarter (20)
Mais de finance1
Mais de finance1 (20)
Último
Último (20)
conoco phillips 2007Third Quarter
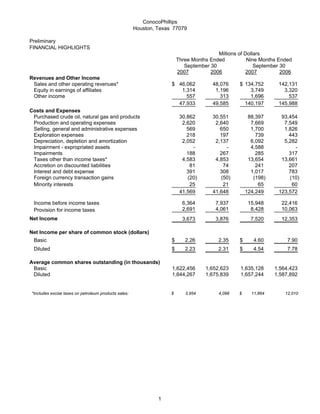
- 1. ConocoPhillips Houston, Texas 77079 Preliminary FINANCIAL HIGHLIGHTS Millions of Dollars Three Months Ended Nine Months Ended September 30 September 30 2007 2006 2007 2006 Revenues and Other Income Sales and other operating revenues* $ 46,062 48,076 $ 134,752 142,131 Equity in earnings of affiliates 1,314 1,196 3,749 3,320 Other income 557 313 1,696 537 47,933 49,585 140,197 145,988 Costs and Expenses Purchased crude oil, natural gas and products 30,862 30,551 88,397 93,454 Production and operating expenses 2,620 2,640 7,669 7,549 Selling, general and administrative expenses 569 650 1,700 1,826 Exploration expenses 218 197 739 443 Depreciation, depletion and amortization 2,052 2,137 6,092 5,282 Impairment - expropriated assets - - 4,588 - Impairments 188 267 285 317 Taxes other than income taxes* 4,583 4,853 13,654 13,661 Accretion on discounted liabilities 81 74 241 207 Interest and debt expense 391 308 1,017 783 Foreign currency transaction gains (20) (50) (198) (10) Minority interests 25 21 65 60 41,569 41,648 124,249 123,572 Income before income taxes 6,364 7,937 15,948 22,416 2,691 4,061 8,428 10,063 Provision for income taxes Net Income 3,673 3,876 7,520 12,353 Net Income per share of common stock (dollars) Basic $ 2.26 2.35 $ 4.60 7.90 Diluted $ 2.23 2.31 $ 4.54 7.78 Average common shares outstanding (in thousands) Basic 1,622,456 1,652,623 1,635,128 1,564,423 Diluted 1,644,267 1,675,839 1,657,244 1,587,892 *Includes excise taxes on petroleum products sales: $ 3,954 4,098 $ 11,864 12,010 1
- 2. ConocoPhillips Houston, Texas 77079 Preliminary SELECTED FINANCIAL DATA Millions of Dollars Three Months Ended Nine Months Ended September 30 September 30 2007 2006 2007 2006 SUMMARY OF NET INCOME (LOSS) E&P United States $ 1,225 995 $ 3,196 3,476 International 857 909 (1,189) 4,285 Total E&P 2,082 1,904 2,007 7,761 Midstream 104 169 291 387 R&M United States 873 1,444 3,648 3,174 International 434 20 1,153 388 Total R&M 1,307 1,464 4,801 3,562 LUKOIL Investment 387 487 1,169 1,123 Chemicals 110 142 260 394 Emerging Businesses 3 11 (10) 7 Corporate and other (320) (301) (998) (881) Consolidated $ 3,673 3,876 $ 7,520 12,353 2
- 3. ConocoPhillips Houston, Texas 77079 Preliminary SELECTED FINANCIAL DATA Three Months Ended Nine Months Ended September 30 September 30 2007 2006 2007 2006 Effective tax rate % 42.3 % 51.2 52.8 % 44.9 Millions of Dollars FOREIGN CURRENCY GAINS (LOSSES) AFTER-TAX E&P $ 13 (20) $ 182 (47) Midstream - - (1) - R&M - (6) (2) 25 LUKOIL Investment 3 1 3 2 Chemicals - - - - Emerging Businesses 1 - 1 - Corporate and other (35) 48 (65) 4 $ (18) 23 $ 118 (16) CASH FLOWS FROM OPERATING ACTIVITIES Net Income $ 3,673 3,876 $ 7,520 12,353 Depreciation, depletion and amortization 2,052 2,137 6,092 5,282 Impairment - expropriated assets - - 4,588 - Impairments 188 267 285 317 Dry hole costs and leasehold impairments 74 56 355 141 Accretion on discounted liabilities 81 74 241 207 Deferred taxes (125) 495 55 273 Undistributed equity earnings (237) (253) (1,472) (1,007) Gain on asset dispositions (389) (8) (1,316) (64) Other (60) (282) 28 (296) Working capital adjustments 734 (127) 1,254 (1,327) Net cash provided by operating activities $ 5,991 6,235 $ 17,630 15,879 CAPITAL EXPENDITURES AND INVESTMENTS E&P United States $ 840 828 $ 2,556 2,003 International 1,337 1,626 4,339 4,829 2,177 2,454 6,895 6,832 Midstream - - 2 2 R&M 276 374 752 2,484 LUKOIL Investment - 702 - 1,962 Chemicals - - - - Emerging Businesses 62 6 127 46 Corporate and other 45 61 131 187 $ 2,560 3,597 $ 7,907 11,513 OTHER At September 30, 2007 At December 31, 2006 Total debt $21,876 27,134 Common stockholders' equity $86,933 82,646 3
- 4. ConocoPhillips Houston, Texas 77079 Preliminary OPERATING HIGHLIGHTS BY SEGMENT Three Months Ended Nine Months Ended September 30 September 30 2007 2006 2007 2006 Thousands of Barrels Daily E&P Crude oil produced United States Alaska 241 234 261 265 Lower 48 103 119 104 101 344 353 365 366 Norway 166 190 163 190 United Kingdom 37 50 47 56 Canada 17 26 19 25 China 29 36 33 32 Indonesia 11 11 12 13 Vietnam 22 24 22 25 Timor Sea 21 40 24 39 Libya 48 71 47 49 Other 35 64 43 60 Total consolidated 730 865 775 855 Equity affiliates Canada 29 - 27 - Russia 15 15 15 15 Venezuela - 89 56 102 Total Worldwide 774 969 873 972 Syncrude 27 23 24 20 Natural gas liquids produced United States Alaska* 15 11 18 18 Lower 48 73 75 71 58 88 86 89 76 Norway 7 9 7 9 United Kingdom 4 2 5 3 Canada 26 28 29 23 Timor Sea 11 20 12 20 Other 3 1 3 1 Total Worldwide 139 146 145 132 11 7 14 11 *Includes reinjected volumes sold lease-to-lease. Millions of Cubic Feet Daily Natural gas produced* United States Alaska 116 123 113 150 Lower 48 2,219 2,320 2,210 1,953 2,335 2,443 2,323 2,103 Norway 226 260 225 263 United Kingdom 519 665 656 770 Canada 1,069 1,154 1,118 930 China 13 8 12 6 Timor Sea 194 300 229 232 Indonesia 349 342 336 320 Vietnam 19 20 15 21 Libya 9 - 7 - Other 183 187 195 173 Total consolidated 4,916 5,379 5,116 4,818 Equity affiliates Venezuela - 8 6 9 Total Worldwide 4,916 5,387 5,122 4,827 *Represents quantities available for sale. Excludes gas equivalent of NGL shown above. Liquefied natural gas sales 436 522 483 407 LUKOIL Investment Production (MBOE/D)* 432 436 450 388 Refinery crude oil throughput (MB/D)* 226 164 210 165 *Represents our estimated net share of LUKOIL. 4
- 5. ConocoPhillips Houston, Texas 77079 Preliminary OPERATING HIGHLIGHTS Three Months Ended Nine Months Ended September 30 September 30 2007 2006 2007 2006 E&P Per Unit Average sales prices Crude oil (per barrel) United States Alaska $ 73.57 69.66 $ 64.29 64.48 Lower 48 67.77 62.45 58.57 59.21 Total U.S. 72.00 67.25 62.70 63.05 International 74.03 67.45 65.19 65.27 Total consolidated 73.01 67.37 63.99 64.30 Equity affiliates* 44.60 46.98 44.30 47.36 Total Worldwide 71.34 65.04 61.80 62.18 Natural gas (per MCF) United States Alaska 2.15 3.36 3.50 3.47 Lower 48 5.38 6.00 6.03 6.25 Total U.S. 5.36 5.98 6.01 6.21 International 5.75 5.87 6.24 6.23 Total consolidated 5.56 5.92 6.13 6.22 Equity affiliates* - 0.32 0.30 0.30 Total Worldwide 5.56 5.91 6.13 6.21 *Excludes our equity share of LUKOIL reported in the LUKOIL Investment segment. Midstream Thousands of Barrels Daily Natural gas liquids extracted Consolidated United States 26 23 21 23 International - - - - Equity affiliates United States 182 180 179 180 International 8 7 8 6 216 210 208 209 Per Barrel U.S. product prices Weighted average NGL** Consolidated $ 48.62 44.10 $ 43.85 41.16 DCP 47.73 43.00 42.86 40.49 **Prices are based on index prices from the Mont Belvieu and Conway market hubs that are weighted by natural gas liquids component and location mix. 5
- 6. ConocoPhillips Houston, Texas 77079 Three Months Ended Nine Months Ended September 30 September 30 2007 2006 2007 2006 Thousands of Barrels Daily Thousands of Barrels Daily R&M United States* Crude oil capacity** 2,037 2,208 2,034 2,208 Crude oil runs 1,980 2,127 1,938 1,990 Refinery production 2,177 2,334 2,139 2,173 International* Crude oil capacity** 687 693 693 637 Crude oil runs 574 617 616 586 Refinery production 593 643 634 613 U.S. petroleum products sales volumes Gasoline 1,212 1,369 1,256 1,309 Distillates 869 848 853 827 Other products 439 519 473 530 2,520 2,736 2,582 2,666 International 629 749 694 772 3,149 3,485 3,276 3,438 Per Gallon Per Gallon U.S. average sales prices*** Gasoline-wholesale $ 2.32 2.27 $ 2.23 2.13 Gasoline-retail 2.43 2.46 2.38 2.28 Distillates-wholesale 2.36 2.31 2.18 2.15 *Includes ConocoPhillips' share of equity affiliates, except for our share of LUKOIL, which is reported in the LUKOIL Investment segment. **Weighted-average crude oil capacity for the three-and nine-month periods. Actual capacity at September 30, 2007 and 2006, was 2,037,000 and 2,208,000 barrels per day, respectively, for our domestic refineries, 669,000 and 693,000 barrels per day, respectively, for our international refineries and 2,706,000 and 2,901,000 barrels per day, respectively, worldwide. ***Excludes excise taxes. 6