Call Girls in New Ashok Nagar, (delhi) call me [9953056974] escort service 24X7
conoco phillips 2006Fourth Quarter
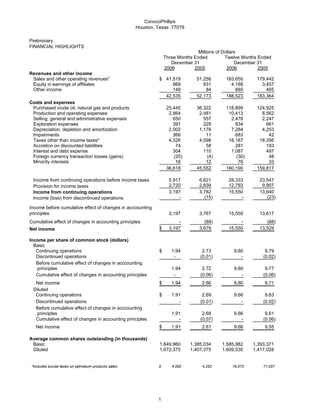
1. ConocoPhillips
Houston, Texas 77079
Preliminary
FINANCIAL HIGHLIGHTS
Millions of Dollars
Three Months Ended Twelve Months Ended
December 31 December 31
2006 2005 2006 2005
Revenues and other income
Sales and other operating revenues* $ 41,519 51,258 183,650 179,442
Equity in earnings of affiliates 868 831 4,188 3,457
Other income 148 84 685 465
42,535 52,173 188,523 183,364
Costs and expenses
Purchased crude oil, natural gas and products 25,445 36,322 118,899 124,925
Production and operating expenses 2,864 2,481 10,413 8,562
Selling, general and administrative expenses 650 557 2,476 2,247
Exploration expenses 391 229 834 661
Depreciation, depletion and amortization 2,002 1,178 7,284 4,253
Impairments 366 11 683 42
Taxes other than income taxes* 4,526 4,598 18,187 18,356
Accretion on discounted liabilities 74 58 281 193
Interest and debt expense 304 110 1,087 497
Foreign currency transaction losses (gains) (20) (4) (30) 48
Minority interests 16 12 76 33
36,618 45,552 160,190 159,817
Income from continuing operations before income taxes 5,917 6,621 28,333 23,547
2,720 2,839 12,783 9,907
Provision for income taxes
3,197 3,782 15,550 13,640
Income from continuing operations
- (15) - (23)
Income (loss) from discontinued operations
Income before cumulative effect of changes in acccounting
principles 3,197 3,767 15,550 13,617
Cumulative effect of changes in accounting principles - (88) - (88)
$ 3,197 3,679 15,550 13,529
Net income
Income per share of common stock (dollars)
Basic
Continuing operations $ 1.94 2.73 9.80 9.79
Discontinued operations - (0.01) - (0.02)
Before cumulative effect of changes in acccounting
principles 1.94 2.72 9.80 9.77
Cumulative effect of changes in accounting principles - (0.06) - (0.06)
Net income $ 1.94 2.66 9.80 9.71
Diluted
Continuing operations $ 1.91 2.69 9.66 9.63
Discontinued operations - (0.01) - (0.02)
Before cumulative effect of changes in acccounting
principles 1.91 2.68 9.66 9.61
Cumulative effect of changes in accounting principles - (0.07) - (0.06)
Net income $ 1.91 2.61 9.66 9.55
Average common shares outstanding (in thousands)
Basic 1,649,960 1,385,034 1,585,982 1,393,371
Diluted 1,672,375 1,407,375 1,609,530 1,417,028
*Includes excise taxes on petroleum products sales: $ 4,062 4,252 16,072 17,037
1
2. ConocoPhillips
Houston, Texas 77079
Preliminary
SELECTED FINANCIAL DATA
Millions of Dollars
Three Months Ended Twelve Months Ended
December 31 December 31
2006 2005 2006 2005
INCOME (LOSS) FROM CONTINUING OPERATIONS
E&P
United States $ 872 1,325 4,348 4,290
International 1,215 1,105 5,500 4,144
Total E&P 2,087 2,430 9,848 8,434
Midstream 89 147 476 688
R&M
United States 741 805 3,915 3,407
International 178 251 566 849
Total R&M 919 1,056 4,481 4,256
LUKOIL Investment 302 189 1,425 714
Chemicals 98 114 492 323
Emerging Businesses 8 (4) 15 (20)
Corporate and other (306) (150) (1,187) (755)
Consolidated $ 3,197 3,782 15,550 13,640
INCOME (LOSS) FROM DISCONTINUED OPERATIONS
Corporate and other (15) - (23)
$ -
CUMULATIVE EFFECT OF ACCOUNTING CHANGES
E&P
-
United States $ - (2) (2)
- (2) - (2)
International
- (4) - (4)
Total E&P
- - - -
Midstream
R&M
United States - (78) - (78)
- (5) - (5)
International
- (83) - (83)
Total R&M
LUKOIL Investment - - - -
Chemicals - - - -
Emerging Businesses - (1) - (1)
- - - -
Corporate and other
$ - (88) - (88)
Consolidated
SUMMARY OF NET INCOME (LOSS)
E&P
United States $ 872 1,323 4,348 4,288
International 1,215 1,103 5,500 4,142
Total E&P 2,087 2,426 9,848 8,430
Midstream 89 147 476 688
R&M
United States 741 727 3,915 3,329
International 178 246 566 844
Total R&M 919 973 4,481 4,173
LUKOIL Investment 302 189 1,425 714
Chemicals 98 114 492 323
Emerging Businesses 8 (5) 15 (21)
Corporate and other (306) (165) (1,187) (778)
Net Income $ 3,197 3,679 15,550 13,529
2
3. ConocoPhillips
Houston, Texas 77079
Preliminary
SELECTED FINANCIAL DATA
Three Months Ended Twelve Months Ended
December 31 December 31
2006 2005 2006 2005
INCOME FROM CONTINUING OPERATIONS
Effective tax rate % 46.0 % 42.9 45.1 42.1
Millions of Dollars
FOREIGN CURRENCY GAINS (LOSSES)
AFTER-TAX
E&P $ 3 1 (44) 7
Midstream - - - 7
R&M 35 (3) 60 (52)
LUKOIL Investment (2) - - (1)
Chemicals - - - -
Emerging Businesses 1 (1) 1 (1)
Corporate and other 61 (15) 65 (42)
$ 98 (18) 82 (82)
CASH FLOWS FROM OPERATING ACTIVITIES
Net Income $ 3,197 3,679 15,550 13,529
Depreciation, depletion and amortization 2,002 1,178 7,284 4,253
Impairments 366 11 683 42
Dry hole costs and leasehold impairments 210 138 351 349
Accretion on discounted liabilities 74 58 281 193
Deferred income taxes (56) 348 217 1,101
Undistributed equity earnings 62 (92) (945) (1,774)
Net gain on asset dispositions (52) (14) (116) (278)
Loss from discontinued operations - 15 - 23
Cumulative effect of changes in accounting principles - 88 - 88
Other 95 (140) (201) (139)
Working capital adjustments (261) (595) (1,588) 246
Net cash provided by continuing operations 5,637 4,674 21,516 17,633
Net cash provided (used) by discontinued operations - 1 - (5)
Net cash provided by operating activities $ 5,637 4,675 21,516 17,628
CAPITAL EXPENDITURES AND INVESTMENTS
E&P
United States $ 825 416 2,828 1,637
International 1,856 1,250 6,685 5,047
2,681 1,666 9,513 6,684
Midstream 2 - 4 839
R&M 532 663 3,016 1,738
LUKOIL Investment 753 637 2,715 2,160
Chemicals - - - -
Emerging Businesses 37 - 83 5
Corporate and other 78 81 265 194
$ 4,083 3,047 15,596 11,620
OTHER
At December 31, 2006 At December 31, 2005
Total debt $27,134 12,516
Common stockholders' equity $82,646 52,731
3
4. ConocoPhillips
Houston, Texas 77079
Preliminary
OPERATING HIGHLIGHTS
BY SEGMENT
Three Months Ended Twelve Months Ended
December 31 December 31
2006 2005 2006 2005
Thousands of Barrels Daily
E&P
Crude oil produced
United States
Alaska 257 291 263 294
Lower 48 113 54 104 59
370 345 367 353
Norway 185 188 189 197
United Kingdom 56 62 56 60
Canada 27 22 25 23
China 36 23 33 23
Indonesia 10 13 12 15
Vietnam 23 37 25 29
Timor Sea 27 36 36 33
Libya 56 - 50 -
Other 69 51 63 53
Total consolidated 859 777 856 786
Equity affiliates 113 116 116 121
Total Worldwide 972 893 972 907
Syncrude 26 20 21 19
Natural gas liquids produced
United States
Alaska* 17 21 17 20
Lower 48 72 31 62 30
89 52 79 50
Norway 8 11 9 9
Canada 31 10 25 10
Timor Sea 15 19 18 16
Other 7 7 5 6
Total Worldwide 150 99 136 91
11 13 11 9
*Includes reinjected volumes sold lease-to-lease.
Millions of Cubic Feet Daily
Natural gas produced*
United States
Alaska 131 172 145 169
Lower 48 2,250 1,264 2,028 1,212
2,381 1,436 2,173 1,381
Norway 291 264 270 272
United Kingdom 734 851 761 751
Canada 1,140 430 983 425
China 9 - 7 -
Timor Sea 243 33 235 34
Indonesia 315 330 319 298
Vietnam 20 19 21 18
Libya 17 - 4 -
Other 237 105 188 84
Total consolidated 5,387 3,468 4,961 3,263
Equity affiliates 7 3 9 7
Total Worldwide 5,394 3,471 4,970 3,270
*Represents quantities available for sale. Excludes
gas equivalent of NGL shown above.
Liquefied natural gas sales 470 118 423 117
LUKOIL Investment
Production (MBOE/D)* 438 293 401 246
Refinery crude oil throughput (MB/D)* 220 156 179 122
*Represents our estimated net share of LUKOIL.
4
5. ConocoPhillips
Houston, Texas 77079
Preliminary
OPERATING HIGHLIGHTS
Three Months Ended Twelve Months Ended
December 31 December 31
2006 2005 2006 2005
E&P
Per Unit
Average sales prices
Crude oil (per barrel)
United States
Alaska $ 57.00 57.61 62.66 52.24
Lower 48 51.26 46.62 57.04 45.24
Total U.S. 55.26 55.86 61.09 51.09
International 58.06 54.49 63.38 52.27
Total consolidated 56.87 55.06 62.39 51.74
Equity affiliates* 41.79 38.90 46.01 37.79
Total Worldwide 55.10 53.05 60.37 49.87
Natural gas-lease (per MCF)
United States
Alaska 4.05 3.01 3.59 2.75
Lower 48 5.85 9.37 6.14 7.28
Total U.S. 5.84 9.17 6.11 7.12
International 6.38 7.19 6.27 5.78
Total consolidated 6.13 7.96 6.20 6.32
Equity affiliates* 0.32 0.28 0.30 0.26
Total Worldwide 6.12 7.94 6.19 6.30
*Excludes our equity share of LUKOIL reported in the LUKOIL Investment segment.
Midstream
Thousands of Barrels Daily
Natural gas liquids extracted
Consolidated
United States 21 22 22 22
International - - - 25
Equity affiliates
United States** 181 172 181 142
International 7 6 6 6
209 200 209 195
**Represents 30.3 percent interest in DCP Midstream (DCP), through June 30, 2005, and 50 percent
interest beginning in July 2005.
Per Barrel
U.S. product prices
Weighted average NGL***
Consolidated $ 37.41 42.70 40.22 36.68
DCP 36.34 41.84 39.45 35.52
***Prices are based on index prices from the Mont Belvieu and Conway market hubs that are weighted by natural-gas-liquids
component and location mix.
5
6. ConocoPhillips
Houston, Texas 77079
Three Months Ended Twelve Months Ended
December 31 December 31
2006 2005 2006 2005
Thousands of Barrels Daily
R&M
United States
Crude oil capacity 2,208 2,182 2,208 2,180
Crude oil runs 2,128 1,853 2,025 1,996
Refinery production 2,325 2,037 2,213 2,186
International*
Crude oil capacity 693 428 651 428
Crude oil runs 605 435 591 424
Refinery production 633 458 618 439
U.S. petroleum products outside sales
Automotive gasoline 1,416 1,368 1,336 1,374
Distillates 707 653 655 675
Aviation fuels 214 189 195 201
Other products 535 521 531 519
2,872 2,731 2,717 2,769
International 720 490 759 482
3,592 3,221 3,476 3,251
Per Gallon
U.S. average sales prices**
Automotive gasoline-wholesale $ 1.74 1.77 2.04 1.73
Automotive gasoline-retail 1.89 1.96 2.18 1.88
Distillates-wholesale 1.95 2.06 2.11 1.80
*Includes ConocoPhillips' share of equity affiliates, except for our share of LUKOIL, which is reported in
the LUKOIL Investment segment.
**Excludes excise taxes.
6