
Recomendados
Mais conteúdo relacionado
Semelhante a Day 4 theoretical probability
Semelhante a Day 4 theoretical probability (20)
Mais de Erik Tjersland
Mais de Erik Tjersland (20)
Day 4 theoretical probability
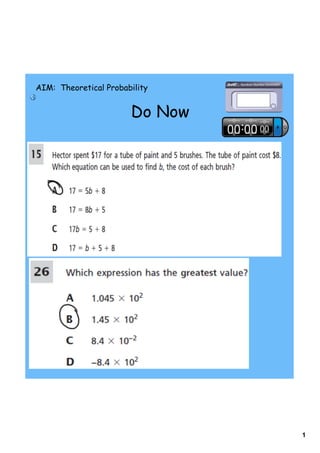
- 1. AIM: Theoretical Probability Do Now 1
- 2. Homework: Pages 522-523 #4-12 all, 15-19 all, 21 2
- 3. 3
- 4. Anticipatory Set The other day we completed an experiment involving rolling two dice to find what the most frequently occurring sum would be. Today we will find the theoretical probability of each sum occurring. 1.) Based on the Fundamental Counting Principle, how many possible outcomes can there be for rolling two six sided dice? 4
- 6. 4.) Based on the theoretical probabilities of the sums, which should be the most frequently occurring sum? Was this the same result as your experiment? Explain why or why not. 6
- 7. 1 A B C D 7
- 8. 8
- 9. 2 A B C D 9
- 10. 3 A C B D 10
- 11. 4 A C B D 11
- 12. 5 A B C D 12
- 13. 6 A C B D 13
- 14. 7 A B C D 14
- 15. 8 A C B D 15
- 16. 5.) A fair 1-6 number cube is rolled. Find the probability of rolling a number greater than 1. Fraction = ____ Decimal = ____ Percent = _____ 6.) A standard deck of playing cards has 52 cards. These cards are divided into four 13-card suits: hearts, clubs, spades, and diamonds. Find the probability of drawing a spade? Fraction = ____ Decimal = ____ Percent = _____ 16
- 17. 7.) A standard deck of playing cards has 52 cards. These cards are divided into four 13-card suits: hearts, clubs, spades, and diamonds. Find the probability of drawing a black queen. Fraction = ____ Decimal = ____ Percent = _____ 17
- 18. 8.) In number 5, a fair number cube was used in the example. What does fair mean in that example? Explain your answer. 9.) Draw an unbiased spinner with four sections below. 10.) Draw a biased spinner with four sections below. 18
- 19. Extra Practice 19
- 20. BEFORE YOU LEAVE Describe the similarities and differences in your partner‛s unbiased and biased spinners. 20
- 21. Before You Leave 21
- 22. Mr. Tjersland's Math 7 Homework: Pages 526-527 #1-8 all, 13-17 all 22
- 23. AIM: Theoretical Probability 23
- 24. AIM: Theoretical Probability 24
- 25. AIM: Theoretical Probability 25