G7 Labour Market Dashboard
•Transferir como PPSX, PDF•
2 gostaram•1,424 visualizações

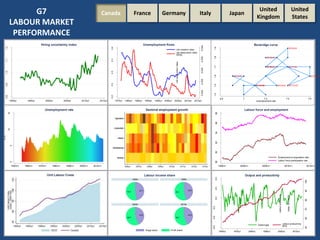
The G7 labour market dashboard gives a quick overview of key labour market developments in G7 countries. It compares unemployment, employment, labour force, GDP growth, wages and unit labour costs across all seven countries.

Recomendados
Mais conteúdo relacionado
Destaque
Destaque (7)
Semelhante a G7 Labour Market Dashboard
Semelhante a G7 Labour Market Dashboard (20)
Mais de International Labour Organization
Mais de International Labour Organization (8)
Último
Último (20)
G7 Labour Market Dashboard
- 1. 1995q1 2000q1 2005q1 2010q1 2015q1 1980q1 1985q1 1990q1 1995q1 2000q1 1.9 0.035 1.8 Vacancy rate 0.030 1.7 2012m9 2012m3 2011m9 0.020 1975q1 2005q1 2010q1 United States Beveridge curve 2012m6 0.025 Job destruction rates 0.3 0.2 1990q1 United Kingdom Japan 1.6 0.4 0.3 Job creation rates Job destruction rates (RHS) 0.3 Job creation rates 1.1 0.9 0.8 1.0 Italy Unemployment flows 1.2 Hiring uncertainty index Germany 2013m9 . 1.5 France . . 1.4 Canada 0.040 G7 LABOUR MARKET PERFORMANCE 2015q1 2 . 013m6 2012m12 . 2 . 011m6 . . 2013m3 . 2011m3 2011m12 . 7 Unemployment rate . . . 6.8 . 7.2 Unemployment rate 7.4 7.6 64 62 60 0 2010m1 1995m1 2000m1 43.9 56.1 Wage share Profit share 100 90 80 70 60 43.8 Output gap 1960q1 1970q1 1980q1 1990q1 Labour productivity RHS 2000q1 2010q1 50 2010s Index, 2010=100 2000s Labour productivity 45.9 54.1 56.2 2015m1 4.0 1990s 47.7 2010m1 Output and productivity Labour income share 1980s 52.3 2005m1 2.0 2000m1 0.0 1990m1 -2.0 1980m1 -4.0 1970m1 -6.0 1960m1 Output gap 1950m1 Employment-to-population ratio Labour force participation rate 58 5 in % 10 in % of working-age population 66 68 15 Labour force and employment
- 2. 2008q3 2011q1 2013q3 1.3 0.013 . 1.2 0.012 . 2008q1 0.009 1.1 1.0 . 2005q3 2008q1 2010q3 . 2007q1 . 2006q1 . . . . . 2005q1 2011q1 . . . 2003q1 . . . 2004q1 . . . . . 2009q1 7 2003q1 . . . 0.9 0.11 0.10 2006q1 United States Beveridge curve . 0.09 1.0 2003q3 United Kingdom Japan . Job destruction rates 0.13 Job creation rates Job destruction rates (RHS) 0.12 Job creation rates Italy Vacancy rate 0.011 1.5 1.4 1.3 1.1 1.2 Germany Unemployment flows 0.14 Hiring uncertainty index France . 2012q1 2010q1 . . . . 2013q1 . 0.8 Canada 0.010 G7 LABOUR MARKET PERFORMANCE 8 9 10 Unemployment rate 2013q1 Unemployment rate 11 12 62 2015q1 2003q3 2006q1 39.6 100 80 39.9 60.4 37.6 2010s 38.6 39.1 61.4 60.9 40 2000s Wage share Profit share 60 60.1 1990s 62.4 1980s Output gap 1960q1 1970q1 1980q1 1990q1 Labour productivity RHS 2000q1 2010q1 20 36.8 2013q3 Index, 2005=100 1970s 63.2 2011q1 Output and productivity Labour income share 1960s 2008q3 Labour productivity 2010q1 4.0 2005q1 2.0 2000q1 0.0 1995q1 -2.0 1990q1 -4.0 1985q1 -6.0 1980q1 Output gap in % 60 58 2 1975q1 Employment-to-population ratio Labour force participation rate 56 4 6 8 in % of working-age population 10 64 Labour force and employment
- 3. Canada 2006q1 2008q3 2011q1 2013q3 2007q1 2009q1 2011q1 2.0 1.5 . . . . 2012q1 1.0 . 2011q1 . . . . . ... . 2008q1 2009q1 . . 2010q1 2007q1 . . . . . . 0.5 . 2006q1 . 2005q1 0.0 . 4 2005q1 United States 2.5 0.008 0.007 Vacancy rate 0.006 0.007 . 0.005 0.07 0.06 1.0 0.9 2003q3 United Kingdom Japan Beveridge curve Job destruction rates 0.08 0.09 Job creation rates Italy Job creation rates Job destruction rates (RHS) 0.10 1.4 1.3 1.2 1.1 Germany Unemployment flows 0.11 Hiring uncertainty index France 0.006 G7 LABOUR MARKET PERFORMANCE 6 8 Unemployment rate 2013q1 12 65 60 0 2010m1 2005q3 2007q3 2011q3 2013q3 4.0 Output gap 42.0 2010s 100 90 41.8 Index, 2005=100 58.0 Labour productivity 44.7 Labour prod. RHS 95 2000s 105 Output and productivity Labour income share 1990s 55.3 2009q3 2.0 58.2 Wage share Profit share 85 2000m1 0.0 1990m1 -2.0 1980m1 -4.0 1970m1 Output gap 1960m1 Employment-to-population ratio Labour force participation rate 55 5 in % 10 in % of working-age population 70 Labour force and employment 15 Unemployment rate 10 1990q1 1995q1 2000q1 2005q1 2010q1 2015q1
- 4. 0.008 2008q1 1.0 . 2004q1 . 0.8 . .. . 2006q1 ... . 2011q1 . 2005q1 . . 0.6 Job destruction rates 0.04 2008q1 2010q3 2013q1 1998q1 2001q1 2004q1 2007q1 2010q1 2010q1 . 2009q1 . . . 2012q1 . . . . 0.4 0.005 0.02 1.0 2005q3 United States Beveridge curve 2007q1 . 2003q1 United Kingdom Japan . 0.06 Job creation rates 1.6 1.4 1.2 Italy Job creation rates Job destruction rates (RHS) 0.08 1.8 Germany Unemployment flows 0.10 Hiring uncertainty index France 1.2 Canada Vacancy rate 0.006 0.007 G7 LABOUR MARKET PERFORMANCE 2013q1 . . 6 8 . 10 Unemployment rate 2013q1 12 14 54 52 50 48 4 2013q1 1998q1 2002q1 1980s 33.6 34.9 29.5 31.1 Wage share 80 60 68.9 70.5 Profit share Output gap 1960q1 1970q1 1980q1 1990q1 Labour productivity RHS 2000q1 2010q1 20 30.1 69.9 2010s 40 2000s Labour productivity 1990s 66.4 Index, 2005=100 65.1 68.8 2014q1 100 4.0 1970s 31.2 2010q1 Output and productivity Labour income share 1960s 2006q1 2.0 2010q1 0.0 2007q1 -2.0 2004q1 -4.0 2001q1 Output gap 1998q1 Employment-to-population ratio Labour force participation rate 46 6 8 in % 10 in % of working-age population 12 56 Labour force and employment 14 Unemployment rate .
- 5. Canada 2008q3 2011q1 2013q3 2.0 1.5 0.005 0.004 2002q3 2005q1 2007q3 2010q1 1973q1 2006q1 2007q1 2005q1 . . 2004q1 . . . . . . 2008q1. 2012q1 . 1991q1 1990q1 . . 1989q1 . 1971q1 2003q1 . 1969q1 . . 1968q1 . 1992q1 1972q1 . . . 2011q1 2001q1 .. .. . . 1988q1 1997q1 . . .. . . 2002q1 . . .2000q1 . .. ... . . . . .2009q1 .2010q1 . 1993q1 . 1998q1 1996q1 . .. . . 1975q1 .. . . 1995q1 1980q1 1999q1. . . . .. . 1979q1 1984q1 1976q1 1986q1 1994q1 . . 1981q1. 1985q1 . . . 1987q1 . . 1977q1. 1982q1 1983q1 . . 1978q1. . . . . .... . . .. . . . .. . . . . . . .. . . . . .. . . . . .. . . . . .. . . . . . . . 1970q1 1974q1 0.5 2006q1 1 2 3 4 Unemployment rate 2012q3 Unemployment rate 5 6 66 65 64 Employment-to-population ratio Labour force participation rate 63 3 4 5 in % of working-age population 67 6 68 Labour force and employment 2 2015m1 1980m1 1985m1 Labour income share 1995m1 2000m1 2005m1 2010m1 Output and productivity 1970s 1980s 2000s 2010s 43.5 45.1 Wage share 100 80 43.3 56.5 56.7 40 1990s 54.9 45.5 54.5 60 45.1 54.9 Index, 2005=100 37.9 62.1 2015m1 Profit share Output gap 1960q1 1970q1 1980q1 1990q1 Labour productivity RHS 2000q1 2010q1 20 1960s 1990m1 Labour productivity 2010m1 4.0 2005m1 2.0 2000m1 0.0 1995m1 -2.0 1990m1 -4.0 1985m1 -6.0 1980m1 Output gap in % United States . 1.0 Job destruction rates 0.16 0.12 0.10 1.3 2003q3 United Kingdom Japan Beveridge curve Job creation rates Job destruction rates (RHS) 0.14 Job creation rates 1.6 1.5 1.4 Italy 0.009 1.8 1.7 Germany Unemployment flows 0.18 Hiring uncertainty index France Vacancy rate 0.006 0.007 0.008 G7 LABOUR MARKET PERFORMANCE
- 6. G7 LABOUR MARKET PERFORMANCE Canada France 2006q3 2013q3 2.5 2.0 . . 2009q1 2001q1 . 2003q1 2006q3 2010q1 . . . 2011q1 . . 2010q1 2012q1 2000q1 . . 6 . 7 Unemployment rate 2013q3 8 9 Labour force and employment 68 64 66 Employment-to-population ratio Labour force participation rate 4 62 5 6 in % 7 8 in % of working-age population 9 70 Unemployment rate 2013q1 2000q1 2005q1 53.6 46.4 54.1 120 6.0 2010s 44.4 45.9 55.6 Wage share Profit share 100 80 60 2000s Output gap 1960q1 1970q1 1980q1 40 1990s 48.1 51.9 53.1 Index, 2005=100 46.9 Labour productivity 54.7 1980s 4.0 1970s 45.3 2015q1 Output and productivity Labour income share 1960s 2010q1 2.0 2010q1 0.0 2007q1 -2.0 2004q1 -4.0 2001q1 Output gap 1998q1 . . . 1.0 0.009 1999q3 . . 1.5 0.012 . . . . . . . 2008q1 . . . . . . . . . 2005q1 2002q1 2007q1 . 2004q1 . . . 2003q1 2006q1 0.010 Job destruction rates Vacancy rate 0.011 0.011 0.20 0.18 0.14 0.12 0.6 1999q3 United States . 5 1992q3 United Kingdom Japan Beveridge curve Job creation rates Job destruction rates (RHS) 0.16 Job creation rates 1.0 0.8 Italy Unemployment flows 1.2 Hiring uncertainty index Germany Labour productivity RHS 1990q1 2000q1 2010q1
- 7. Italy Vacancy rate 0.025 0.030 Job destruction rates 0.5 0.4 1990q1 1995q1 2000q1 2005q1 2010q1 2015q1 0.015 0.7 0.2 0.020 0.3 0.8 Job creation rates 0.9 0.6 0.035 1950q1 1960q1 1970q1 1980q1 1990q1 2000q1 United States Beveridge curve 2001q1 3.5 Job creation rates Job destruction rates (RHS) United Kingdom Japan . 3.0 0.7 0.040 Unemployment flows 1.0 Hiring uncertainty index Germany . 2.5 France 2.0 Canada . . . . .2007q1 . 2006q1 . . 2008q1 . . . 2005q1 . 2002q1 . . . .. 2003q1 2004q1 . . . . . .. . 2013q1 . 2012q1 . . . . 2011q1 .. . 2009q1 2010q1 . . . 1.5 G7 LABOUR MARKET PERFORMANCE 4 6 8 Unemployment rate 2010q1 12 Labour force and employment 2 2010q1 1980m1 1985m1 42.6 44.7 Wage share 120 2015m1 100 80 2010s 55.3 2010m1 60 46.4 53.6 2000s 45.2 54.8 2005m1 57.4 Profit share Output gap 1960q1 1970q1 1980q1 1990q1 Labour productivity RHS 2000q1 2010q1 40 1990s 1980s 49.0 51.0 2000m1 Index, 2005=100 1970s 49.7 50.3 1995m1 Output and productivity Labour income share 1960s 1990m1 Labour productivity 2000q1 4.0 1990q1 2.0 1980q1 0.0 1970q1 -2.0 1960q1 -4.0 1950q1 Output gap in % 70 65 Employment-to-population ratio Labour force participation rate 60 4 6 8 in % of working-age population 10 75 Unemployment rate 10