SNAPS +PwD in US 2012
•
0 gostou•367 visualizações

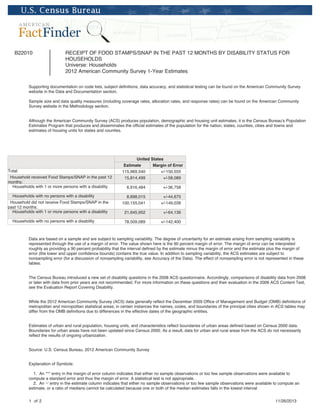
The 2012 American Community Survey (ACS), Table B22010, shows that approx. 7 million of the approx. 16 million households receiving Food Stamps/SNAPS nationwide have 1 or more family member living with at least 1 disability. Yup- that's approx. 44% (43.7%)

Recomendados
Recomendados
Mais conteúdo relacionado
Semelhante a SNAPS +PwD in US 2012
Semelhante a SNAPS +PwD in US 2012 (20)
Mais de eilily Community Access Project, Somerville
Mais de eilily Community Access Project, Somerville (20)
Último
Último (20)
SNAPS +PwD in US 2012
- 1. B22010 RECEIPT OF FOOD STAMPS/SNAP IN THE PAST 12 MONTHS BY DISABILITY STATUS FOR HOUSEHOLDS Universe: Households 2012 American Community Survey 1-Year Estimates Supporting documentation on code lists, subject definitions, data accuracy, and statistical testing can be found on the American Community Survey website in the Data and Documentation section. Sample size and data quality measures (including coverage rates, allocation rates, and response rates) can be found on the American Community Survey website in the Methodology section. Although the American Community Survey (ACS) produces population, demographic and housing unit estimates, it is the Census Bureau's Population Estimates Program that produces and disseminates the official estimates of the population for the nation, states, counties, cities and towns and estimates of housing units for states and counties. Total: Household received Food Stamps/SNAP in the past 12 months: Households with 1 or more persons with a disability Households with no persons with a disability Household did not receive Food Stamps/SNAP in the past 12 months: Households with 1 or more persons with a disability Households with no persons with a disability United States Estimate Margin of Error 115,969,540 +/-150,555 15,814,499 +/-58,089 6,916,484 +/-36,758 8,898,015 100,155,041 +/-44,675 +/-149,039 21,645,952 +/-64,136 78,509,089 +/-142,400 Data are based on a sample and are subject to sampling variability. The degree of uncertainty for an estimate arising from sampling variability is represented through the use of a margin of error. The value shown here is the 90 percent margin of error. The margin of error can be interpreted roughly as providing a 90 percent probability that the interval defined by the estimate minus the margin of error and the estimate plus the margin of error (the lower and upper confidence bounds) contains the true value. In addition to sampling variability, the ACS estimates are subject to nonsampling error (for a discussion of nonsampling variability, see Accuracy of the Data). The effect of nonsampling error is not represented in these tables. The Census Bureau introduced a new set of disability questions in the 2008 ACS questionnaire. Accordingly, comparisons of disability data from 2008 or later with data from prior years are not recommended. For more information on these questions and their evaluation in the 2006 ACS Content Test, see the Evaluation Report Covering Disability. While the 2012 American Community Survey (ACS) data generally reflect the December 2009 Office of Management and Budget (OMB) definitions of metropolitan and micropolitan statistical areas; in certain instances the names, codes, and boundaries of the principal cities shown in ACS tables may differ from the OMB definitions due to differences in the effective dates of the geographic entities. Estimates of urban and rural population, housing units, and characteristics reflect boundaries of urban areas defined based on Census 2000 data. Boundaries for urban areas have not been updated since Census 2000. As a result, data for urban and rural areas from the ACS do not necessarily reflect the results of ongoing urbanization. Source: U.S. Census Bureau, 2012 American Community Survey Explanation of Symbols: 1. An '**' entry in the margin of error column indicates that either no sample observations or too few sample observations were available to compute a standard error and thus the margin of error. A statistical test is not appropriate. 2. An '-' entry in the estimate column indicates that either no sample observations or too few sample observations were available to compute an estimate, or a ratio of medians cannot be calculated because one or both of the median estimates falls in the lowest interval 1 of 2 11/26/2013
- 2. or upper interval of an open-ended distribution. 3. An '-' following a median estimate means the median falls in the lowest interval of an open-ended distribution. 4. An '+' following a median estimate means the median falls in the upper interval of an open-ended distribution. 5. An '***' entry in the margin of error column indicates that the median falls in the lowest interval or upper interval of an open-ended distribution. A statistical test is not appropriate. 6. An '*****' entry in the margin of error column indicates that the estimate is controlled. A statistical test for sampling variability is not appropriate. 7. An 'N' entry in the estimate and margin of error columns indicates that data for this geographic area cannot be displayed because the number of sample cases is too small. 8. An '(X)' means that the estimate is not applicable or not available.