
Recomendados
Recomendados
Mais conteúdo relacionado
Mais procurados
Mais procurados (20)
Destaque
Destaque (13)
Semelhante a 2013 Climate Change Connections to our Weather, Environment, and Health
Semelhante a 2013 Climate Change Connections to our Weather, Environment, and Health (20)
Último
Último (20)
2013 Climate Change Connections to our Weather, Environment, and Health
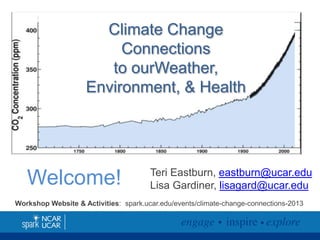
- 1. Teri Eastburn, eastburn@ucar.edu Lisa Gardiner, lisagard@ucar.eduWelcome! Workshop Website & Activities: spark.ucar.edu/events/climate-change-connections-2013 Climate Change Connections to our Weather, Environment, & Health
- 2. What do you know and want to know & learn about climate change? A review of our KWL Chart, Climate Survey
- 3. • To address your needs • To foster confidence • To present meaningful classroom-ready activities • To foster helpful discussions • To have fun and learn from one another Our Goals for Today
- 4. What are UCAR and NCAR?
- 6. Part 1:The Earth System; Energy Atmosphere Lithosphere CryosphereHydrosphere
- 7. The Nature of the Sun’s Energy Meet the Photon Folks Absorption, Reflection ,Transmission
- 8. Source: Living with a Star, NASA
- 12. More than your Eyes can See Source: NASA, Spitzer http://www.youtube.com/watch?v=2--0q0XlQJ0
- 13. The Keeling Curve --increasing CO2 levels leading to an enhanced Greenhouse Effect 2006 Ozone Hole
- 14. Feeling the Heat Students learn about the urban heat island effect by investigating which areas of their schoolyard have higher temperatures. Then they analyze data about how the number of heat waves in an urban area has increased over time with population. NYC, 8/14/02:Temp and vegetation Pg. 19 Pg. 9
- 15. Feeling the Heat, Part 1 Students investigate how trees, grass, asphalt, etc. affect temperature Coolest Warm
- 16. Feeling the Heat, Part 2: Investigating the history of heat waves and temperature in Los Angeles, CAStand in a group of 10 along the rope. Each person takes one LA Data Card. The Objective: Order yourselves by the data on the card keeping at least one foot on the rope at all times as you move past each other to get in order. 1. Order yourselves by average temperature. 2. Order yourselves by the number of heat waves.** 3. Order yourselves by population. (**Note: there are two decades that have the same number of heat waves. The people with those cards can stand next to each other in any order.)
- 17. Reasons for patterns The highest temperatures are found in the most dense part of a city. That’s the urban heat island effect. The next 3 slides show how LA has changed over time. How do you think the heat island effect has changed as the city changed?
- 18. Los Angeles, CA in 1877. East LA is on the left and West LA is on the right. (Courtesy of the Library of Congress))
- 19. Los Angeles, CA in 1909. (Courtesy of the Library of Congress)
- 20. Los Angeles, CA in 2002. This 3-D perspective view was generated using topographic data and an enhanced color Landsat 5 satellite image mosaic. Topography is exaggerated one and one-half times. (Courtesy of NASA/JPL)
- 21. This graph shows the number of heat waves in Los Angeles, CA over the past century. Do you see a pattern? How have heat waves changed through time? (From Tamrazian et al., 2008) Looking for patterns
- 22. This graph shows the duration of heat waves in Los Angeles, CA (measured in days.) Has there been a change through time? (From Tamrazian et al., 2008) Looking for patterns
- 23. How has the temperature in Los Angeles changed over time? This graph shows the average temperature for each year. See a pattern? CourtesyofNOAA/NWS
- 24. Warmer city temperatures are partially due to global warming. This graph shows how Earth’s average temperature has changed.
- 25. System for Integrated Modeling of Metropolitan Extreme Heat Risk (SIMMER) NCAR scientists are building a tool for public health to use to assess the risk of extreme heat in Houston. • Looking at the impact of urban extreme heat on human health • Characterizing people’s vulnerability and the responses to heat • Improving how urban land cover appears in GIS maps at local and regional scales • Modeling present and future extreme heat events http://www.rap.ucar.edu/projects/simmer/
- 26. Part II: Weather vs Climate
- 27. High and low temperatures Houston,TX July 1-20, 2013
- 28. Weather & Climate Graphing Pg. 37 Houston,TX
- 29. Weather & Weather in the News Pg. 19
- 30. Get the Picture? Activity Pg. 23
- 31. Heat waves are increasing: an example Is it global warming, or is it natural variability? These are not the right questions: it is a combination of both. Source: Jim Hurrell, NCAR
- 32. Part III: Climate Now, Cycles
- 33. The Nitrogen Cycle Game pg. 41
- 35. The Carbon Journey pg. 49, Source: NOAA
- 37. 150 0.045±0.012 100 0.074±0.018 50 0.128±0.026 25 0.177±0.052 Period Rate Years °/decade Trenberth Global mean temperatures are rising faster with time Warmest 12 years: 2005,2010,1998,2003,2002,2006, 2009,2007,2004,2001,2011,2008
- 39. The “Other” CO2 Problem
- 40. CO2 How Much Do You Spew? Pg. 63
- 41. CO2: How Much Do You Spew? Directions: • Each group has a card profiling a hypothetical family or individual. • Families/individuals live in different situations & use energy in different ways. • Students use the worksheet to calculate a household’s CO2 emissions. Sample card CO2: How Much Do You Spew?
- 42. Answer Key for CO2: How Much Do You Spew 1. What activities emitted the most CO2 for the family you examined? 2. Could those activities be changed to emit less CO2? How? 3. How would you change your scenario to reduce CO2?
- 43. Photo by Water Partners International What are basic human needs? Select items to purchase with your global dollars using the Choices and impacts worksheet An activity by Facing the Future, www.facingthefuture.org
- 44. Glaciers Then and Now, Muir Glacier (Pg. 85) Glacier Bay National Park,Alaska 1941 2004 Photos courtesy of NSIDC Visible Impacts
- 45. 1906 2004 Photos courtesy of USGSCarroll Glacier Glacier Bay National Park,Alaska
- 46. Model a Moving Glacier: Glacier a Go-Go Adapted by an activity by Leigh Sterns, University of Maine The objective of this lesson is to teach middle and high school students about variables that affect glacier flow over time: - valley slope - ice temperature - basal conditions (ground surface) - strain Pg. 91
- 47. Variables to Study PVC pipe lined with aluminum foil and lubricated with oil Lubricated Bed PVC pipeNormal Bed PVC pipe lined with sandpaper Rough Bed Basal Conditions 65°Steep 45°Medium 25°Shallow Valley Slope Flubber microwaved until hot to touch Warm Ice (pink flubber) Flubber at room temperature Normal Ice (white flubber) Flubber placed in the freezer prior to class Cold Ice (blue flubber) IceTemperature PVC pipe flubber vertical toothpicks Time 1: Time 2: Strain Grid
- 48. Lab Setup basic setup advanced setup Source: Leigh Sterns, University of Maine
- 49. “Flubber” Recipe 1. Decide on one of the variables to study. 2. Make a hypothesis (e.g. the steeper the slope, the faster the flow rate of a glacier.) 3. Test your hypothesis and record and graph your results. 4. Discuss results and how flubber is like and unlike a glacier. food coloring (optional) ½ cup warm water1 cup white glue (ex. Elmer’s) 2 tsp. of Borax¾ cup warm water Mix #2Mix #1
- 50. 2012 record minimum: 3.41 mil sq km 2007 record minimum: 4.13 million square km Currently loosing Arctic Sea Ice at a rate of 11% per decade
- 51. Why Does Albedo Matter?
- 54. Model Projections of Future Arctic Summer Sea Ice Minimums Under Business as Usual Future http://www.ucar.edu/news/releases/2006/arctic.shtml
- 55. Hurricanes and Climate Pg. 97 Students investigate maps and data to learn about the connections between hurricanes and climate including: (1) regional climate conditions where hurricanes form, and (2) how global climate change may be affecting hurricanes. Courtesy of Kevin Trenberth
- 56. Where do hurricanes happen? The map shows the paths of all tropical cyclones that occurred between 1985 and 2005. (Wikipedia commons)
- 58. Hurricanes happen where water is warm Temperature of the ocean surface (“sea surface temperature” or SST). Data from GOES and POES satellites. (NOAA)
- 59. Warm water gives a hurricane power… To grow in strength, a hurricane needs: • Warm, moist air (moisture for rainstorms) • Winds that don't change direction with height • Deep, warm ocean water (79°F or warmer)…As winds strengthen, more water evaporates, releasing energy stored in the warm seas.
- 60. Is global warming affecting hurricanes? Data fromWebster et al (2005) Science, 309, 1844-46. Not much change in the number of hurricanes over time. Strong hurricanes are more frequent now than they were a few decades ago.
- 61. From Webster et al (2005) Large Increase in Number of Category 4 and 5 Hurricanes
- 63. A Conversation: Climate & Human Health Section 5: Social and Political Connections For more info: https://spark.ucar.edu/longcontent/climate-change-and-vector-borne-disease
- 64. A Conversation: Climate Communication
- 66. What led to acceptance of climate change? • Hurricane Sandy • Increasing media coverage affirming climate change • Midwest drought, summer 2012 • Texas drought 2011; Fires across southwest & west • All around increase in severe weather events • Arctic sea ice retreat • 2012 hottest year on record in continental US…
- 67. Comment from a Teacher “There was one parent who said he had a PhD in entomology and said that he thinks global climate change is false. If I decided to teach this information to the students, he would come into the classroom and dispute it all in front of me. Instead of doing this, the school administration just suggested that I not teach the information. I really found it to be a shame because it's something that is often found in the media that many students are interested in and want to learn more about. I don't want to tell them one way or another, but they need to know the facts from both sides without bias.” Source: NESTA
- 68. Comment from Respondent “There was one parent who said he had a PhD in entomology and said that he thinks global climate change is false. If I decided to teach this information to the students, he would come into the classroom and dispute it all in front of me. Instead of doing this, the school administration just suggested that I not teach the information. I really found it to be a shame because it's something that is often found in the media that many students are interested in and want to learn more about. I don't want to tell them one way or another, but they need to know the facts from both sides without bias.” Source: NESTA
- 69. “I teach in a very conservative area and many of my high school students say things to me like, "My parents don't believe in global warming” Source: NESTA - NESTA teacher
- 70. Whose Side AreYou On?
- 71. Climate Change 101 TEACH THESE 5 KEY POINTS It is real NOW It is BAD for us It is HUMAN-CAUSED We can SOLVE IT if we choose to Climate SCIENTISTS AGREE that it’s happening This is what the scientific evidence supports
- 72. Frame and Build Trust http://www.youtube.com/watch?v=4q4OHQJ0_gQ
- 73. http://www.youtube.com/watch?v=GlQc9Kj15NM&list=PLB191F5DA17C6E638 Frame and Build Trust Repower America Ad
- 74. From Istockphoto.com S O L U T I O N S
- 75. Intergovernmental Panel on Climate Change (IPCC) www.ipcc.ch 5th Assessment Report coming soon!
- 77. Imagine A World: 2100 Pg.112 Summary for Educators coming soon!
- 79. 2 2 = 4 billion tons go out Ocean Land Biosphere (net) Fossil Fuel Burning + 8 800 billion tons carbon 4 billion tons go in ATMOSPHERE billion tons added every year
- 80. Billions ofTons Carbon Emitted perYear Historical emissions 0 8 16 1950 2000 2050 2100 Historical Emissions
- 81. 1.6 Interim Goal Billions ofTons Carbon Emitted perYear Historical emissions Flat path Stabilization Triangle 0 8 16 1950 2000 2050 2100 The StabilizationTriangle
- 82. 1.6 Interim Goal Billions ofTons Carbon Emitted perYear Historical emissions Flat path Stabilization Triangle 0 8 16 1950 2000 2050 2100 The StabilizationTriangle ~850 ppm Easier CO2 target
- 83. 1.6 Billions ofTons Carbon Emitted perYear Historical emissions Flat path 0 8 16 1950 2000 2050 2100 Stabilization Wedges 16 GtC/y Eight “wedges” Goal: In 50 years, same global emissions as today
- 84. What is a “Wedge”? A “wedge” is a strategy to reduce carbon emissions that grows in 50 years from zero to 1.0 GtC/yr.The strategy has already been commercialized at scale somewhere. 1 GtC/yr 50 years Total = 25 Gigatons carbon Cumulatively, a wedge redirects the flow of 25 GtC in its first 50 years.This is 2.5 trillion dollars at $100/tC. A “solution” to the CO2 problem should provide at least one wedge.
- 85. Energy Efficiency & Conservation (4) CO2 Capture & Storage (3) Stabilization Triangle Renewable Fuels & Electricity (4) Forest and Soil Storage (2) Fuel Switching (1) 15 Wedge Strategies in 4 Categories Nuclear Fission (1) 2007 2057 8 GtC/y 16 GtC/y Triangle Stabilization
- 86. http://cmi.princeton.edu/wedges/pdfs/teachers_guide.pdf You can find more info about each of the 15 wedge areas in the teacher guide online.
- 87. #1: Who might support these scenarios of ways to reduce? • auto efficiency • conservation in transportation • building efficiency • electricity efficiency • fuel switching electrics (natural gas vs coal) • forest storage • soil storage • nuclear Possibly a taxpayer?
- 88. Who? • CO2 Storage electricity • fuel switching electricity (natural gas for coal) • fuel switching electricity • nuclear • forest storage • soil storage • Increased efficiency electricity plants • wind electricity A possible fossil fuel exec. ?
- 89. Who? • efficiency transport • conservation transport efficiency • efficiency buildings • efficiency electricity • wind • solar • forest storage • forest storage A possible environmentalist choice?
- 90. Who? • - fuel switching electricity • - fuel switching electricity • - fuel switching electricity • - efficiency transport • - efficiency transport • - efficiency transport • - carbon Storage electricity • - efficiency buildings A likely U.S. choice? – Many of these scenarios have been initiated or implemented.
- 91. Take Home Messages from Activity • In order to avoid a doubling of atmospheric CO2, we need to rapidly deploy low-carbon energy technologies and/or enhance natural sinks • We already have an adequate portfolio of technologies to make large cuts in emissions • No one technology can do the whole job – a variety of strategies will need to be used to stay on a path that avoids a CO2 doubling • Every “wedge” has associated impacts and costs
- 93. Thank you for joining us today. Help us continually improve this workshop by completing your survey before you leave. Teri Eastburn eastburn@ucar.edu Lisa Gardiner lisagard@ucar.edu Workshop Website & Activities: spark.ucar.edu/events/climate-change-connections-2013
Notas do Editor
- Lisa
- Lisa
- Lisa: REMOVE????
- Teri
- Teri: overview of climate pastMention Tree Ring activities; proxy record activities; and Climate Discovery Booklet for paleo activities
- Click to start animation
- Teri: NCAR modelers find risk of collapse in summer Arctic ice as soon as the 2020s
- Lisa
- Lisa
- Lisa
- Lisa
- Lisa
- Lisa
- Lisa
- Data on personal outlook and relevant to one’s life now…
- Proof is in the pudding
- TERI
- Energy Company
- environ
- us
- Global Connectiions Game