![2
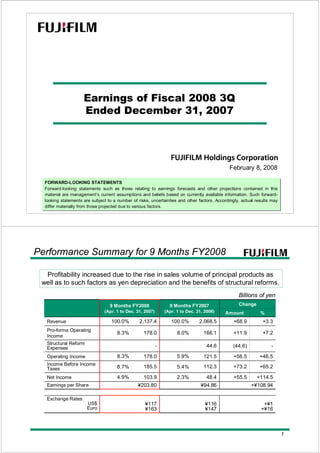
Actively Executed Share Buybacks during 3Q
Distribution of Profits to Shareholders
¥34.1¥19.4¥14.7
Value of shares
bought (in Billions)
2,700
October
2007
6,700
Total
4,000
November
2007
Number of shares
bought (in Thousands)
FY2008
A Return to
Shareholders Ratio
Approx. 43%
(Forecast)
A Return to Shareholders Ratio Forecast: Approx. 43%
Cash
Dividends
1H (Result) (YoY +¥5)¥17.50
Year total
(Forecast) (YoY +¥10)¥35.00
Cash dividends+Share buybacks
Consolidated net income
As of Dec. 31, 2007
Ratio of Treasury Stocks to
Outstanding Shares
2.0%
3
Imaging Solutions (9 months ended Dec. 31, 2007)
While the color film market shrank, the overall sales
decline was kept to a small margin due to a rise in
sales of color paper and other products.
¥443.7 billion (YoY:-7.2%)
Despite the impact of persistently high silver prices,
cost-reduction benefits from structural reforms and
the effect of yen depreciation enabled the restoration
of profitability.
RevenueRevenue
Operating IncomeOperating Income
Operating Segments
Billions of yen
*Note: After elimination of intersegment transaction
9 months FY2007
ended Dec. 31, 2006
Revenue
Pro-forma Operating Income (Excluding structural
reform expenses)
Operating Income
Revenue* /Operating IncomeRevenue* /Operating Income
[ ]: Operating Margin
( ): YoY Comparison
478.0 443.7
24.4
16.0
-7.4
¥16.0 billion (YoY: Restored profitability)
(In comparison with pro-forma operating income
of the previous fiscal year YoY: -34.8%)
[5.1%]
[-1.5%]
9 months FY2008
ended Dec. 31, 2007
(-7.2%)
[3.6%]](data:image/gif;base64,R0lGODlhAQABAIAAAAAAAP///yH5BAEAAAAALAAAAAABAAEAAAIBRAA7)
Recomendados
Mais conteúdo relacionado
Mais procurados
Mais procurados (16)
Destaque
Destaque (20)
Semelhante a Fuji 3rd Quarter 2008 Earnings
Semelhante a Fuji 3rd Quarter 2008 Earnings (20)
Mais de earningsreport
Mais de earningsreport (20)
Último
Último (20)
Fuji 3rd Quarter 2008 Earnings
- 1. FORWARD-LOOKING STATEMENTS Forward-looking statements such as those relating to earnings forecasts and other projections contained in this material are management’s current assumptions and beliefs based on currently available information. Such forward- looking statements are subject to a number of risks, uncertainties and other factors. Accordingly, actual results may differ materially from those projected due to various factors. FORWARD-LOOKING STATEMENTS Forward-looking statements such as those relating to earnings forecasts and other projections contained in this material are management’s current assumptions and beliefs based on currently available information. Such forward- looking statements are subject to a number of risks, uncertainties and other factors. Accordingly, actual results may differ materially from those projected due to various factors. February 8, 2008 Earnings of Fiscal 2008 3Q Ended December 31, 2007 1 +¥108.94¥94.86¥203.80Earnings per Share -(44.6)44.6- Structural Reform Expenses +46.5+56.5121.55.9%178.08.3%Operating Income +3.3+68.92,068.5100.0%2,137.4100.0%Revenue % Change 48.4 112.3 166.1 ¥116 ¥147 2.3% 5.4% 8.0% 9 Months FY2007 (Apr. 1 to Dec. 31, 2006) +7.2+11.9178.08.3% Pro-forma Operating Income +114.5 +65.2 +¥1 +¥16 +55.5 +73.2 Amount 103.9 185.5 4.9%Net Income ¥117 ¥163 Exchange Rates US$ Euro 8.7% Income Before Income Taxes 9 Months FY2008 (Apr. 1 to Dec. 31, 2007) Performance Summary for 9 Months FY2008 Billions of yen Profitability increased due to the rise in sales volume of principal products as well as to such factors as yen depreciation and the benefits of structural reforms.
- 2. 2 Actively Executed Share Buybacks during 3Q Distribution of Profits to Shareholders ¥34.1¥19.4¥14.7 Value of shares bought (in Billions) 2,700 October 2007 6,700 Total 4,000 November 2007 Number of shares bought (in Thousands) FY2008 A Return to Shareholders Ratio Approx. 43% (Forecast) A Return to Shareholders Ratio Forecast: Approx. 43% Cash Dividends 1H (Result) (YoY +¥5)¥17.50 Year total (Forecast) (YoY +¥10)¥35.00 Cash dividends+Share buybacks Consolidated net income As of Dec. 31, 2007 Ratio of Treasury Stocks to Outstanding Shares 2.0% 3 Imaging Solutions (9 months ended Dec. 31, 2007) While the color film market shrank, the overall sales decline was kept to a small margin due to a rise in sales of color paper and other products. ¥443.7 billion (YoY:-7.2%) Despite the impact of persistently high silver prices, cost-reduction benefits from structural reforms and the effect of yen depreciation enabled the restoration of profitability. RevenueRevenue Operating IncomeOperating Income Operating Segments Billions of yen *Note: After elimination of intersegment transaction 9 months FY2007 ended Dec. 31, 2006 Revenue Pro-forma Operating Income (Excluding structural reform expenses) Operating Income Revenue* /Operating IncomeRevenue* /Operating Income [ ]: Operating Margin ( ): YoY Comparison 478.0 443.7 24.4 16.0 -7.4 ¥16.0 billion (YoY: Restored profitability) (In comparison with pro-forma operating income of the previous fiscal year YoY: -34.8%) [5.1%] [-1.5%] 9 months FY2008 ended Dec. 31, 2007 (-7.2%) [3.6%]
- 3. 4 Market shrinkage led to a sales decline, but Fujifilm’s market share increased. Despite the emerging impact of the subprime loan crisis on the North American market at the end of 2007, the global digital camera market continued to expand. During the nine-month period through December, Fujifilm achieved its target for its worldwide digital camera sales volume by increasing it by 33% from the same period of the previous year, to 6.7 million units. Fujifilm proactively promoted sales of newly launched digital camera models. Sales of the FinePix F50fd and the FinePix F100fd were robust in Japan, and the FinePix Z10fd―a highly stylish, strategically emphasized product―was a major hit worldwide. Fujifilm’s structural reforms aimed at strengthening the Company’s business base (announced in September 2007) are proceeding in accordance with plans. Sales increased due to such factors as a rise in “Print at retail” digital photo printing business. An alliance arranged with Mitsubishi Paper Mills, Ltd., is designed to augment photographic printing paper manufacturing productivity. The decline in sales of Frontier minilabs continued due to a drop in new installations by major customers that had already installed such minilabs. Color Films and OthersColor Films and Others Electronic ImagingElectronic Imaging Color Paper and ChemicalsColor Paper and Chemicals Photofinishing EquipmentPhotofinishing Equipment 478.0 Breakdown of RevenueBreakdown of Revenue Color Films and Others Electronic Imaging Color Paper and Chemicals Photofinishing Equipment Labs and FDi services Operating Segments Billions of yen 17% 28% 21% 8% 20% 9 months FY2007 ended Dec. 31, 2006 YoY: -24% YoY: +2% YoY: +4% YoY: -23% 9 months FY2008 ended Dec. 31, 2007 443.7 14% 31% 23% 7% 17% 5 Information Solutions (9 months ended Dec. 31, 2007) Consolidated revenue increased, reflecting such factors as growth in sales of medical equipment and materials, flat panel display materials, graphic arts printing plates, and lens units for camera phones. Billions of yen Operating Segments ¥817.0 billion (YoY:+8.9%) *Note:After elimination of intersegment transaction RevenueRevenue Operating IncomeOperating Income Revenue* /Operating IncomeRevenue* /Operating Income Growth in sales of principal products contributed to a rise in profitability. Other factors boosting profitability included cost reductions accompanying structural reforms and the effect of yen depreciation. [ ]: Operating Margin ( ): YoY Comparison 750.3 817.0 86.8 104.5 74.1 Revenue Pro-forma Operating Income (Excluding structural reform expenses) Operating Income [11.5%] [9.8%] ¥104.5 billion (YoY: +41.1% ) (In comparison with pro-forma operating income of the previous fiscal year YoY : +20.4%) 9 months FY2007 ended Dec. 31, 2006 9 months FY2008 ended Dec. 31, 2007 (+8.9%) [12.8%] (+41.1%)
- 4. 6 Higher sales were recorded of FCR equipment and materials and medical imaging network systems. An additional contribution was made by FUJIFILM RI Pharma Co., Ltd., which was acquired in October 2006. Medical Systems / Life SciencesMedical Systems / Life Sciences Graphic ArtsGraphic Arts Operating Segments 750.3 Breakdown of RevenueBreakdown of Revenue Medical Systems / Life Sciences Graphic Arts FPD Materials Recording Media Office & Industry Billions of yen 24% 28% 18% 11% 18% Sales of printing plates grew, reflecting rising demand in the BRIC countries and the increasing use of CTP products. The business expanded in industrial-use inkjet printers that are designed to use the UV inks of FUJIFILM Sericol. YoY: +12% YoY: +9% Fujifilm continued to increase sales of such FPD materials as WV Film as well as high-value-added film products for VA-mode and IPS-mode LCDs. FUJIFILM Kyushu Co., Ltd., began operating its No. 2 FUJITAC manufacturing plant in August 2007, and an additional manufacturing line began operating in January 2008. FPD MaterialsFPD Materials YoY: +19% In the optical device product field, Fujifilm greatly expanded its sales of lens units for camera phones. In the advanced marking business, a smooth increase was achieved in sales of industrial inkjet printer-heads. Fujifilm launched LTO Ultrium 4 and increased its sales volume in the mid- range data storage media market, but harsh price competition continued and restrained its revenue. Recording MediaRecording Media Office & IndustryOffice & Industry YoY: -12% YoY: +8% 9 months FY2007 ended Dec. 31, 2006 9 months FY2008 ended Dec. 31, 2007 817.0 25% 28% 19% 9% 18% *Note: Linear Tape-Open, LTO, the LTO logo, Ultrium, and the Ultrium logo are trademarks of Hewlett-Packard, IBM, and Quantum in the United States, other countries, or both. 7 840.2 876.7 60.7 55.3 Revenue Operating Income Document Solutions (9 months ended Dec. 31, 2007) Revenue increased, reflecting strong sales of color digital multifunction devices and on-demand publishing systems in the Asia-Pacific region including China, as well as robust exports of such products to Europe and North America. Despite a rise in SG&A expenses accompanying sales expansion in the growth markets of the Asia- Pacific region including China, profitability was up due to such factors as increased office product business sales. Operating Segments Billions of yen [6.5%] ¥876.7 billion (YoY:+4.3% ) *Note:After elimination of intersegment transaction RevenueRevenue Operating IncomeOperating Income Revenue* /Operating IncomeRevenue* /Operating Income [ ]: Operating Margin ( ): YoY Comparison ¥60.7 billion (YoY:+9.7% ) 9 months FY2007 ended Dec. 31, 2006 9 months FY2008 ended Dec. 31, 2007 (+4.3%) [6.9%] (+9.7%)
- 5. 8 While domestic sales were flat, we worked to reinforce our marketing capabilities through the launch of nine new product models, including color digital multifunction devices launched at the end of November 2007 that incorporate an LED printer-head system. Large increases were recorded in sales of color devices in the Asia-Pacific region including China, and in export shipments to Europe and North America. Operating Segments 840.2 Breakdown of RevenueBreakdown of Revenue Office Products Office Printers Production Services Global Services Billions of yen Office ProductsOffice Products Office PrintersOffice Printers Production ServicesProduction Services Global ServicesGlobal Services 55% 17% 12% 5% Growth was achieved in the domestic sales volume of our own brand color office printers centered on the DocuPrint C3050, and the newly launched DocuPrint C2250. In the Asia-Pacific region including China, a large increase was recorded in the sales volumes of both color and monochrome models. Large increases were recorded in sales of publishing systems in the Asia- Pacific region including China, and in export shipments to Europe and North America. The world’s fastest xerography-type color printer has been launched—the 490/980 Color Continuous Feed Printing Systems. Continued growth was achieved in document outsourcing business both in Japan and overseas. Fuji Xerox created an internal control system advisory center in order to strengthen its capabilities for meeting customer needs related to internal control systems. YoY: +5% YoY: +7% YoY: +23% 9 months FY2007 ended Dec. 31, 2006 9 months FY2008 ended Dec. 31, 2007 876.7 55% 17% 12% 6% YoY: +1% 9 Despite the revision of exchange rates forecast, we have not made changes in our previously announced full-year performance projection. Operating income is expected to rise to ¥210.0 billion, and we forecast that we will attain record high levels of operating income, income before income taxes, and net income. Forecast for FY2008 Ending March 31, 2008 -(94.1)94.1-Structural Reform Expenses +85.7+97.0113.04.1%210.07.4%Operating Income +2.4+67.52,782.5100.0%2,850.0100.0%Revenue % Change 34.4 103.2 207.1 ¥117 ¥149 1.2% 3.7% 7.4% FY2007 Result (Apr. 1, 2006 to Mar. 31, 2007) +1.4+2.9210.07.4% Pro-forma Operating Income +248.4 +103.4 ¥(3) +¥10 +85.6 +106.8 Amount 120.0 210.0 4.2%Net Income *¥114 *¥159 Exchange Rates US$ Euro 7.4% Income Before Income Taxes FY2008 Forecast (Apr. 1, 2007 to Mar. 31, 2008) (Announced on Oct. 30 2007) Billions of yen *Note: Revision of exchange rates forecast [Previous forecast Recent forecast] 4Q US$:¥110 ¥105 / Euro: ¥150 ¥150, Full year US$:¥115 ¥114 / Euro: ¥156 ¥159
- 6. 10 +¥29.22¥48.17¥77.39Earnings per Share -(2.6)2.6-Structural Reform Expenses (1.9)(1.4)70.79.9%69.39.5%Operating Income +1.8+12.8716.5100.0%729.3100.0%Revenue % Change 24.6 55.6 73.3 ¥118 ¥151 3.4% 7.8% 10.2% 3Q Months FY2007 (Oct. 1 to Dec. 31, 2006) (5.4)(4.0)69.39.5% Pro-forma Operating Income +59.3 +27.1 ¥(5) +¥13 +14.6 +15.1 Amount 39.2 70.7 5.4%Net Income ¥113 ¥164 Exchange Rates US$ Euro 9.7% Income Before Income Taxes 3Q Months FY2008 (Oct. 1 to Dec. 31, 2007) Billions of yen Reference Data Performance Summary for 3Q FY2008 (3 months ended Dec. 31, 2006) 11 Imaging Solutions (3 months ended Dec. 31, 2007) Billions of yen *Note: After elimination of intersegment transaction 3Q FY2007 3 months ended Dec. 31, 2006 Revenue Pro-forma Operating Income (Excluding structural reform expenses) Operating Income Revenue* /Operating IncomeRevenue* /Operating Income [ ]: Operating Margin ( ): YoY Comparison 170.9 152.0 13.3 5.9 11.2[7.7%] [6.5%] 170.9 Breakdown of RevenueBreakdown of Revenue Color Films and Others Electronic Imaging Color Paper and Chemicals Photofinishing Equipment Labs and FDi services Billions of yen 15% 31% 20% 7% 21% 3Q FY2007 3 months ended Dec. 31, 2006 Reference Data 3Q FY2008 3 months ended Dec. 31, 2007 3Q FY2008 3 months ended Dec. 31, 2007 (-11.1%) [3.9%] (-46.7%) 152.0 11% 34% 23% 6% 18% YoY -33% -2% Same level -30% -25%
- 7. 12 265.1 274.4 39.5 38.5 39.0 Information Solutions (3 months ended Dec. 31, 2007) Billions of yen *Note:After elimination of intersegment transaction Revenue* /Operating IncomeRevenue* /Operating Income [ ]: Operating Margin ( ): YoY Comparison Revenue Pro-forma Operating Income (Excluding structural reform expenses) Operating Income [14.9%] [14.7%] 265.1 Breakdown of RevenueBreakdown of Revenue Medical Systems / Life Sciences Graphic Arts FPD Materials Recording Media Office & Industry Billions of yen 24% 28% 19% 11% 18% Reference Data 3Q FY2007 3 months ended Dec. 31, 2006 3Q FY2007 3 months ended Dec. 31, 2006 3Q FY2008 3 months ended Dec. 31, 2007 3Q FY2008 3 months ended Dec. 31, 2007 (+3.5%) [14.0%] (-1.3%) 274.4 23% 28% 20% 9% 19% YoY +2% +5% +12% -12% +5% 13 280.5 302.9 26.1 21.2 Revenue Operating Income Document Solutions (3 months ended Dec. 31, 2007) Billions of yen [7.5%] *Note:After elimination of intersegment transaction Revenue* /Operating IncomeRevenue* /Operating Income [ ]: Operating Margin ( ): YoY Comparison 280.5 Breakdown of RevenueBreakdown of Revenue Office Products Office Printers Production Services Global Services Billions of yen 55% 17% 12% 5% Reference Data 3Q FY2007 3 months ended Dec. 31, 2006 3Q FY2007 3 months ended Dec. 31, 2006 3Q FY2008 3 months ended Dec. 31, 2007 3Q FY2008 3 months ended Dec. 31, 2007 (+8.0%) [8.6%] (+23.0%) 302.9 55% 17% 12% 7% YoY +8% +9% +7% +33%
- 8. 14 Capital Expenditures* 7.9 9.2 9.2 20.7 20.7 24.3 5.1 3.5 4.2 0.1 33.7 33.4 Imaging Solutions Information Solutions Document Solutions ■ Corporate 200.0 Reference Data Billions of yen 3Q3Q Fiscal YearFiscal Year 2005 2006 2007 3 months ended Dec. 31, Fiscal year ended(ending) Mar. 31, (Forecast) *Note: Figures do not include amounts for rental equipment handled by the Document Solutions segment. 24.5 24.2 25.6 81.2 63.9 74.8 18.3 12.4 13.9 0.1 2005 2006 2007 9 months ended Dec. 31, 124.0 100.5 40.8 48.1 54.0 114.1 96.0 119.0 24.9 19.8 27.0 1.3 179.8 165.2 2006 2007 2008 9 Months9 Months 37.8 114.4 15 Reference Data *Note: Figures do not include amounts for rental equipment handled by the Document Solutions segment. Depreciation & Amortization* 17.8 18.5 20.6 18.1 21.9 29.4 16.2 8.7 7.4 0.1 52.1 49.1 Imaging Solutions Information Solutions Document Solutions ■ Corporate 233.0 Billions of yen 3Q3Q Fiscal YearFiscal Year 2005 2006 2007 3 months ended Dec. 31, Fiscal year ended (ending) Mar. 31, (Forecast) 51.1 54.4 59.3 55.0 63.4 79.2 50.6 41.3 27.6 0.4 2005 2006 2007 9 months ended Dec. 31, 156.7 159.1 69.2 74.3 80.9 88.2 75.3 52.8 0.1 225.4 215.4 2006 2007 2008 9 Months9 Months 41.932.235.9 114.7107.9105.0 163.0146.4156.9 Depreciation* 8.0-- 18.0-- 28.0-- Effect of the adoption of revised tangible asset depreciation methods 57.5 166.5
- 9. 16 Billions of yen Reference Data R&D Expenses Ratio of R&D expenses to revenue (Forecast) 6.06.0 6.6 42.544.9 2005 2006 2007 3 months ended Dec. 31, 6.9 6.5 6.3 133.1137.3 2005 2006 2007 9 months ended Dec. 31, Fiscal year ended (ending) Mar. 31, 7.0 6.4 6.8 177.0182.1 2006 2007 2008 200.0 3Q3Q Fiscal YearFiscal Year9 Months9 Months 43.8 134.5 17 SG&A Expenses Billions of yen Reference Data Ratio of SG&A expenses to revenue 25.9 26.7 27.6 191.2188.1 2005 2006 2007 3 months ended Dec. 31, 26.4 27.427.9 566.8552.7 2005 2006 2007 9 months ended Dec. 31, Fiscal year ended Mar. 31, 27.3 27.6 735.1 2006 2007 760.1 563.0 3Q3Q Fiscal YearFiscal Year9 Months9 Months 188.9
- 10. 18 77,838 Dec. 31 2006 79,279 Dec. 31 76,358 Mar. 31 78,161 Jun. 30 77,555 Sept. 30 2007 Consolidated Total Exchange Rates Number of Employees Yen Reference Data 147 116 149 117 156 119 4Q 151 118 3Q 9 months 147 116 2Q 143 115 1Q FY 2007 150 105 4Q Estimated Estimated 159 114 163 117 9 months 164 113 3Q 162 118 2Q 162 121 1Q FY 2008 Euro US$ IR Office, Corporate Planning Div. We will use leading-edge, proprietary technologies to provide top- quality products and services that contribute to the advancement of culture, science, technology and industry, as well as improved health and environmental protection in society. Our overarching aim is to help enhance the quality of life of people worldwide.