SlideShare uma empresa Scribd logo
1 de 11
UNIVERSIDAD NACIONAL DEL ALTIPLANO

                                                MAESTRIA EN CIENCIAS DE LA INGENIERIA AGRICOLA

                                                       MENCIÓN: GESTION Y AUDITORIA AMBIENTAL

                                        CURSO: INVESTIGACIÓN EN GESTIÓN Y AUDITORIA AMBIENTAL II

                                                                                  CUESTIONARIO Nº 1

     PRESENTADO POR : Miriam Miluska Flores Copa


1.   Obtenga las estadísticas descriptivas (promedio, varianza, máximo, mínimo, coeficiente de asimetría y apuntamiento de Kurtosis) para:

a. Las edades, según el estado civil.


                                                                                   Estadísticos descriptivos

                                  N           Mínimo             Máximo             Media        Desv. típ.      Varianza              Asimetría                     Curtosis

                              Estadístico    Estadístico        Estadístico       Estadístico    Estadístico    Estadístico    Estadístico    Error típico   Estadístico    Error típico

     edad cumplida                      44             18                 60             34,80        12,714        161,655            ,523           ,357          -,993            ,702

     estado civil                       44                 1                  3           1,93           ,759           ,577           ,116           ,357         -1,221            ,702

     N válido (según lista)             44
b. Las tallas, según la región de procedencia.


                                                                                Estadísticos descriptivos

                                N           Mínimo            Máximo             Media        Desv. típ.      Varianza              Asimetría                     Curtosis

                            Estadístico    Estadístico       Estadístico       Estadístico    Estadístico    Estadístico    Estadístico    Error típico   Estadístico    Error típico

   talla en cm.                       44           149               177            165,55           6,750        45,556           -,220           ,357          -,718            ,702

   procedencia                        44                 1                 3           1,82           ,815           ,664           ,353           ,357         -1,402            ,702

   N válido (según lista)             44


c. Las tallas, según el estado civil y región de procedencia.


                                                                                Estadísticos descriptivos

                                N           Mínimo            Máximo             Media        Desv. típ.      Varianza              Asimetría                     Curtosis

                            Estadístico    Estadístico       Estadístico       Estadístico    Estadístico    Estadístico    Estadístico    Error típico   Estadístico    Error típico

   talla en cm.                       44           149               177            165,55           6,750        45,556           -,220           ,357          -,718            ,702

   estado civil                       44                 1                 3           1,93           ,759           ,577           ,116           ,357         -1,221            ,702

   procedencia                        44                 1                 3           1,82           ,815           ,664           ,353           ,357         -1,402            ,702

   N válido (según lista)             44
d. Los pesos, según la variable sexo, grado de instrucción y región de procedencia.


                                                                                Estadísticos descriptivos

                                N           Mínimo            Máximo             Media        Desv. típ.      Varianza              Asimetría                     Curtosis

                            Estadístico    Estadístico       Estadístico       Estadístico    Estadístico    Estadístico    Estadístico    Error típico   Estadístico    Error típico

   peso en kg.                        44             58                84             70,61          6,499        42,243            ,221           ,357          -,247            ,702

   sexo del encuestado                44                 1                 2           1,55           ,504           ,254          -,189           ,357         -2,060            ,702

   grado instruccion                  44                 1                 3           2,20           ,795           ,632          -,390           ,357         -1,298            ,702

   procedencia                        44                 1                 3           1,82           ,815           ,664           ,353           ,357         -1,402            ,702

   N válido (según lista)             44
2.   Presente tablas de frecuencia y gráficos, que muestre:

a. Nro. De hijos.


                                    número de hijos

                                                                          Porcentaje
                       Frecuencia       Porcentaje    Porcentaje válido   acumulado

     Válidos   0                    8          18,2               18,2             18,2

               1                11             25,0               25,0             43,2

               2                    8          18,2               18,2             61,4

               3                    8          18,2               18,2             79,5

               4                    5          11,4               11,4             90,9

               5                    3           6,8                 6,8            97,7

               6                    1           2,3                 2,3           100,0

               Total            44            100,0              100,0


                                    Gráfico de Numero de Hijos
b. Porcentaje de encuestados, según región de procedencia.

                                    procedencia

                                                                      Porcentaje
                      Frecuencia    Porcentaje    Porcentaje válido   acumulado

   Válidos   costa             19          43,2               43,2             43,2

             sierra            14          31,8               31,8             75,0

             selva             11          25,0               25,0            100,0

             Total             44         100,0              100,0
c. Porcentaje de encuestados, según grado de instrucción.

                                 grado instrucción

                                                                          Porcentaje
                          Frecuencia    Porcentaje    Porcentaje válido   acumulado

   Válidos   primaria              10          22,7               22,7             22,7

             secundaria            15          34,1               34,1             56,8

             superior              19          43,2               43,2            100,0

             Total                 44         100,0              100,0
d. Porcentaje de encuestados, según grado de instrucción y separados por sexo.


                             sexo del encuestado

                                                                      Porcentaje
                      Frecuencia    Porcentaje    Porcentaje válido   acumulado

  Válidos   hombre             20          45,5               45,5             45,5

            mujer              24          54,5               54,5            100,0

            Total              44         100,0              100,0
3.      Obtenga una tabla de contingencia, clasificados por:

a. Sexo y estado civil.

               Tabla de contingencia sexo del encuestado * estado civil

Recuento

                                                          estado civil

                                           soltero          casado         viudo         Total

sexo del encuestado       hombre                     8               7             5             20

                          mujer                      6             12              6             24

Total                                                14            19              11            44


b. Estado civil y grado de instrucción.

            Tabla de contingencia estado civil * grado instrucción

Recuento

                                       grado instrucción

                            primaria       secundaria           superior       Total

estado civil    soltero                2                    7              5            14

                casado                 6                    7              6            19

                viudo                  2                    1              8            11

Total                              10                     15             19             44
c. Grado de instrucción, región y sexo.

         Tabla de contingencia grado instruccion * procedencia * sexo del encuestado

Recuento

                                                             procedencia

sexo del encuestado                             costa          sierra       selva       Total

hombre      grado instruccion   primaria                0               1           2           3

                                secundaria              3               3           0           6

                                superior                4               3           4           11

            Total                                       7               7           6           20

mujer       grado instruccion   primaria                2               3           2           7

                                secundaria              5               1           3           9

                                superior                5               3           0           8

            Total                                       12              7           5           24


4.   ¿Se puede decir que el gasto realizado por las damas es superior a 800 soles?

No existe datos para poder afirmar.


5.   ¿Se puede afirmar que el número de hijos de los entrevistados es superior a 2?

No se puede afirmar ya que solo el 18.2 % tienen un numero de 2 y 3 hijos y un 25 %
tienen un numero 1 hijo.

Mais conteúdo relacionado

Destaque

2024 State of Marketing Report – by Hubspot
2024 State of Marketing Report – by Hubspot2024 State of Marketing Report – by Hubspot
2024 State of Marketing Report – by HubspotMarius Sescu
 
Everything You Need To Know About ChatGPT
Everything You Need To Know About ChatGPTEverything You Need To Know About ChatGPT
Everything You Need To Know About ChatGPTExpeed Software
 
Product Design Trends in 2024 | Teenage Engineerings
Product Design Trends in 2024 | Teenage EngineeringsProduct Design Trends in 2024 | Teenage Engineerings
Product Design Trends in 2024 | Teenage EngineeringsPixeldarts
 
How Race, Age and Gender Shape Attitudes Towards Mental Health
How Race, Age and Gender Shape Attitudes Towards Mental HealthHow Race, Age and Gender Shape Attitudes Towards Mental Health
How Race, Age and Gender Shape Attitudes Towards Mental HealthThinkNow
 
AI Trends in Creative Operations 2024 by Artwork Flow.pdf
AI Trends in Creative Operations 2024 by Artwork Flow.pdfAI Trends in Creative Operations 2024 by Artwork Flow.pdf
AI Trends in Creative Operations 2024 by Artwork Flow.pdfmarketingartwork
 
PEPSICO Presentation to CAGNY Conference Feb 2024
PEPSICO Presentation to CAGNY Conference Feb 2024PEPSICO Presentation to CAGNY Conference Feb 2024
PEPSICO Presentation to CAGNY Conference Feb 2024Neil Kimberley
 
Content Methodology: A Best Practices Report (Webinar)
Content Methodology: A Best Practices Report (Webinar)Content Methodology: A Best Practices Report (Webinar)
Content Methodology: A Best Practices Report (Webinar)contently
 
How to Prepare For a Successful Job Search for 2024
How to Prepare For a Successful Job Search for 2024How to Prepare For a Successful Job Search for 2024
How to Prepare For a Successful Job Search for 2024Albert Qian
 
Social Media Marketing Trends 2024 // The Global Indie Insights
Social Media Marketing Trends 2024 // The Global Indie InsightsSocial Media Marketing Trends 2024 // The Global Indie Insights
Social Media Marketing Trends 2024 // The Global Indie InsightsKurio // The Social Media Age(ncy)
 
Trends In Paid Search: Navigating The Digital Landscape In 2024
Trends In Paid Search: Navigating The Digital Landscape In 2024Trends In Paid Search: Navigating The Digital Landscape In 2024
Trends In Paid Search: Navigating The Digital Landscape In 2024Search Engine Journal
 
5 Public speaking tips from TED - Visualized summary
5 Public speaking tips from TED - Visualized summary5 Public speaking tips from TED - Visualized summary
5 Public speaking tips from TED - Visualized summarySpeakerHub
 
ChatGPT and the Future of Work - Clark Boyd
ChatGPT and the Future of Work - Clark Boyd ChatGPT and the Future of Work - Clark Boyd
ChatGPT and the Future of Work - Clark Boyd Clark Boyd
 
Getting into the tech field. what next
Getting into the tech field. what next Getting into the tech field. what next
Getting into the tech field. what next Tessa Mero
 
Google's Just Not That Into You: Understanding Core Updates & Search Intent
Google's Just Not That Into You: Understanding Core Updates & Search IntentGoogle's Just Not That Into You: Understanding Core Updates & Search Intent
Google's Just Not That Into You: Understanding Core Updates & Search IntentLily Ray
 
Time Management & Productivity - Best Practices
Time Management & Productivity -  Best PracticesTime Management & Productivity -  Best Practices
Time Management & Productivity - Best PracticesVit Horky
 
The six step guide to practical project management
The six step guide to practical project managementThe six step guide to practical project management
The six step guide to practical project managementMindGenius
 
Beginners Guide to TikTok for Search - Rachel Pearson - We are Tilt __ Bright...
Beginners Guide to TikTok for Search - Rachel Pearson - We are Tilt __ Bright...Beginners Guide to TikTok for Search - Rachel Pearson - We are Tilt __ Bright...
Beginners Guide to TikTok for Search - Rachel Pearson - We are Tilt __ Bright...RachelPearson36
 

Destaque (20)

2024 State of Marketing Report – by Hubspot
2024 State of Marketing Report – by Hubspot2024 State of Marketing Report – by Hubspot
2024 State of Marketing Report – by Hubspot
 
Everything You Need To Know About ChatGPT
Everything You Need To Know About ChatGPTEverything You Need To Know About ChatGPT
Everything You Need To Know About ChatGPT
 
Product Design Trends in 2024 | Teenage Engineerings
Product Design Trends in 2024 | Teenage EngineeringsProduct Design Trends in 2024 | Teenage Engineerings
Product Design Trends in 2024 | Teenage Engineerings
 
How Race, Age and Gender Shape Attitudes Towards Mental Health
How Race, Age and Gender Shape Attitudes Towards Mental HealthHow Race, Age and Gender Shape Attitudes Towards Mental Health
How Race, Age and Gender Shape Attitudes Towards Mental Health
 
AI Trends in Creative Operations 2024 by Artwork Flow.pdf
AI Trends in Creative Operations 2024 by Artwork Flow.pdfAI Trends in Creative Operations 2024 by Artwork Flow.pdf
AI Trends in Creative Operations 2024 by Artwork Flow.pdf
 
Skeleton Culture Code
Skeleton Culture CodeSkeleton Culture Code
Skeleton Culture Code
 
PEPSICO Presentation to CAGNY Conference Feb 2024
PEPSICO Presentation to CAGNY Conference Feb 2024PEPSICO Presentation to CAGNY Conference Feb 2024
PEPSICO Presentation to CAGNY Conference Feb 2024
 
Content Methodology: A Best Practices Report (Webinar)
Content Methodology: A Best Practices Report (Webinar)Content Methodology: A Best Practices Report (Webinar)
Content Methodology: A Best Practices Report (Webinar)
 
How to Prepare For a Successful Job Search for 2024
How to Prepare For a Successful Job Search for 2024How to Prepare For a Successful Job Search for 2024
How to Prepare For a Successful Job Search for 2024
 
Social Media Marketing Trends 2024 // The Global Indie Insights
Social Media Marketing Trends 2024 // The Global Indie InsightsSocial Media Marketing Trends 2024 // The Global Indie Insights
Social Media Marketing Trends 2024 // The Global Indie Insights
 
Trends In Paid Search: Navigating The Digital Landscape In 2024
Trends In Paid Search: Navigating The Digital Landscape In 2024Trends In Paid Search: Navigating The Digital Landscape In 2024
Trends In Paid Search: Navigating The Digital Landscape In 2024
 
5 Public speaking tips from TED - Visualized summary
5 Public speaking tips from TED - Visualized summary5 Public speaking tips from TED - Visualized summary
5 Public speaking tips from TED - Visualized summary
 
ChatGPT and the Future of Work - Clark Boyd
ChatGPT and the Future of Work - Clark Boyd ChatGPT and the Future of Work - Clark Boyd
ChatGPT and the Future of Work - Clark Boyd
 
Getting into the tech field. what next
Getting into the tech field. what next Getting into the tech field. what next
Getting into the tech field. what next
 
Google's Just Not That Into You: Understanding Core Updates & Search Intent
Google's Just Not That Into You: Understanding Core Updates & Search IntentGoogle's Just Not That Into You: Understanding Core Updates & Search Intent
Google's Just Not That Into You: Understanding Core Updates & Search Intent
 
How to have difficult conversations
How to have difficult conversations How to have difficult conversations
How to have difficult conversations
 
Introduction to Data Science
Introduction to Data ScienceIntroduction to Data Science
Introduction to Data Science
 
Time Management & Productivity - Best Practices
Time Management & Productivity -  Best PracticesTime Management & Productivity -  Best Practices
Time Management & Productivity - Best Practices
 
The six step guide to practical project management
The six step guide to practical project managementThe six step guide to practical project management
The six step guide to practical project management
 
Beginners Guide to TikTok for Search - Rachel Pearson - We are Tilt __ Bright...
Beginners Guide to TikTok for Search - Rachel Pearson - We are Tilt __ Bright...Beginners Guide to TikTok for Search - Rachel Pearson - We are Tilt __ Bright...
Beginners Guide to TikTok for Search - Rachel Pearson - We are Tilt __ Bright...
 

Trabajo de investigacion ii

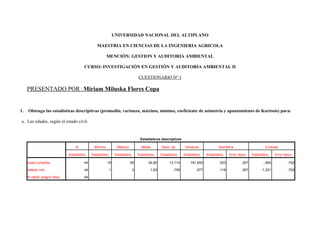
  • 1. UNIVERSIDAD NACIONAL DEL ALTIPLANO MAESTRIA EN CIENCIAS DE LA INGENIERIA AGRICOLA MENCIÓN: GESTION Y AUDITORIA AMBIENTAL CURSO: INVESTIGACIÓN EN GESTIÓN Y AUDITORIA AMBIENTAL II CUESTIONARIO Nº 1 PRESENTADO POR : Miriam Miluska Flores Copa 1. Obtenga las estadísticas descriptivas (promedio, varianza, máximo, mínimo, coeficiente de asimetría y apuntamiento de Kurtosis) para: a. Las edades, según el estado civil. Estadísticos descriptivos N Mínimo Máximo Media Desv. típ. Varianza Asimetría Curtosis Estadístico Estadístico Estadístico Estadístico Estadístico Estadístico Estadístico Error típico Estadístico Error típico edad cumplida 44 18 60 34,80 12,714 161,655 ,523 ,357 -,993 ,702 estado civil 44 1 3 1,93 ,759 ,577 ,116 ,357 -1,221 ,702 N válido (según lista) 44
  • 2. b. Las tallas, según la región de procedencia. Estadísticos descriptivos N Mínimo Máximo Media Desv. típ. Varianza Asimetría Curtosis Estadístico Estadístico Estadístico Estadístico Estadístico Estadístico Estadístico Error típico Estadístico Error típico talla en cm. 44 149 177 165,55 6,750 45,556 -,220 ,357 -,718 ,702 procedencia 44 1 3 1,82 ,815 ,664 ,353 ,357 -1,402 ,702 N válido (según lista) 44 c. Las tallas, según el estado civil y región de procedencia. Estadísticos descriptivos N Mínimo Máximo Media Desv. típ. Varianza Asimetría Curtosis Estadístico Estadístico Estadístico Estadístico Estadístico Estadístico Estadístico Error típico Estadístico Error típico talla en cm. 44 149 177 165,55 6,750 45,556 -,220 ,357 -,718 ,702 estado civil 44 1 3 1,93 ,759 ,577 ,116 ,357 -1,221 ,702 procedencia 44 1 3 1,82 ,815 ,664 ,353 ,357 -1,402 ,702 N válido (según lista) 44
  • 3. d. Los pesos, según la variable sexo, grado de instrucción y región de procedencia. Estadísticos descriptivos N Mínimo Máximo Media Desv. típ. Varianza Asimetría Curtosis Estadístico Estadístico Estadístico Estadístico Estadístico Estadístico Estadístico Error típico Estadístico Error típico peso en kg. 44 58 84 70,61 6,499 42,243 ,221 ,357 -,247 ,702 sexo del encuestado 44 1 2 1,55 ,504 ,254 -,189 ,357 -2,060 ,702 grado instruccion 44 1 3 2,20 ,795 ,632 -,390 ,357 -1,298 ,702 procedencia 44 1 3 1,82 ,815 ,664 ,353 ,357 -1,402 ,702 N válido (según lista) 44
  • 4.
  • 5. 2. Presente tablas de frecuencia y gráficos, que muestre: a. Nro. De hijos. número de hijos Porcentaje Frecuencia Porcentaje Porcentaje válido acumulado Válidos 0 8 18,2 18,2 18,2 1 11 25,0 25,0 43,2 2 8 18,2 18,2 61,4 3 8 18,2 18,2 79,5 4 5 11,4 11,4 90,9 5 3 6,8 6,8 97,7 6 1 2,3 2,3 100,0 Total 44 100,0 100,0 Gráfico de Numero de Hijos
  • 6. b. Porcentaje de encuestados, según región de procedencia. procedencia Porcentaje Frecuencia Porcentaje Porcentaje válido acumulado Válidos costa 19 43,2 43,2 43,2 sierra 14 31,8 31,8 75,0 selva 11 25,0 25,0 100,0 Total 44 100,0 100,0
  • 7. c. Porcentaje de encuestados, según grado de instrucción. grado instrucción Porcentaje Frecuencia Porcentaje Porcentaje válido acumulado Válidos primaria 10 22,7 22,7 22,7 secundaria 15 34,1 34,1 56,8 superior 19 43,2 43,2 100,0 Total 44 100,0 100,0
  • 8. d. Porcentaje de encuestados, según grado de instrucción y separados por sexo. sexo del encuestado Porcentaje Frecuencia Porcentaje Porcentaje válido acumulado Válidos hombre 20 45,5 45,5 45,5 mujer 24 54,5 54,5 100,0 Total 44 100,0 100,0
  • 9.
  • 10. 3. Obtenga una tabla de contingencia, clasificados por: a. Sexo y estado civil. Tabla de contingencia sexo del encuestado * estado civil Recuento estado civil soltero casado viudo Total sexo del encuestado hombre 8 7 5 20 mujer 6 12 6 24 Total 14 19 11 44 b. Estado civil y grado de instrucción. Tabla de contingencia estado civil * grado instrucción Recuento grado instrucción primaria secundaria superior Total estado civil soltero 2 7 5 14 casado 6 7 6 19 viudo 2 1 8 11 Total 10 15 19 44
  • 11. c. Grado de instrucción, región y sexo. Tabla de contingencia grado instruccion * procedencia * sexo del encuestado Recuento procedencia sexo del encuestado costa sierra selva Total hombre grado instruccion primaria 0 1 2 3 secundaria 3 3 0 6 superior 4 3 4 11 Total 7 7 6 20 mujer grado instruccion primaria 2 3 2 7 secundaria 5 1 3 9 superior 5 3 0 8 Total 12 7 5 24 4. ¿Se puede decir que el gasto realizado por las damas es superior a 800 soles? No existe datos para poder afirmar. 5. ¿Se puede afirmar que el número de hijos de los entrevistados es superior a 2? No se puede afirmar ya que solo el 18.2 % tienen un numero de 2 y 3 hijos y un 25 % tienen un numero 1 hijo.