
Recomendados
Mais conteúdo relacionado
Mais procurados
Semelhante a Flevy.com - Excel Model for Manufacturing Firm
Semelhante a Flevy.com - Excel Model for Manufacturing Firm (20)
Mais de David Tracy
Mais de David Tracy (20)
Último
Último (20)
Flevy.com - Excel Model for Manufacturing Firm
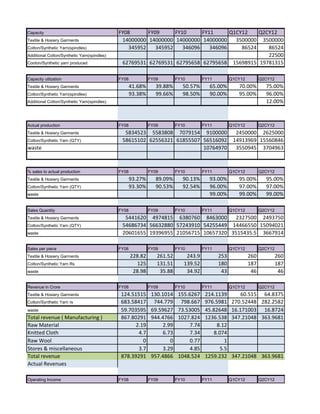
- 1. Capacity FY08 FY09 FY10 FY11 Q1CY12 Q2CY12 Textile & Hosiery Garments 14000000 14000000 14000000 14000000 3500000 3500000 Cotton/Synthetic Yarn(spindles) 345952 345952 346096 346096 86524 86524 Additional Cotton/Synthetic Yarn(spindles) 22500 Cooton/Synthetic yarn produced 62769531 62769531 62795658 62795658 15698915 19781315 Capacity utlization FY08 FY09 FY10 FY11 Q1CY12 Q2CY12 Textile & Hosiery Garments 41.68% 39.88% 50.57% 65.00% 70.00% 75.00% Cotton/Synthetic Yarn(spindles) 93.38% 99.66% 98.50% 90.00% 95.00% 96.00% Additional Cotton/Synthetic Yarn(spindles) 12.00% Actual production FY08 FY09 FY10 FY11 Q1CY12 Q2CY12 Textile & Hosiery Garments 5834523 5583808 7079154 9100000 2450000 2625000 Cotton/Synthetic Yarn (QTY) 58615102 62556321 61855507 56516092 14913969 15560846 waste 10764970 3550945 3704963 % sales to actual production FY08 FY09 FY10 FY11 Q1CY12 Q2CY12 Textile & Hosiery Garments 93.27% 89.09% 90.13% 93.00% 95.00% 95.00% Cotton/Synthetic Yarn (QTY) 93.30% 90.53% 92.54% 96.00% 97.00% 97.00% waste 99.00% 99.00% 99.00% Sales Quantity FY08 FY09 FY10 FY11 Q1CY12 Q2CY12 Textile & Hosiery Garments 5441620 4974815 6380760 8463000 2327500 2493750 Cotton/Synthetic Yarn (QTY) 54686734 56632880 57243910 54255449 14466550 15094021 waste 20601655 19396955 21056715 10657320 3515435.5 3667914 Sales per piece FY08 FY09 FY10 FY11 Q1CY12 Q2CY12 Textile & Hosiery Garments 228.82 261.52 243.9 253 260 260 Cotton/Synthetic Yarn Rs 125 131.51 139.52 180 187 187 waste 28.98 35.88 34.92 43 46 46 Revenue in Crore FY08 FY09 FY10 FY11 Q1CY12 Q2CY12 Textile & Hosiery Garments 124.51515 130.1014 155.6267 214.1139 60.515 64.8375 Cotton/Synthetic Yarn rs 683.58417 744.779 798.667 976.5981 270.52448 282.2582 waste 59.703595 69.59627 73.53005 45.82648 16.171003 16.8724 Total revenue ( Manufacturing ) 867.80291 944.4766 1027.824 1236.538 347.21048 363.9681 Raw Material 2.19 2.99 7.74 8.12 Knitted Cloth 4.7 6.73 7.34 8.074 Raw Wool 0 0 0.77 1 Stores & miscellaneous 3.7 3.29 4.85 5.5 Total revenue 878.39291 957.4866 1048.524 1259.232 347.21048 363.9681 Actual Revenues Operating Income FY08 FY09 FY10 FY11 Q1CY12 Q2CY12
- 2. Export sales 585.73 646.65 733.9667 881.4627 243.04734 254.7777 Domestic Sales 292.64 311.8 314.5571 377.7697 104.16315 109.1904 export incentives 35.63 38.34 55.35 66.42 Services rendered 3.49 4.8 6.57 7.55 Operating Income 917.49 1001.59 1110.444 1343.202 347.21048 363.9681 other income 10.03 6.71 10.35 10 power cost per unit FY08 FY09 FY10 FY11 Q1CY12 Q2CY12 average cost per unit 4.75 4.9 4.9 unit consumed per unit product FY08 FY09 FY10 FY11 Q1CY12 Q2CY12 Textile & Hosiery Garments 0.71 0.8 0.84 0.88 0.88 Cotton/Synthetic Yarn rs 4.25 4.59 4.65 4.8 4.8 power cost FY08 FY09 FY10 FY11 Q1CY12 Q2CY12 Textile & Hosiery Garments 3.376737 1.003618 1.075305 Cotton/Synthetic Yarn rs 148.607 43.429477 45.31318 151.9838 2008 2009 2010 2011 E 2012 E 2013 E Textile & Hosiery Garments 124.51515 130.1014 155.6267 214.1139 267.995 308.3938 Cotton/Synthetic Yarn 683.58417 744.779 798.667 976.5981 1181.8242 1384.776 waste 59.703595 69.59627 73.53005 45.82648 70.645301 85.89777
- 3. Q3CY12 Q4CY12 CY12 Q1CY13 Q2CY13 Q3CY13 Q4CY13 CY13 3500000 3500000 14000000 3500000 3500000 3500000 3500000 14000000 86524 86524 346096 86524 86524 86524 86524 346096 22500 22500 67500 22500 22500 22500 22500 90000 19781315 19781315 75042858 19781315 19781315 19781315 19781315 79125258 Q3CY12 Q4CY12 CY12 Q1CY13 Q2CY13 Q3CY13 Q4CY13 CY13 80.00% 85.00% 77.50% 85.00% 85.00% 90.00% 90.00% 87.50% 97.00% 98.00% 96.50% 98.00% 98.00% 99.00% 99.00% 98.50% 33.00% 66.60% 37.20% 66.60% 70.00% 80.00% 90.00% 76.65% Q3CY12 Q4CY12 CY12 Q1CY13 Q2CY13 Q3CY13 Q4CY13 CY13 2800000 2975000 10850000 2975000 2975000 3150000 3150000 12250000 16575139 18103815 65153769 18103815 18242616 18807845 19216085 74370362 3946462 4310432 15512802 4310432 4343480 4478058 4575258 17707229 Q3CY12 Q4CY12 CY12 Q1CY13 Q2CY13 Q3CY13 Q4CY13 CY13 95.00% 95.00% 95.00% 95.00% 95.00% 95.00% 95.00% 95.00% 97.00% 97.00% 97.00% 98.00% 98.00% 98.00% 98.00% 98.00% 99.00% 99.00% 99.00% 99.00% 99.00% 99.00% 99.00% 99.00% Q3CY12 Q4CY12 CY12 Q1CY13 Q2CY13 Q3CY13 Q4CY13 CY13 2660000 2826250 10307500 2826250 2826250 2992500 2992500 11637500 16077885 17560700 63199156 17741738 17877764 18431689 18831764 72882955 3906997 4267328 15357674 4267328 4300045 4433278 4529506 17530157 Q3CY12 Q4CY12 CY12 Q1CY13 Q2CY13 Q3CY13 Q4CY13 CY13 260 260 260 265 265 265 265 265 187 187 187 190 190 190 190 190 46 46 46 49 49 49 49 49 Q3CY12 Q4CY12 CY12 Q1CY13 Q2CY13 Q3CY13 Q4CY13 CY13 69.16 73.4825 267.995 74.89563 74.89563 79.30125 308.3938 79.30125 300.6564 328.3851 1181.824 337.093 339.6775 350.2021 1384.776 357.8035 17.97219 19.62971 70.6453 20.90991 21.07022 21.72306 85.89777 22.19458 387.7886 421.4973 1520.465 432.8986 435.6434 451.2264 1779.068 459.2993 8.53 8.96 8.88 9.8 1 1 6.5 7.5 387.7886 421.4973 1545.375 432.8986 435.6434 451.2264 459.2993 1806.328 Q3CY12 Q4CY12 CY12 Q1CY13 Q2CY13 Q3CY13 Q4CY13 CY13
- 4. 271.452 295.0481 1081.762 303.029 304.9504 315.8585 321.5095 1264.429 116.3366 126.4492 463.6124 129.8696 130.693 135.3679 137.7898 541.8983 79.7 95.69 8.68 9.98 387.7886 421.4973 1643.755 432.8986 435.6434 451.2264 459.2993 1921.998 10 10 Q3CY12 Q4CY12 CY12 Q1CY13 Q2CY13 Q3CY13 Q4CY13 CY13 4.9 4.9 4.9 5.1 5.1 5.1 5.1 5.1 Q3CY12 Q4CY12 CY12 Q1CY13 Q2CY13 Q3CY13 Q4CY13 CY13 0.88 0.88 0.88 0.92 0.92 0.92 0.92 0.92 4.8 4.8 4.8 5 5 5 5 5 Q3CY12 Q4CY12 CY12 Q1CY13 Q2CY13 Q3CY13 Q4CY13 CY13 1.146992 1.218679 4.444594 1.326077 1.326077 1.404081 1.404081 5.460315 48.26681 52.71831 189.7278 57.15633 57.59455 59.37905 60.66793 234.7979 194.1724 240.2582
- 5. Nakoda Ltd Balance Sheet - Consolidated - Actual - Schedules- [INR-Crore] DESCRIPTION Mar-08 Mar-09 SOURCES OF FUNDS: Share Capital 18.05 18.05 Face Value 5 5 No of shares 3.61 3.61 Share Warrants & Outstandings 0 0 Total Reserves 506.6 487.86 Securities Premium 209.59 209.59 Capital Reserves 13.63 13.63 Profit & Loss Account Balance 5.69 -27.97 General Reserves 277.69 283.38 Exchange Fluctuation reserve 0 9.23 Shareholder's Funds 524.65 505.91 Minority Interest 0.00 0.00 Secured Loans 801.94 634.48 Term Loans - Banks 393.18 366.17 Working Capital Loans - Banks 408.76 268.31 Vehicle loans 0.00 0.00 Unsecured Loans 25.27 6.27 Other Deposits 15.47 0 Other Unsecured Loan 9.8 6.27 Total Debts 827.21 640.75 Total Liabilities 1351.86 1146.66 Debt to Equity Ratio 2.576685 2.26653 APPLICATION OF FUNDS : Gross Block 1259.1 1324.8 Less: Accumulated Depreciation 609.77 676.06 Net Block 649.33 648.74 Capital Work in Progress 63.88 23.9 Investments 9 17.05 Current Assets, Loans & Advances 0 0 Inventories 405.13 201.73 As a % of Raw Material Consumed 89.14% 40.15% Sundry Debtors 219.55 237.16 As a % of Net Sales 23.95% 23.68% Cash and Bank 10.38 9.36 Loans and Advances 131.48 114.27 Total Current Assets 766.54 562.52 Less : Current Liabilities and Provisions Current Liabilities 72.39 56.07 Sundry Creditors 24.25 15.25 As a % of Raw Material 5.34% 3.03% Acceptances 9.12 1.95
- 6. As a % Raw Material 2.01% 0.39% Other Liabilities 39.02 38.87 Provisions 10.23 2.51 Total Current Liabilities 82.62 58.58 Net Current Assets 683.92 503.94 Deferred Tax Assets / Liabilities -53.67 -45.41 Total Assets 1352.46 1148.22 Contingent Liabilities 252.83 214.97 Book Value 145.67 140.69 Adjusted Book Value 145.67 140.69 CASH FLOW STATEMENT Cash Flow Statement Mar-08 Mar-09 PAT -15.8918 Dep 76.11 Others Operating profit before WC Changes 60.2182 Change in Current Assets 203 Change in Current Liabilities -24.04 Provisions 7.72 Deferred Tax Liability 8.26 Net Cash from Operating Activities 255.1582 Purchase Fixed Asset -65.7 CWIP 39.98 Purchase/Sale of investments -8.05 Cash from Investing Activities -33.77 Change in Minority Interest Issue of capital 0 Debt borowed -186.46 Premium on Issue of Capital 0 Repayment of Debt Dividend Paid and DDT Tax -1.805 Cash From Financing Activities -188.26 Foreign currency translation -34.15 Cash from all the activities -1.02 Opening balance of Cash 10.38 Closing balance of Cash 9.36
- 7. Mar-08 Mar-09 Share Capital 18.05 18.05 Total Reserves 506.6 487.86 Minority Interest 0 0 Total Debts 827.208 640.75 Total Liabilities 1351.858 1146.66 Gross Block 1259.1 1324.8 Less: Accumulated Depreciation 609.77 676.06 Net Block 649.33 648.74 Capital Work in Progress 63.88 23.9 Investments 9 17.05 Net Current Assets 683.92 503.94 Deferred Tax Assets / Liabilities -53.67 -45.41 Total Assets 1352.46 1148.22 Current Ratio 9.277899 9.602595 Interest coverage inventory days 161.1706 73.51456 creditor days 9.647244 5.557414 debtor days 87.34237 86.42598
- 8. Mar-10 Mar-11 Mar-12 Mar-13 18.05 18.05 18.05 18.05 5 5 5 5 3.61 3.61 3.61 3.61 0 0 0 0 535.04 614.3413 715.55585 841.0948 209.59 209.59 209.59 209.59 13.63 13.63 13.63 13.63 45.69 78.02 99.21 123.54 255.41 301.1 379.12126 478.3359 10.72 12.00 14.00 16.00 553.09 632.3913 733.60585 859.1448 0.00 0.00 0.00 0.00 845.95 1070.83 1300.20 1323.63 349.81 549.81 749.81 749.81 496.14 521.02 550.39 573.82 0.00 0.00 0.00 0.00 9.92 10 10 10 0 0 0 0 9.92 10 10 10 855.87 1080.83 1310.20 1333.63 1408.96 1713.22 2043.80 2192.77 2.547434 2.709119 2.7859674 2.552276 1376.49 1496.483 1616.483 1616.483 729.37 803.6344 885.51699 975.7791 647.12 692.8486 730.96601 640.7039 41.18 121.18 201.18 201.18 10.95 0 488.47 447.5576 552.63529 646.1962 90.16% 70.00% 70.00% 70.00% 245.41 308.6276 377.68547 441.6174 22.10% 23% 23% 23% 18.26 147.39 142.25 179.71 134.02 174.21 217.77 261.32 886.16 1077.788 1290.3399 1528.843 96.26 105.0784 112.58395 119.2669 16.94 19.18104 23.684369 27.69412 3.13% 3.00% 3.00% 3.00% 6.21 12.78736 15.78958 18.46275
- 9. 1.15% 2.00% 2.00% 2.00% 73.11 73.11 73.11 73.11 23.16 23.16 23.16 23.16 119.42 128.2384 135.74395 142.4269 766.74 949.5495 1154.596 1386.416 -55.58 -55.58 -55.58 -55.58 1410.41 1707.998 2031.162 2172.72 158.59 153.78 153.78 175.1776 203.21492 237.9903 Mar-10 Mar-11 Mar-12 Mar-13 53.44892 78.02126 99.214593 123.539 69.86 74.2844 81.882592 90.26216 123.3089 152.3057 181.09719 213.8011 -314.74 -62.49821 -217.68881 -201.0461 60.84 8.818398 7.5055507 6.682922 -20.65 0 0 0 -10.17 0 0 0 -161.4111 98.62585 -29.086069 19.43798 -51.69 -119.993 -120 0 -17.28 -80 -80 0 6.1 10.95 0 0 -62.87 -189.043 -200 0 0 0 0 0 215.12 224.96 229.36 23.43 0 0 0 0 -5.415 -5.415 -5.415 -5.415 209.71 219.55 223.95 18.02 23.48 8.90 129.13 -5.14 37.46 9.36 18.26 147.39 142.2529 18.26 147.39 142.25 179.71
- 10. Mar-10 Mar-11 Mar-12 Mar-13 18.05 18.05 18.05 18.05 535.04 614.3413 715.55585 844.6123 0 0 0 0 855.87 1080.832 1310.1961 1333.63 1408.96 1713.223 2043.802 2196.292 1376.49 1496.483 1616.483 1616.483 729.37 803.6344 885.51699 975.7791 647.12 692.8486 730.96601 640.7039 41.18 121.18 201.18 201.18 10.95 12 12 12 766.74 949.5495 1154.596 1389.934 -55.58 -55.58 -55.58 -55.58 1410.41 1707.998 2031.162 2176.237 7.420533 8.404564 9.5056901 10.73423 160.5588 121.6187 122.71411 122.7169 5.568134 5.212229 5.2591764 5.259296 80.66563 83.86605 83.86605 83.86605
- 11. Raw material cost FY08 FY09 FY10 FY11 Q1CY12 Manmade/Synthetic Fibres 10.77 14.32 9.29 15.37 3.56 Raw Cotton 439.15 523.12 541.71 504.61 151.41 Raw Wool of all Kinds 2.69 1.87 1.94 3.84 0.89 Cloth 1.79 1.22 1.32 2.53 0.59 Cotton Yarn 76.35 71.26 85.77 107.64 23.16 Synthetic Yarn 3.34 5.26 6.28 5.38 1.10 Total cost 534.09 617.05 646.30 639.37 Raw material cost /unit FY08 FY09 FY10 FY11 Q1CY12 Manmade/Synthetic Fibres 101.26 100.53 97.03 Raw Cotton 56.74 60.64 64.90 75.00 82 Raw Wool of all Kinds 221.99 330.26 267.67 Cloth 196.15 208.54 202.21 Cotton Yarn 132.03 133.65 129.16 Synthetic Yarn 116.96 109.96 97.31
- 12. Q2CY12 Q3CY12 Q4CY12 CY12 Q1CY13 Q2CY13 Q3CY13 Q4CY13 CY13 3.72 3.96 4.32 15.56 4.43 4.46 4.60 4.70 18.20 157.98 168.28 183.80 661.47 188.28 189.72 195.60 199.85 773.45 0.93 0.99 1.08 3.89 1.11 1.12 1.15 1.18 4.55 0.61 0.65 0.71 2.57 0.73 0.74 0.76 0.78 3.00 24.16 25.74 28.11 101.17 28.80 29.02 29.92 30.56 118.29 1.15 1.23 1.34 4.82 1.37 1.38 1.43 1.46 5.64 789.48 923.14 Q2CY12 Q3CY12 Q4CY12 CY12 Q1CY13 Q2CY13 Q3CY13 Q4CY13 CY13 82 82 82 82 84 84 84 84 84
- 13. 2.02% 2.32% 1.44% 82.22% 84.78% 83.82% 0.50% 0.30% 0.30% 0.33% 0.20% 0.20% 14.30% 11.55% 13.27% 0.62% 0.85% 0.97%
- 14. CY08 CY09 CY10 CY11 CY12 CY13 capital expendiure planned 200 200 0 Secured Loans Term Loans 393.178 366.17 349.81 549.81 749.81 749.81 Debt Repaid 27.01 0.00 0 0 Growth in sales 9.17% 10.87% 20.06% 22.54% 17.03% Working Capital Loans 408.76 268.31 496.14 521.02 550.39 573.82 Vehicle Loans 0.00 0.00 0 0 0 801.94 634.48 845.95 1070.83 1300.20 1323.63 Unsecured Loans from corporate bodies 9.8 6.27 9.92 10 10 10 from banks 15.47 Others 6.27 9.92 10.00 10.00 10.00 Total 827.21 640.75 855.87 1080.83 1310.20 1333.63 interest on term loan 20.51 20.48 32.43879 44.23879 44.23879 interest on term loan 5.60% 5.85% 5.90% 5.90% 5.90% Total interest paid 31.36 41.34 45.04 60.32 73.66 74.89 interest rate 6.45% 5.26% 5.58% 5.62% 5.62% Interest paid on other loans 20.83 24.56 27.88 29.42 30.65 Interest Paid 7.59% 4.9% 5.25% 5.25% 5.25% Interest Capitilised
- 15. Capital expenditure 200 200 2008 2009 2010 2011 2012 Fixed Assests Mar-08 Mar-09 Mar-10 Mar-11 Mar-12 Land and building 309.61 345.67 378.88 378.88 378.88 Plant and machinery 943.02 972.13 990.27 1110.27 1230.27 Furnitures 6.46 6.83 7.17 7.17 7.17 Intangible assests 0 0.163 0.163 0.163 0.163 Net Assests 1259.09 1324.793 1376.483 1496.483 1616.483 Dep Land and building 60.49 69.13 77.69 87.0128 97.45434 Dep Plant and machinery 544.15 601.45 645.89 710.479 781.5269 Dep Furnitures 5.12 5.43 5.71 6.0526 6.415756 Dep Intangible assests 0 0.03 0.06 0.09 0.12 Net Depreciation 609.76 676.04 729.35 803.6344 885.517 Net Block 649.33 648.753 647.133 692.8486 730.966 % increase dep of Land and building 14.3% 12.4% 12.0% 12.0% % increase dep of plant and machinery 10.5% 7.4% 10.0% 10.0% % increase dep of furniture 6.1% 5.2% 6.0% 6.0% % increase dep of Intangible assests Depreciation 74.2844 81.88259 Capital Work in progress Mar-08 Mar-09 Mar-10 Mar-11 Mar-12 Capital Work in Progress 63.88 23.9 41.18 121.18 201.18
- 16. 2013 60% Mar-13 378.88 1230.27 7.17 0.163 1616.483 109.1489 859.6796 6.800701 0.15 975.7791 640.7039 12.0% 10.0% 6.0% 90.26216 Mar-13 201.18 40%
- 17. Loans and Advances CY08 CY09 CY10 CY11 CY12 Deposits with Govt. Authorities 12.51 0.00 0.00 0.00 Share Application Money Advances Recoverable in Cash or in Kind 97.0 112.1 advance tax 4.7 21.9 total advance 101.8 134.0 174.2 217.8 Growth rate 32% 30% 25% Total 131.48 114.26 134.01 174.21 217.77
- 18. CY13 0.00 261.3 20% 261.32
- 19. Nahar Ltd Profit And Loss - Consolidated - Actual - Schedules- [INR-Crore] DESCRIPTION Mar-08 Mar-09 INCOME : Gross Sales 917.49 1001.59 Growth Rate % 9.17% Less: Excise Duty 0.93 0.23 As a % of Sales 0.10% 0.02% Net Sales 916.56 1001.36 Growth Rate % 9.25% EXPENDITURE : Increase/Decrease in Stock -10.55 9.11 Raw Material Consumed 454.50 502.50 As a % of Sales 49.59% 50.18% Power & Fuel Cost 137.15 130.12 As a % of Sales 14.96% 12.99% Employee Cost 69.78 70.71 As a % of Sales 7.61% 7.06% Other Manufacturing Expenses 70.29 70.76 As a % of Sales 7.67% 7.07% General and Administration Expenses 10.98 10.8 As a % of Sales 1.20% 1.08% Selling and Distribution Expenses 64.6 72.82 As a % of Sales 7.05% 7.27% Miscellaneous Expenses 1.77 48.1 As a % of Sales 0.19% 4.80% Total Expenditure 798.52 914.92 % change 14.58% As a % of Sales 87.12% 91.37% Operating Profit (Excl OI) 118.04 86.44 EBITDA Margin 12.88% 8.63% Other Income 10.04 6.72 Operating Profit 128.08 93.16 Operating Profit Margin 13.97% 9.30% Interest 31.36 41.39 As a % of debt 3.79% 6.46% PBDT 96.72 51.77 Depreciation 76.91 76.11 As a % of gross block 6.11% 5.75% Profit Before Taxation & Exceptional Items 19.81 -24.34 Exceptional Items - - Profit Before Tax 19.81 -24.34 PBT Margin 2.16% -2.43% Provision for Tax 7.82 -8.45
- 20. Tax Rate 39.47% 34.71% Profit After Tax 11.99 -15.89 PAT Margin 1.31% -1.59% Minority Interest Consolidated Net Profit 11.99 -15.89 Equity Dividend % 30.00% 10.00% Earnings Per Share 3.32 -4.40 Adjusted EPS 3.32 -4.40 current price is 108 4.67 as per moneycontrol interest coverage ratio 4.084327 2.250742 DESCRIPTION Mar-08 Mar-09 Net Sales 916.6 1001.4 Expenditure 798.5 914.9 PBIDT 128.1 93.2 Interest 31.4 41.4 Depreciation 76.9 76.1 Profit After Tax 12.0 -15.9 Equity Share Capital 18.0 18.0 EPS 3.3 0.0 96.7 51.8 Financial leverage 1.32422 1.799526 2008 2009
- 21. Mar-10 Mar-11 Mar-12 Mar-13 1110.444 1343.202 1643.755 1921.998 10.87% 20.96% 22.38% 16.93% 0.017 1.343202 1.643755 1.921998 0.00% 0.10% 0.10% 0.10% 1110.427 1341.859 1642.111 1920.076 10.89% 20.84% 22.38% 16.93% 4.38 541.78 639.37 789.48 923.14 48.79% 47.65% 48.08% 48.08% 140.27 161.9838 204.1724 250.2582 12.63% 12.07% 12.43% 13.03% 77.76 83.9808 90.69926 97.95521 7.00% 6.26% 5.52% 5.10% 74.04 94.02417 115.0628 134.5398 6.67% 7.01% 7.01% 7.01% 8.87 16.10231 19.70533 23.04091 0.80% 1.20% 1.20% 1.20% 70.97 93.93015 114.9478 134.4053 6.39% 7.00% 7.00% 7.00% 7.25 13.41859 16.42111 19.20076 0.65% 1.00% 1.00% 1.00% 925.32 1102.81 1350.49 1582.54 1.14% 19.18% 22.46% 17.18% 83.33% 82.19% 82.24% 82.42% 185.11 239.05 291.62 337.54 16.67% 17.81% 17.76% 17.58% 10.35 12 12 12 195.46 251.05 303.62 349.54 17.60% 18.71% 18.49% 18.20% 45.04 60.32 73.66 74.89 5.26% 5.58% 5.62% 5.62% 150.42 190.73 229.96 274.65 69.86 74.2844 81.88259 90.26216 5.08% 4.96% 5.07% 5.58% 80.56 116.45 148.08 184.39 - - - - 80.56 116.45 148.08 184.39 7.25% 8.68% 9.02% 9.60% 27.11 38.42838 48.86689 60.84756
- 22. 33.65% 33.00% 33.00% 33.00% 53.45 78.02 99.21 123.54 4.81% 5.81% 6.04% 6.43% 53.45 78.02 99.21 123.54 30.00% 30.00% 30.00% 30.00% 14.81 21.61 27.48 34.22 14.81 21.61 27.48 34.22 4.9971 164.8996 205.328 88.1 0.793694 4.339674 4.162171 4.122007 4.667394 Financial leverage 2 1.8 1.6 1.4 1.2 Mar-10 Mar-11 Mar-12 Mar-13 1 0.8 1110.4 1341.9 1642.1 1920.1 0.6 925.3 1102.8 1350.5 1582.5 0.4 195.5 251.1 303.6 349.5 0.2 45.0 60.3 73.7 69.6 0 69.9 74.3 81.9 90.3 2008 2009 2010 2011 53.4 78.0 99.2 127.1 18.0 18.0 18.0 18.0 14.8 21.6 27.5 35.2 150.4 190.7 230.0 279.9 1.29943 1.316238 1.320307 1.248802 2010 2011 2012 2013
- 23. Expenditure distribution 1800 2008 2009 1600 Raw Material Consumed 502.5 454.5 Miscellaneous Expenses 1400 Power & Fuel Cost 137.15 130.12 1200 EmployeeSelling and Distribution Cost 69.78 70.71 1000 Other Manufacturing Expenses Expenses70.29 70.76 800 General and Administration Expenses 10.98 10.8 General and Administration 600 Selling and Distribution Expenses Expenses 64.6 72.82 400 Miscellaneous Expenses 1.77 48.1 Other Manufacturing 200 Expenses 0 Employee Cost 2008 2009 2010 2011 2012 2013 (E) (E) (E)
- 24. verage 2012 2013
- 25. 2010 2011 (E) 2012 (E) 2013 (E) 541.78 639.368 789.479 923.1374 140.27 161.9838 204.1724 250.2582 77.76 83.9808 90.69926 97.95521 74.04 94.02417 115.0628 134.5398 Administration 8.87 16.10231 19.70533 23.04091 70.97 93.93015 114.9478 134.4053 7.25 13.41859 16.42111 19.20076
- 27. Costing calculation cotton yarn -description FY08 FY09 FY10 FY11 Final Selling price 125.00 131.51 139.52 180 Cotton yarn sold quantity 54686733.6 56632879.65 57243910 54255448.72 Raw cotton needed for it 65103254.28 67420094.82 68147511.9 64589819.9 Raw cotton purchased 77402920.23 86272603.09 83472640 0 Excess available 12299666 18852508 15325128 -64589820 Raw cotton purchase price 56.74 60.64 64.90 75.00 % of selling price 45.39% 46.11% 46.52% 41.67% electricity unity required 4.46 4.25 4.59 4.65 Cost per unit ( Weight average ) 4.21 4.18 4.41 4.75 Electricity per unit cotton yarn 18.80 17.78 20.23 22.09 % of selling price 15.04% 13.52% 14.50% 12.27% Labour 10.70 10.58 11.38 12.85 % of selling price 8.56% 8.05% 8.16% 7.14% other expense 22.63 30.30 23.59 33.27 % of selling price 18.11% 23.04% 16.90% 18.48% interest 4.81 6.19 6.59 9.23 % of selling price 3.85% 4.71% 4.73% 5.13% depreciation 11.21 11.16 10.22 11.36 % of selling price 8.97% 8.49% 7.32% 6.31% profit 0.11 -5.15 2.62 16.20 % of selling price 0.09% -3.92% 1.88% 9.00% Employee Cost 69.78 70.71 77.76 83.9808 Interest 31.36 41.39 45.04 60.31743575 Other Manufacturing Expenses 70.29 70.76 74.04 94.02417179 General and Administration Expenses 10.98 10.8 8.87 16.10231102 Selling and Distribution Expenses 64.6 72.82 70.97 93.93014762 Miscellaneous Expenses 1.77 48.1 7.25 13.41859252 other expense 147.64 202.48 161.13 217.4752229 2008 2009 2010 Revenue From Operations 970.78 1054.61 1179.55 Garments 156.93 160.79 191.20 Yarn 813.85 893.82 988.35
- 28. weight garments 16.17% 15.25% 16.21% 17.00% Weight yarn 83.83% 84.75% 83.79% 83.00% Depreciation 76.91 76.11 69.86 74.2844 Garments 15.59 12.91 11.37 12.628348 Yarn 61.32 63.20 58.49 61.656052
- 29. CY12 CY13 Costing calculation Garment FY08 FY09 FY10 187 190 63199155.54 72882954.53 75237089.93 86765422.06 0 0 -75237090 -86765422 82 84 43.85% 44.21% 4.8 5.1 4.9 5.1 23.52 26.01 12.58% 13.69% 11.91 11.16 6.37% 5.87% 34.95 35.44 18.69% 18.65% 9.67 7.93 5.17% 4.17% 10.75 10.28 5.75% 5.41% 14.19 15.19 7.59% 7.99% 90.699264 97.95520512 73.65906104 69.63934243 115.0628156 134.5398358 19.70532906 23.04090788 114.9477528 134.4052959 16.42110755 19.20075656 266.1370051 311.1867962
- 30. 17.00% 17.00% 83.00% 83.00% 81.882592 90.26215568 0.202675 0.169641 0.162736 13.92004064 15.34456647 0.797325 0.830359 0.837264 67.96255136 74.91758921
- 31. FY11 CY12 CY13
- 32. Material Material Cost per unit Year End Product Name Quantity Value (Unit Curr) 201003.00 Manmade/Synthetic Fibres 917143 9.29 101.26 201003.00 Raw Cotton 83472640 541.71 64.90 201003.00 Raw Wool of all Kinds 87598 1.94 221.99 201003.00 Cloth 67075 1.32 196.15 201003.00 Cotton Yarn 6495827 85.77 132.03 201003.00 Synthetic Yarn 536819 6.28 116.96 200903.00 Manmade/Synthetic Fibres 1424793.59 14.32 100.53 200903.00 Raw Cotton 86272603.1 523.12 60.64 200903.00 Raw Wool of all Kinds 56772 1.87 330.26 200903.00 Cloth 58294 1.22 208.54 200903.00 Cotton Yarn 5331773.63 71.26 133.65 200903.00 Synthetic Yarn 477964 5.26 109.96 200803.00 Manmade/Synthetic Fibres 1110353 10.77 97.03 200803.00 Raw Cotton 77402920.2 439.15 56.74 200803.00 Raw Wool of all Kinds 100376 2.69 267.67 200803.00 Cloth 88318 1.79 202.21 200803.00 Cotton Yarn 5910984.3 76.35 129.16 200803.00 Synthetic Yarn 342962.17 3.34 97.31 200703.00 Manmade/Synthetic Fibres 1090795.3 10.12 92.77 200703.00 Raw Cotton 73464489.2 367.89 50.08 200703.00 Raw Wool of all Kinds 299102 6.22 207.81 200703.00 Cloth 123504 2.45 198.28 200703.00 Cotton Yarn 7135058.67 91.76 128.61 200703.00 Synthetic Yarn 516517.51 5.64 109.14 200603.00 Raw Cotton 20228177.3 122.16 60.39 200603.00 Raw Wool of all Kinds 353598 7.38 208.76 200603.00 Cloth 139168 2.13 152.80 200603.00 Cotton Yarn 5263497 67.32 127.90 200603.00 Synthetic Yarn 1155141 12.37 107.12 200603.00 Manmade/Synthetic Fibres 200503.00 Manmade/Synthetic Fibres 283710.1 2.41 84.84 200503.00 Raw Cotton 17571452.3 105.50 60.04 200503.00 Raw Wool of all Kinds 322447 6.44 199.80 200503.00 Cloth 65857 0.90 136.15 200503.00 Cotton Yarn 6339045.36 98.51 155.40 200503.00 Woollen Yarn 42342 0.54 128.68 200503.00 Synthetic Yarn 1042483 11.33 108.64
- 33. 200603.00 200603.00 200603.00 200503.00 200503.00 200503.00 200503.00 200503.00 200503.00 200503.00 200503.00 200503.00 200503.00 200503.00 Description Revenue Revenue From Operations Garments Yarn Less / Add : Inter Segment Turnover Garments Yarn Gross Revenue Garments Yarn Less : Excise Duty Net Segment Revenue Result Profit / Loss Before Interest & Tax Garments Yarn Segment Assets Garments Yarn Segment liability Garments Yarn Net Assets Capital Employed Garments Yarn
- 34. Capital Expenditures Garments Yarn Depreciation Garments Yarn
- 35. Installed Installed Production Production Year End Product Name Units Capacity Units Qty 201003.00 Cotton/Synthetic Yarn Spindles 346096.00 KG 61855507.00 201003.00 Textile & Hosiery Garments Pcs. 7079154.00 201003.00 Wastes 201003.00 Raw Material 201003.00 Knitted Cloth 201003.00 Stores & Miscellaneous 201003.00 Raw Wool 201003.00 Gas-Mercerised Yarn/Fabric M.T. 2040.00 KG 1681865.00 201003.00 Dyeing & Processing Yarn/Fabric KG 487014.00 201003.00 Cotton/Synthetic Yarn Rotors 720.00 200903.00 Cotton/Synthetic Yarn Spindles 345952.00 KG 62556320.67 200903.00 Textile & Hosiery Garments Pcs. 5583808.00 200903.00 Wastes 200903.00 Knitted Cloth 200903.00 Stores & Miscellaneous 200903.00 Raw Material 200903.00 Gas-Mercerised Yarn/Fabric M.T. 2040.00 KG 1234117.04 200903.00 Dyeing & Processing Yarn/Fabric KG 896087.94 200903.00 Cotton/Synthetic Yarn Rotors 720.00 200803.00 Cotton/Synthetic Yarn Spindles 345952.00 KG 58615101.72 200803.00 Textile & Hosiery Garments Pcs. 5834523.00 200803.00 Wastes 200803.00 Knitted Cloth 200803.00 Stores & Miscellaneous 200803.00 Raw Material 200803.00 Gas-Mercerised Yarn/Fabric M.T. 2040.00 KG 1877735.69 200803.00 Dyeing & Processing Yarn/Fabric KG 986033.70 200803.00 Cotton/Synthetic Yarn Rotors 720.00 200803.00 Cotton Fabrics 200703.00 Cotton/Synthetic Yarn Spindles 305872.00 KG 52856891.75 200703.00 Textile & Hosiery Garments Pcs. 7974397.00 200703.00 Wastes 200703.00 Stores & Miscellaneous 200703.00 Raw Material 200703.00 Knitted Cloth 200703.00 Cotton Fabrics 200703.00 Gas-Mercerised Yarn/Fabric M.T. 2040.00 KG 1760602.59 200703.00 Dyeing & Processing Yarn/Fabric KG 862348.40 200703.00 Cotton/Synthetic Yarn Rotors 720.00 200603.00 Cotton/Synthetic Yarn Spindles 117408.00 KG 12688259.02 200603.00 Textile & Hosiery Garments Pcs. 8225137.00 200603.00 Wastes 200603.00 Raw Material 200603.00 Knitted Cloth
- 36. 200603.00 Stores & Miscellaneous 200603.00 Raw Wool 200603.00 Cotton Fabrics 200603.00 Manmade/Synthetic Fibre 200603.00 Gas-Mercerised Yarn/Fabric M.T. 2040.00 KG 2121314.85 200603.00 Cotton/Synthetic Yarn Rotors 720.00 200503.00 Cotton/Synthetic Yarn Spindles 93408.00 KG 11796563.02 200503.00 Textile & Hosiery Garments Pcs. 6444628.00 200503.00 Wastes 200503.00 Knitted Cloth 200503.00 Raw Material 200503.00 Raw Wool 200503.00 Stores & Miscellaneous 200503.00 Woollen Yarn 200503.00 Cotton Fabrics 200503.00 Gas-Mercerised Yarn/Fabric M.T. 2040.00 KG 1716231.40 200503.00 Cotton/Synthetic Yarn Nahar Spinning Mills Ltd. (Segment Finance) Description 201003 200903 200803 200703 200603 Revenue Revenue From Operations 1179.55 1054.61 970.78 977.83 499.09 Garments 191.20 160.79 156.93 205.26 213.98 Yarn 988.35 893.82 813.85 772.57 285.11 Less / Add : Inter Segment Turnover 69.08 54.23 -54.21 -64.50 -12.53 Garments 4.86 4.43 -5.06 -5.37 Yarn 64.22 49.80 -49.14 -59.13 -12.53 Gross Revenue 1248.63 1108.84 916.58 913.32 486.57 Garments 196.07 165.22 151.87 199.89 213.98 Yarn 1052.57 943.62 764.71 713.43 272.58 Less : Excise Duty Net Segment Revenue 1248.63 1108.84 916.58 913.32 486.57 Result Profit / Loss Before Interest & Tax 118.32 13.75 48.35 111.44 33.28 Garments 22.44 8.19 9.45 24.92 13.34 Yarn 95.88 5.55 38.90 86.52 19.94 Segment Assets 1468.93 1171.70 1383.21 1156.62 605.48 Garments 169.77 163.87 176.80 184.28 185.57 Yarn 1299.16 1007.83 1206.40 972.34 419.91 Segment liability 102.57 58.75 78.72 95.26 22.92 Garments 23.25 14.47 14.48 42.54 8.63 Yarn 79.32 44.29 64.24 52.71 14.29 Net Assets 1366.36 1112.95 1304.49 1061.37 582.56 Capital Employed 582.56 Garments 176.94 Yarn 405.62
- 37. Capital Expenditures 65.73 70.53 146.89 145.05 Garments 7.06 9.52 18.63 16.58 Yarn 58.66 61.01 128.26 128.47 Depreciation 69.86 76.11 76.91 71.97 Garments 11.37 12.91 15.59 17.87 Yarn 58.49 63.20 61.32 54.11
- 38. Sales Per Production Capacity Sales Sales Units Sales Qty % of STO Unit(Unit Amount Utilised % Amount Curr) 75795024.00 0.00 KG 57243910.00 798.69 71.92 139.52 Pcs. 6380760.00 155.63 14.01 243.90 KG 21056715.00 73.54 6.62 34.92 KG 1113669.00 7.74 0.70 69.47 KG 374915.00 7.34 0.66 195.66 KG 4.85 0.44 KG 44635.00 0.77 0.07 173.09 0.00 0.00 KG 56632879.65 744.76 74.43 131.51 Pcs. 4974815.00 130.10 13.00 261.52 KG 19396954.66 69.59 6.95 35.88 KG 341170.47 6.73 0.67 197.25 3.29 0.33 KG 336903.20 2.99 0.30 88.86 0.00 0.00 KG 54686733.60 683.58 74.50 125.00 Pcs. 5441620.00 124.51 13.57 228.82 KG 20601654.63 59.70 6.51 28.98 KG 244984.15 4.70 0.51 191.65 3.70 0.40 KG 207459.84 2.19 0.24 105.79 0.00 0.00 KG 49449411.08 656.40 71.88 132.74 Pcs. 7566792.00 177.28 19.41 234.28 KG 18819971.39 45.44 4.98 24.14 3.30 0.36 KG 186463.00 2.93 0.32 157.32 KG 271094.30 2.62 0.29 96.52 KG 32493.72 0.42 0.05 130.20 0.00 0.00 KG 15573449.21 254.02 52.21 163.11 Pcs. 7733746.00 187.65 38.57 242.63 KG 5228419.01 13.85 2.85 26.48 KG 726801.14 3.63 0.75 49.97 KG 228639.47 1.89 0.39 82.52
- 39. 1.85 0.38 KG 17125.00 0.25 0.05 145.00 KG 8942.16 0.18 0.04 198.43 KG 1308530.00 0.03 0.01 0.21 0.00 0.00 KG 15835642.36 252.44 56.18 159.41 Pcs. 6151844.00 152.53 33.94 247.94 KG 5255764.36 14.16 3.15 26.93 KG 166904.84 2.67 0.60 160.25 KG 375940.82 2.30 0.51 61.31 KG 137732.00 2.14 0.48 155.52 1.77 0.39 KG 8040.00 0.29 0.06 358.55 KG 260.36 0.01 0.00 410.89 0.00 200503 200403 200303 471.00 409.88 482.29 185.50 133.73 200.95 285.50 276.15 281.34 21.63 -20.84 -21.61 21.63 -20.84 -21.61 492.63 389.03 460.68 185.50 133.73 200.95 307.13 255.31 259.73 492.63 389.03 460.68 20.15 24.87 42.66 6.92 4.38 12.67 13.23 20.49 29.99 461.99 490.13 486.37 134.95 118.91 141.57 327.04 371.22 344.80 31.06 42.06 69.98 17.12 25.44 47.85 13.94 16.61 22.13 430.94 448.07 416.39 430.94 448.07 416.39 117.83 93.47 93.71 313.11 354.61 322.68
- 43. 2008 2009 2010 electricity purchased units 213414326 241043542 223785034 rate per unit 4.21 4.18 4.42 own generation thru disel 51176799 10279508 25083427 rate per unit 4.96 7.02 6.39 own generation thru turbine 16733300 33283148 41936530 rate per unit 1.99 3.34 3.15 Weighted average cost 4.21 4.18 4.41
- 44. Financial Ratios FY08 FY09 FY10 FY11 CY12 CY13 EPS (Rs) 3.3 0.0 14.8 21.6 27.5 35.2 DPS (Rs) 1.5 0.5 1.5 1.5 1.5 1.5 Book Value (Rs) 145.67 140.69 153.78 175.1776 203.2149 238.9646 Debt /Equity Ratio 2.58 2.27 2.55 2.71 2.79 2.55 Current Ratio 9.28 9.60 7.42 8.40 9.51 10.76 interest coverage ratio 4.08 2.25 4.34 4.16 4.12 5.02 Revenue Growth Rate % 9.25% 10.89% 20.84% 22.38% 16.93% Price/EPS 33.68 0.00 7.56 5.18 4.07 3.18 Price/Book value 0.77 0.80 0.73 0.64 0.55 0.47 inventory days 161 74 161 122 123 123 creditor days 10 6 6 5 5 5 debtor days 87 86 81 84 84 84