

Recomendados
Mais conteúdo relacionado
Mais procurados
Mais procurados (20)
Semelhante a Xtra online platelet_distribution_curves
Semelhante a Xtra online platelet_distribution_curves (20)
Último
Último (20)
Xtra online platelet_distribution_curves
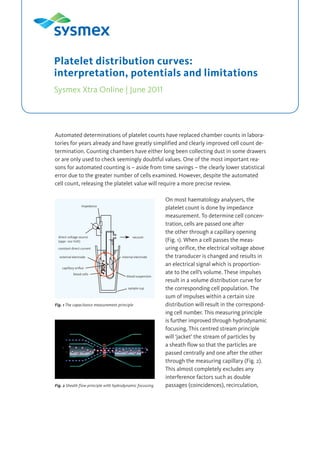
- 1. Automated determinations of platelet counts have replaced chamber counts in labora- tories for years already and have greatly simplified and clearly improved cell count de- termination. Counting chambers have either long been collecting dust in some drawers or are only used to check seemingly doubtful values. One of the most important rea- sons for automated counting is – aside from time savings – the clearly lower statistical error due to the greater number of cells examined. However, despite the automated cell count, releasing the platelet value will require a more precise review. On most haematology analysers, the platelet count is done by impedance measurement. To determine cell concen- tration, cells are passed one after the other through a capillary opening (Fig. 1). When a cell passes the meas- uring orifice, the electrical voltage above the transducer is changed and results in an electrical signal which is proportion- ate to the cell’s volume. These impulses result in a volume distribution curve for the corresponding cell population. The sum of impulses within a certain size distribution will result in the correspond- ing cell number. This measuring principle is further improved through hydrodynamic focusing. This centred stream principle will ‘jacket’ the stream of particles by a sheath flow so that the particles are passed centrally and one after the other through the measuring capillary (Fig. 2). This almost completely excludes any interference factors such as double passages (coincidences), recirculation, Platelet distribution curves: interpretation, potentials and limitations Sysmex Xtra Online | June 2011 impedance vacuumdirect voltage source (appr. 100 Volt) constant direct current external electrode capillary orifice blood cells internal electrode blood suspension sample cup Fig. 1 The capacitance measurement principle Fig. 2 Sheath flow principle with hydrodynamic focussing
- 2. 2Sysmex Xtra Online | June 2011 | 6 pages Platelet distribution curves: interpretation, potentials and limitations etc. and cells will thus be counted with utmost precision. This also applies for counts with extremely low and extremely high PLT concentrations. Despite all the technologies ensuring a safe result, the assessment must take into account that a cell count is primarily a particle determination which takes only the cell volume into account. Red blood cells (RBC) and platelets will be separated from each other due to their cell volume. Aside from numerical platelet values, the analyser also mostly supplies a volume distribution curve which is very impor- tant for determining the platelet morphology and thus provides still further informa- tion on the platelet value. The volume distribution curve (histogram) presents the sum of all impulses of the respective cell population of a specific size (Fig. 3). Platelet and red blood cells populations are separated by means of flexible discrimina- tors. Due to the flexible discriminators PL (lower discriminator) and PU (upper discrimi- nator) (Fig. 3), the populations will be optimally separated from each other. Platelets of a physiological size of 8–12 fL are measured in a range between 2–30 fL with the flexible discriminator PU setting the optimum separation from the red blood cells. They have a size of 80–100 fL and are recorded from 25 fL to 250 fL. Due to this procedure of the automated haematology instrument, technical measuring errors may occur in the analy- sis of certain samples. Platelets having a greater volume than 30 fL, or red blood cells smaller than 25 fL can falsify the measuring result. Also, other very small particles such as cytoplasm fragments may be erroneously counted as platelets. The most frequent interference factors are giant platelets and fragmentocytes. But microerythrocytes and platelet aggregates are also responsible for wrong counting results. In such cases, mere volume separation is not sufficient for unambiguous cell count analysis, and it is necessary to verify the cell count. Because of a cell volume >30 fL, giant platelets are taken for red blood cells. Under the microscope, this is evident by a massive anisocytosis of platelets, with platelets which partly reach the size of a red blood cell. Even larger platelet aggregates can be erroneously counted among the red blood cells, while smaller, looser aggregates are torn apart due to the sheath flow method. Fragmentocytes and microerythrocytes, in turn, are counted among platelets. In all these cases, however, an abnormal volume distribution curve and thus possibly a false measurement can be detected. The volume distribution curve should always begin at the baseline and end at the baseline. If deviations from the baseline are detected, the flexible discriminator will search for the optimum position to separate the two populations from each other. In these cases, the analyser generates an alarm to make Fig. 3 Display of a platelet histogram 10 fL 20 fL 30 fL 40 fL 20% 12 fL PUPL 100%
- 3. 3Sysmex Xtra Online | June 2011 | 6 pages Platelet distribution curves: interpretation, potentials and limitations the user aware that the value should be checked – either by a more precise evaluation of the histogram or by the actual verification of the platelet value by means of another method. If a false analysis of platelets is suspected, the counting value can be reviewed by the method of the conventional counting chamber. However, it must be taken into account that the counting chamber analysis is subject to many manual errors and requires a certain experience and routine. A second possibility is the semiquantitative estimation of platelets by means of the Fonio method. This method allows an orientation evaluation of the cell count and an accuracy check of the automatic count. With a 1,000-fold magnification (eyepiece 10, lens 100), one platelet per display is equivalent to twenty-thousand platelets/μL in circulating blood. In case of a discrepancy between the automated analysis and the estimated value, the chamber count should be used. Immunological marking of platelets with specific, monoclonal antibodies is a good possibility to check the value but unfortunately, it is also very expensive and not always suitable for routines. Another alternative to check the platelet value is a staining of platelets by means of an RNA fluorescence dye. The platelet RNA will be stained and – based on the fluo- rescence activity and the volume of cells – the exact platelet value, including giant platelets, will be determined by automation. Most Sysmex instruments integrate RNA staining of platelets as a method and, in case of interferences, switches over to the fluo- rescence platelet value – by means of an automatic algorithm. Parameters facilitating platelet histogram interpretation: Aside from an evaluation of the histogram, there are also different additional parameters such as P-LCR, MPV, PDW and PCT, providing a multitude of information on platelet morphology.
- 4. 4Sysmex Xtra Online | June 2011 | 6 pages Platelet distribution curves: interpretation, potentials and limitations P-LCR (platelet large cell ratio) The P-LCR indicates the percentage of large platelets with a volume > 12 fL. Aside from the two flexible discrimina- tors which delimit the volume distribu- tion curve, there is additionally a fixed discriminator at 12 fL (Fig. 4). The share of platelets >12 fL in the total platelet number is presented in %. The standard range is 15–35%. An increase of the pa- rameter may be an indication for platelet aggregates, microerythrocytes and giant platelets. PDW (platelet distribution width) The PDW indicates the platelet distri- bution width measured at 20% relative height of the total height of the curve (Fig. 5). An increased PDW is an indica- tion for the anisocytosis of platelets. Standard PDW ranges from 9 to 14 fL. MPV (mean platelet volume) This parameter provides a statement on the MPV between the lower discrimi- nator PL and the upper discriminator PU. The standard range is between 8–12 fL. Pct (platelet crit) The platelet crit is equivalent to the sum of platelet impulses which are individually detected by means of the impedance measurement principle and thus it is the equivalent to the haematocrit of the red blood cells. If there is an abnormal height of the volume distribution curve at the lower or upper discriminator so that one or several of the indicated parameters can no longer be determined, the parameters will be marked by ‘- - -’; the platelet value will be marked and the analyser generates an alarm. In this case, the histogram curve must be checked for correctness of the result. For a more precise evaluation of a platelet histogram, the curves can be divided into three different categories. We call these curves A, B and C curves. Fig. 4 Display of the P-LCR Fig. 5 Display of the PDW 10 fL 20 fL 30 fL 40 fL 20% 12 fL PUPL 100% 10 fL 20 fL 30 fL 40 fL 20% 12 fL PUPL 100% P-LCR Referenzbereich 9–14 fL PDW Calculation MPV (fL) = Pct (%) PLT (x 103 /μL)
- 5. 5Sysmex Xtra Online | June 2011 | 6 pages Platelet distribution curves: interpretation, potentials and limitations ‘A curve’: The platelet histogram starts at the base- line but does not end there since there is an interference with microerythro- cytes. Due to the extremely small eryth- rocytes, there will be no clear volume separation between the two cell popula- tions. Since, however, the overlapping of both cell populations is approximately the same on both sides of the discrimina- tor, this platelet value can be used if the MCV shows a standard value. In this case, a chamber count would be statistically much more imprecise. ‘B curve’: Here again, the platelet histogram does not end on the baseline. Deviation from the baseline is major and there is no separation between the two popula- tions. There is a total overlapping of both populations. A possible cause might here be fragmentocytes. Fragmentocytes ‘slip’ into the platelet population and do not allow any clear separation between red blood cells and platelets. In any event, this platelet value is questionable and requires verification. ‘C curve’: This case also requires verification of the platelet value. The flexible upper dis- criminator always looks for the optimum place to separate the populations. How- ever, due to giant platelets or micro-clots, no clear separation can be found; instead, there is major overlapping. The platelet value should be verified, for example, by means of the Fonio method. Fig. 6 Display of the ‘A curve’ 10 fL 20 fL 30 fL 40 fL 20% PUPL 100% Fig. 7 Display of the ‘B curve’ 10 fL 20 fL 30 fL 40 fL 20% PUPL 100% Fig. 8 Display of the ‘C curve’ 10 fL 20 fL 30 fL 40 fL 20% PUPL 100%
- 6. 6Sysmex Xtra Online | June 2011 | 6 pages Platelet distribution curves: interpretation, potentials and limitations Sysmex Europe GmbH Bornbarch 1, 22848 Norderstedt, Germany, Phone +49 40 52726-0 · Fax +49 40 52726-100 · info@sysmex-europe.com · www.sysmex-europe.com Please find your local Sysmex representative address under www.sysmex-europe.com Abnormal platelet distribution on the lower discriminator PL is rather rare. This will be triggered by particles with a volume < 2 fL. Cause for it could be an increased blank value, bacteria, fungi or cell debris. In this case, the instrument’s blank value should be checked and, if necessary, the reagent should be replaced. Potential platelet interference factors in impedance measurements Giant platelets PLT ▼ n Evaluate histogram n If necessary, check by Fonio method or chamber count n Optical (Fluorescence platelets), if available (e.g. XT-4000i, XE-5000) Fragmentocytes PLT ▲ n Fragmentocytes and platelets have no clear volume separation n Evaluate histograms n If necessary, check by Fonio method or chamber count n Optical (Fluorescence platelets), if available (e.g. XT-4000i, XE-5000) Microerythrocytes PLT ▲ n Microerythrocytes and platelets have no clear volume separation n Evaluate histograms n If necessary, check by Fonio method or chamber count n Optical (Fluorescence platelets), if available (e.g. XT-4000i, XE-5000) Platelet aggregates PLT ▼ n Evaluate histograms n With implausible thrombocytopenia, clarify an EDTA-induced n Pseudothrombocytopenia through a second sample in citrate Table 1