SlideShare uma empresa Scribd logo
1 de 9
SALES SCHEDULE                         2008       2009       2010
Rate of Growth for Polysense                         0.20       0.20
Price                                  187.50      187.50     187.50
Rise in Cost (125 $)                                 0.10       0.10
Sensor sale Per Polysense                  12          11         10
Rise in Cost (10 $)                                  0.10       0.10


SALES SCHEDULE                         2008       2009       2010
Projected Sales (Units)                   1000       1200       1440
PolySense Selling Price                 187.50     187.50     187.50
PolySense Cost                          125.00     137.50     151.25
Polysense Revenues                     187500     225000     270000
COGS                                   125000      165000    217800
Operating Margin                        62500      60000      52200

Catridge                                12000      26400      40040
Sensor Cartridge Selling Price               9       7.50          7
Sensor Cartridge Cost Price               3.00       3.30       3.63
Sensor Cartridge Revenues              108000     198000     280280
COGS                                    36000      87120     145345
Operating Margin                        72000     110880     134935

Total Operating Margin                 134500     170880     187135

Investment in Assets (% of GP)            8%         8%         8%
New Assets                              5322      13670      14971
Assets                                  1250      14608      25927
Depreciation                             313       3652       6482
Net Assets                               938      10956      19445


PROFIT AND LOSS STATEMENT (in USD)     2008       2009       2010
REVENUES
Sale of Polysense + Sensors            295,500    423,000    550,280
EXPENSES
Cost of Goods Sold                     161,000    252,120    363,145
Gross Profit                           134,500    170,880    187,135
Sales and General Administration Exp    32,200     50,424     72,629
R&D Expenses                            29,550     42,300     55,028
Depreciation                               313      3652        6482
Other Expenses                           5910       8460       11006
Operating Profit                        66,528     66,044     41,990
Other Income                                  0          0          0
Profit before Interest and Tax          66,528     66,044     41,990
Interest                                     0          0          0
Profit Before Tax                       66,528     66,044     41,990
Provision for Tax                      23285      23115      14697
Profit After Tax                      43,243     42,929     27,294
Provision for Dividend                   313        313        313
Retained Earnings                     42,930     42,616     26,981


BALANCE SHEET (in USD)               2008       2009       2010
SOURCES OF FUND
Shareholder's Fund
Share Capital - Promoters              2,500      2,500      2,500
Share Capital - VC                    1,071      1,071      1,071
Share Premium                         26,929     26,929     26,929
Reserves and Surplus                  42,930     42,616     26,981
Net Worth                             72,359     72,045     56,410
Loans Funds
TOTAL LIABILITIES                    72,359     72,045     56,410
APPLICATION OF FUNDS
Fixed Assets
Gross block                            1,250     14,608     25,927
Accumulated Depreciation                313       3652       6482
Net Fixed assets                        938      10956      19445
Investments                                 0          0          0
Current Assets
Sundry Debtors                        59,100     84,600    110,056
Cash in Hand & Bank                   44521      26913        -462
Current Liabilities
Sundry Creditors                      32,200     50,424     72,629
Net Current Assets                    71,421     61,089     36,965
TOTAL ASSETS                         72,359     72,045     56,410


Ratio Analysis                      2008        2009    2010
ROE                                 59.33%      59.15% 47.83%
Sales/ Book Value                         4           7     15
EPS assumin 1 share of 1$            12.02       11.93    7.55
Operating Margin                       46%         40%     34%
Overhead Expenses to Opeating Exp      46%         56%     72%
Gross Profit/ Net Profit               32%         25%     14%
Return on Net Assets                   60%         70%     73%
Current Ratio                          3.22        2.21   1.51
Cash to Net Assets                     62%         44%     -1%

Break Even Analysis                  2008    2009    2010
Sales                               295,500 423,000 550,280
Variable cost                       161,000 252,120 363,145
Semi- Variable Cost                  38,110 58,884 83,635
Contribution                         96,390 111,996 103,500
Contribution Per Unit                    96      93      72
Fixed Cost                           29,863 45,952 61,510
Break Even (Units)   310   492   856
Assumptions                                                     2008        2009        2010
Growth                                                                       20%         20%
Selling Price would not increase                                187.5       187.5       187.5
Rise in COGS (%)                                                 0%          10%         10%
Sensor Sale per Machine would decrease in years                  12           11          10
Rise in COGS of Sensor (%)                                       0%          10%         10%


Sales Projection on Realistic basis                               1000         1200        1440


Selling Price of Cartridge (it would kep reducing)                   9          7.5          7
COGS of Sensor would increase                                       0%         10%         10%


We assume that investment in miscelleaneus assets on % of GP           8%          8%          8%


Depreciation WDV                                                   25%         25%         25%


Valuation Pre Investment                                        2008        2009        2010
PAT                                                              43,243   42,929   27,294
Depreciation                                                        313      313      313
Cash Flow                                                        43,555   43,241   27,606
Year                                                                  1         2       3
Discounting Rate                                                   0.12     0.12     0.12
Discounting Factor                                                 0.89       0.8    0.71
PV of Cash Flows                                               38888.73 34471.55 19649.63

Other expenses are taken as percentage of sale @2%               2%
Sum Of Present Values                                          93009.91
Purchase                                                        30%
Value - Equity                                                  Err:502
Investment Strategy                                                             2008          2009             2010
Equity                                                                         28000
Debt Commitment (with conditions) @10 %                                        50000         50000            75000
Rate of Interest                                                                10%        PLR+2.25%         PLR+2.25%

     We would embed a real option into the debt converting debt into equity within
     a period of two years from the date of debt given but only till Dec 2011 as last
                 Valuation of company for converting debt into equity would be
Years                                                            2008       2009                              2010
Increment for Valuation in future years                          40%         60%                              80%
 Valuation of Company for these years                           130667     149333                            168000
Example
Date of loan given                                                             Dec-08       Nov-09           Mar-10
Debt given                                                                     50000        50000            50000
Rate of Interest                                                                10%        PLR+2.25%         PLR+2.25%
Exercising Right Valid Till                                                   Dec-10        Nov-11           Dec-11

Debt conversion in the following years                      50000      40000      40000
Equity                                                       38%        27%         24%
       UPPER Cap on VC shareholding would not be more than 60% at any point of time

Investment Plan                                                                 2008          2009             2010
Equity                                                                           28000
Debt Commitment                                                                  50000          50000           75000
                                         Key Benchmarks to achieve
Sales of minimum
Machines                                                                            800           960            1100
Sensors                                                                            6400         14080           22880
Minimum Level of ROE                                                                30%           30%             30%

                                         R&D expenses
       Both the Products are to be evalued and stage of development would be considered
                       Rating of UNICEF would be takeninto consideration
                                         Equity Dilution
              Any stake dilution would not be permisible without the consent of VC
                            The VC would have "First right of Refusal"
        THe Promoter cannot engage in any other business with the same kind of research

           Any dealings with Bhat Bio- Tech India Pvt Ltd would have to be cleared from the director of VC
Cost of Manufacturing

Annual Increase in Cost of Goods Sold*                     10%
Sales & General Expenses as proportion of Cost of Goods
Sold                                                       20%
Sundry Debtors as % of Sales                               20%
Sundry Creditors as % of Cost of Goods sold                20%
Initial Assets (Testing Eqpt and Electrode Mfg Eqpt)      50000
Annual Rate of Depreciation                                25%
Reducing Balance Method used for Depreciation
Tax Rate (Corporate tax)                                   35%
R& D Investment as % of Sales                              10%
Interest Rates
Long term Debt                                             10%


Provision for dividend (Including CDT)                    12.50%
Sales and financial projections for Polysense company

Mais conteúdo relacionado

Mais procurados

NTPC Financial Modelling
NTPC Financial ModellingNTPC Financial Modelling
NTPC Financial ModellingSHAHID HASSAN
 
alltel 1Q06_Supplement
alltel  1Q06_Supplementalltel  1Q06_Supplement
alltel 1Q06_Supplementfinance27
 
Stock snapshot
Stock snapshotStock snapshot
Stock snapshotmhhhhhh
 
credit suisse Annual Report Part 3 Financial report continued Income statement
 credit suisse Annual Report Part 3 Financial report continued Income statement  credit suisse Annual Report Part 3 Financial report continued Income statement
credit suisse Annual Report Part 3 Financial report continued Income statement QuarterlyEarningsReports2
 
Financial Statement Analysis
Financial Statement AnalysisFinancial Statement Analysis
Financial Statement Analysismmclean487
 
MBL Infrastructure IPO
MBL Infrastructure IPOMBL Infrastructure IPO
MBL Infrastructure IPOKunal
 
alltel 4q05supplement
alltel  4q05supplementalltel  4q05supplement
alltel 4q05supplementfinance27
 
alltel 3Q05_Supplemental
alltel  3Q05_Supplementalalltel  3Q05_Supplemental
alltel 3Q05_Supplementalfinance27
 
alltel 3Q05_Highlights
alltel  3Q05_Highlightsalltel  3Q05_Highlights
alltel 3Q05_Highlightsfinance27
 
alltel 2Q06_Supplement
alltel  2Q06_Supplementalltel  2Q06_Supplement
alltel 2Q06_Supplementfinance27
 
Jsw Ipo
Jsw IpoJsw Ipo
Jsw IpoKunal
 
Competitor analysis
Competitor analysisCompetitor analysis
Competitor analysisTanvi Sodhi
 
Saral Gyan 15% @ 90 Days - Nov'12
Saral Gyan 15% @ 90 Days - Nov'12Saral Gyan 15% @ 90 Days - Nov'12
Saral Gyan 15% @ 90 Days - Nov'12SaralGyanTeam
 

Mais procurados (20)

Fm presentstion
Fm presentstionFm presentstion
Fm presentstion
 
NTPC Financial Modelling
NTPC Financial ModellingNTPC Financial Modelling
NTPC Financial Modelling
 
alltel 1Q06_Supplement
alltel  1Q06_Supplementalltel  1Q06_Supplement
alltel 1Q06_Supplement
 
Stock snapshot
Stock snapshotStock snapshot
Stock snapshot
 
credit suisse Annual Report Part 3 Financial report continued Income statement
 credit suisse Annual Report Part 3 Financial report continued Income statement  credit suisse Annual Report Part 3 Financial report continued Income statement
credit suisse Annual Report Part 3 Financial report continued Income statement
 
Bank of rajasthan
Bank of rajasthanBank of rajasthan
Bank of rajasthan
 
Financial Statement Analysis
Financial Statement AnalysisFinancial Statement Analysis
Financial Statement Analysis
 
MBL Infrastructure IPO
MBL Infrastructure IPOMBL Infrastructure IPO
MBL Infrastructure IPO
 
alltel 4q05supplement
alltel  4q05supplementalltel  4q05supplement
alltel 4q05supplement
 
alltel 3Q05_Supplemental
alltel  3Q05_Supplementalalltel  3Q05_Supplemental
alltel 3Q05_Supplemental
 
alltel 3Q05_Highlights
alltel  3Q05_Highlightsalltel  3Q05_Highlights
alltel 3Q05_Highlights
 
alltel 2Q06_Supplement
alltel  2Q06_Supplementalltel  2Q06_Supplement
alltel 2Q06_Supplement
 
Jsw Ipo
Jsw IpoJsw Ipo
Jsw Ipo
 
VW Financial Services AG Annual Report 2011
VW Financial Services AG Annual Report 2011VW Financial Services AG Annual Report 2011
VW Financial Services AG Annual Report 2011
 
Competitor analysis
Competitor analysisCompetitor analysis
Competitor analysis
 
Eden Grove Hotel Projections
Eden Grove Hotel ProjectionsEden Grove Hotel Projections
Eden Grove Hotel Projections
 
Rahul Mehrotra Presentation on Reliance Financial Ratio
Rahul Mehrotra Presentation on Reliance Financial RatioRahul Mehrotra Presentation on Reliance Financial Ratio
Rahul Mehrotra Presentation on Reliance Financial Ratio
 
fr06_is
fr06_isfr06_is
fr06_is
 
Saral Gyan 15% @ 90 Days - Nov'12
Saral Gyan 15% @ 90 Days - Nov'12Saral Gyan 15% @ 90 Days - Nov'12
Saral Gyan 15% @ 90 Days - Nov'12
 
Harpreet
HarpreetHarpreet
Harpreet
 

Destaque

actividades de induccion
actividades de induccionactividades de induccion
actividades de induccion3206155051
 
Alitalia Xl China Eastern
Alitalia Xl China EasternAlitalia Xl China Eastern
Alitalia Xl China Easterndoshihardik
 
El sistema de justicias
El sistema de justiciasEl sistema de justicias
El sistema de justiciasmafer03_v
 
11.Francisco Gallo Presenta Fesabid
11.Francisco Gallo Presenta Fesabid11.Francisco Gallo Presenta Fesabid
11.Francisco Gallo Presenta FesabidFESABID
 
Triangulos semejantes
Triangulos semejantesTriangulos semejantes
Triangulos semejantesyisethb12
 
Hr permission letter
Hr permission letterHr permission letter
Hr permission lettersweetgurl315
 
Cashflow Analysis For Mobile Spas
Cashflow Analysis For Mobile SpasCashflow Analysis For Mobile Spas
Cashflow Analysis For Mobile Spasdoshihardik
 
Rudyard Kipling
Rudyard KiplingRudyard Kipling
Rudyard Kiplingalenashik
 
Palestra Os Desafios do Suporte Técnico no Mundo Atual
Palestra Os Desafios do Suporte Técnico no Mundo AtualPalestra Os Desafios do Suporte Técnico no Mundo Atual
Palestra Os Desafios do Suporte Técnico no Mundo AtualRoberto Cohen
 
Ensayo poder legislativo
Ensayo poder legislativoEnsayo poder legislativo
Ensayo poder legislativomafer03_v
 
Norma técnica del servicio de seguridad y salud en el trabajo nt 032016
Norma técnica del servicio de seguridad y salud en el trabajo nt 032016Norma técnica del servicio de seguridad y salud en el trabajo nt 032016
Norma técnica del servicio de seguridad y salud en el trabajo nt 032016Gustavo Specht
 

Destaque (20)

actividades de induccion
actividades de induccionactividades de induccion
actividades de induccion
 
Alitalia Xl China Eastern
Alitalia Xl China EasternAlitalia Xl China Eastern
Alitalia Xl China Eastern
 
El sistema de justicias
El sistema de justiciasEl sistema de justicias
El sistema de justicias
 
Apresentacao1
Apresentacao1Apresentacao1
Apresentacao1
 
Componentes de hardware y software
Componentes de hardware y softwareComponentes de hardware y software
Componentes de hardware y software
 
11.Francisco Gallo Presenta Fesabid
11.Francisco Gallo Presenta Fesabid11.Francisco Gallo Presenta Fesabid
11.Francisco Gallo Presenta Fesabid
 
Triangulos semejantes
Triangulos semejantesTriangulos semejantes
Triangulos semejantes
 
Hr permission letter
Hr permission letterHr permission letter
Hr permission letter
 
Dium dijst13port 1
Dium dijst13port 1Dium dijst13port 1
Dium dijst13port 1
 
Leyendo con familia
Leyendo con familiaLeyendo con familia
Leyendo con familia
 
Autoformas 1 hm
Autoformas 1 hmAutoformas 1 hm
Autoformas 1 hm
 
Banking Sector
Banking SectorBanking Sector
Banking Sector
 
Memoria Vida Buena
Memoria Vida Buena Memoria Vida Buena
Memoria Vida Buena
 
Cashflow Analysis For Mobile Spas
Cashflow Analysis For Mobile SpasCashflow Analysis For Mobile Spas
Cashflow Analysis For Mobile Spas
 
C.V
C.VC.V
C.V
 
Rudyard Kipling
Rudyard KiplingRudyard Kipling
Rudyard Kipling
 
Palestra Os Desafios do Suporte Técnico no Mundo Atual
Palestra Os Desafios do Suporte Técnico no Mundo AtualPalestra Os Desafios do Suporte Técnico no Mundo Atual
Palestra Os Desafios do Suporte Técnico no Mundo Atual
 
Ensayo poder legislativo
Ensayo poder legislativoEnsayo poder legislativo
Ensayo poder legislativo
 
Norma técnica del servicio de seguridad y salud en el trabajo nt 032016
Norma técnica del servicio de seguridad y salud en el trabajo nt 032016Norma técnica del servicio de seguridad y salud en el trabajo nt 032016
Norma técnica del servicio de seguridad y salud en el trabajo nt 032016
 
Filhos do divórcio
Filhos do divórcioFilhos do divórcio
Filhos do divórcio
 

Semelhante a Sales and financial projections for Polysense company

Abch group results booklet 2010
Abch group results booklet 2010Abch group results booklet 2010
Abch group results booklet 2010wgjlubbe
 
Silver river manufacturing company
Silver river manufacturing companySilver river manufacturing company
Silver river manufacturing companyPawan Kawan
 
Rickmers Maritime Q4 2012 results presentation
Rickmers Maritime Q4 2012 results presentationRickmers Maritime Q4 2012 results presentation
Rickmers Maritime Q4 2012 results presentationTradeWindsnews
 
Nordnet Q2 2011 report
Nordnet Q2 2011 reportNordnet Q2 2011 report
Nordnet Q2 2011 reportNordnet
 
Westheimer mobil station
Westheimer mobil stationWestheimer mobil station
Westheimer mobil stationrobertday
 
Westheimer mobil station
Westheimer mobil stationWestheimer mobil station
Westheimer mobil stationnateshow
 
Pricing for profit
Pricing for profitPricing for profit
Pricing for profitAzure Group
 
Comair - Interim Report Dec 2009 Final
Comair - Interim Report Dec 2009 FinalComair - Interim Report Dec 2009 Final
Comair - Interim Report Dec 2009 FinalBlogatize.net
 
Senario Analysis for Risk management in Corporate Finance
Senario Analysis for Risk management in Corporate FinanceSenario Analysis for Risk management in Corporate Finance
Senario Analysis for Risk management in Corporate FinanceIman Najafi
 
Financial Model Manufacturing And Retail Businesses
Financial Model Manufacturing And Retail BusinessesFinancial Model Manufacturing And Retail Businesses
Financial Model Manufacturing And Retail BusinessesElisha A. A. (Capital) Ltd
 
InKnowVision June 2012 HNW Technical Webinar 2 - Valuation Planning
InKnowVision June 2012 HNW Technical Webinar 2 - Valuation PlanningInKnowVision June 2012 HNW Technical Webinar 2 - Valuation Planning
InKnowVision June 2012 HNW Technical Webinar 2 - Valuation PlanningInKnowVision
 
Zappos Financials
Zappos FinancialsZappos Financials
Zappos FinancialsJohn Mecke
 
Golar LNG Q3 2012 results presentation
Golar LNG Q3 2012 results presentationGolar LNG Q3 2012 results presentation
Golar LNG Q3 2012 results presentationTradeWindsnews
 
Nordnet Q1 2011 report
Nordnet Q1 2011 reportNordnet Q1 2011 report
Nordnet Q1 2011 reportNordnet
 
Gsk financial analysis
Gsk financial analysisGsk financial analysis
Gsk financial analysisMubashir Ahmed
 
Harley Davidson Financials, HOG Factbook, 2010 HD, Sales Growth Motorcycle Sales
Harley Davidson Financials, HOG Factbook, 2010 HD, Sales Growth Motorcycle SalesHarley Davidson Financials, HOG Factbook, 2010 HD, Sales Growth Motorcycle Sales
Harley Davidson Financials, HOG Factbook, 2010 HD, Sales Growth Motorcycle SalesBillStankiewicz
 

Semelhante a Sales and financial projections for Polysense company (20)

Ppt ideko spx_team
Ppt ideko spx_teamPpt ideko spx_team
Ppt ideko spx_team
 
Abch group results booklet 2010
Abch group results booklet 2010Abch group results booklet 2010
Abch group results booklet 2010
 
Silver river manufacturing company
Silver river manufacturing companySilver river manufacturing company
Silver river manufacturing company
 
fr05_is
fr05_isfr05_is
fr05_is
 
Rickmers Maritime Q4 2012 results presentation
Rickmers Maritime Q4 2012 results presentationRickmers Maritime Q4 2012 results presentation
Rickmers Maritime Q4 2012 results presentation
 
Nordnet Q2 2011 report
Nordnet Q2 2011 reportNordnet Q2 2011 report
Nordnet Q2 2011 report
 
Westheimer mobil station
Westheimer mobil stationWestheimer mobil station
Westheimer mobil station
 
Westheimer mobil station
Westheimer mobil stationWestheimer mobil station
Westheimer mobil station
 
Brand pipe company
Brand pipe companyBrand pipe company
Brand pipe company
 
Pricing for profit
Pricing for profitPricing for profit
Pricing for profit
 
Comair - Interim Report Dec 2009 Final
Comair - Interim Report Dec 2009 FinalComair - Interim Report Dec 2009 Final
Comair - Interim Report Dec 2009 Final
 
Senario Analysis for Risk management in Corporate Finance
Senario Analysis for Risk management in Corporate FinanceSenario Analysis for Risk management in Corporate Finance
Senario Analysis for Risk management in Corporate Finance
 
Financial Model Manufacturing And Retail Businesses
Financial Model Manufacturing And Retail BusinessesFinancial Model Manufacturing And Retail Businesses
Financial Model Manufacturing And Retail Businesses
 
InKnowVision June 2012 HNW Technical Webinar 2 - Valuation Planning
InKnowVision June 2012 HNW Technical Webinar 2 - Valuation PlanningInKnowVision June 2012 HNW Technical Webinar 2 - Valuation Planning
InKnowVision June 2012 HNW Technical Webinar 2 - Valuation Planning
 
Zappos Financials
Zappos FinancialsZappos Financials
Zappos Financials
 
Hansson
HanssonHansson
Hansson
 
Golar LNG Q3 2012 results presentation
Golar LNG Q3 2012 results presentationGolar LNG Q3 2012 results presentation
Golar LNG Q3 2012 results presentation
 
Nordnet Q1 2011 report
Nordnet Q1 2011 reportNordnet Q1 2011 report
Nordnet Q1 2011 report
 
Gsk financial analysis
Gsk financial analysisGsk financial analysis
Gsk financial analysis
 
Harley Davidson Financials, HOG Factbook, 2010 HD, Sales Growth Motorcycle Sales
Harley Davidson Financials, HOG Factbook, 2010 HD, Sales Growth Motorcycle SalesHarley Davidson Financials, HOG Factbook, 2010 HD, Sales Growth Motorcycle Sales
Harley Davidson Financials, HOG Factbook, 2010 HD, Sales Growth Motorcycle Sales
 

Mais de doshihardik

Interactive Marketing
Interactive MarketingInteractive Marketing
Interactive Marketingdoshihardik
 
Exporting Computers from Taiwan to Brazil
Exporting Computers from Taiwan to BrazilExporting Computers from Taiwan to Brazil
Exporting Computers from Taiwan to Brazildoshihardik
 
Project Finance analysis of Mobile Spa Project
Project Finance analysis of Mobile Spa ProjectProject Finance analysis of Mobile Spa Project
Project Finance analysis of Mobile Spa Projectdoshihardik
 
Reverse Mortgages
Reverse MortgagesReverse Mortgages
Reverse Mortgagesdoshihardik
 
Term Sheet Venture Capital Competition Avenues 08
Term Sheet Venture Capital Competition Avenues 08Term Sheet Venture Capital Competition Avenues 08
Term Sheet Venture Capital Competition Avenues 08doshihardik
 
Acquisition of Pratappur Sugar by Bajaj Hindustan
Acquisition of Pratappur Sugar by Bajaj HindustanAcquisition of Pratappur Sugar by Bajaj Hindustan
Acquisition of Pratappur Sugar by Bajaj Hindustandoshihardik
 
Investment report on Keppel Land Ltd Singapore
Investment report on Keppel Land Ltd SingaporeInvestment report on Keppel Land Ltd Singapore
Investment report on Keppel Land Ltd Singaporedoshihardik
 
Industry Immersion Project(Internship Project)
Industry Immersion Project(Internship Project)Industry Immersion Project(Internship Project)
Industry Immersion Project(Internship Project)doshihardik
 
Valuation of ITC
Valuation of ITCValuation of ITC
Valuation of ITCdoshihardik
 
Analysis of Emaar MGF IPO Failure and alternative means of raising money
Analysis of Emaar MGF IPO Failure and alternative means of raising moneyAnalysis of Emaar MGF IPO Failure and alternative means of raising money
Analysis of Emaar MGF IPO Failure and alternative means of raising moneydoshihardik
 
Private Equity India Art Fund
Private Equity India Art FundPrivate Equity India Art Fund
Private Equity India Art Funddoshihardik
 
The Ultra Tech Saga
The Ultra Tech SagaThe Ultra Tech Saga
The Ultra Tech Sagadoshihardik
 
Cognizant business plan competition Phase 1
Cognizant business plan competition Phase 1Cognizant business plan competition Phase 1
Cognizant business plan competition Phase 1doshihardik
 
Venture Capitalist competition Analysis Team Lollapalooza
Venture Capitalist competition Analysis Team LollapaloozaVenture Capitalist competition Analysis Team Lollapalooza
Venture Capitalist competition Analysis Team Lollapaloozadoshihardik
 
Venture Capitalist Competition
Venture Capitalist CompetitionVenture Capitalist Competition
Venture Capitalist Competitiondoshihardik
 

Mais de doshihardik (17)

Hardik Doshi CV
Hardik Doshi CVHardik Doshi CV
Hardik Doshi CV
 
Interactive Marketing
Interactive MarketingInteractive Marketing
Interactive Marketing
 
Exporting Computers from Taiwan to Brazil
Exporting Computers from Taiwan to BrazilExporting Computers from Taiwan to Brazil
Exporting Computers from Taiwan to Brazil
 
Project Finance analysis of Mobile Spa Project
Project Finance analysis of Mobile Spa ProjectProject Finance analysis of Mobile Spa Project
Project Finance analysis of Mobile Spa Project
 
Reverse Mortgages
Reverse MortgagesReverse Mortgages
Reverse Mortgages
 
Term Sheet Venture Capital Competition Avenues 08
Term Sheet Venture Capital Competition Avenues 08Term Sheet Venture Capital Competition Avenues 08
Term Sheet Venture Capital Competition Avenues 08
 
Acquisition of Pratappur Sugar by Bajaj Hindustan
Acquisition of Pratappur Sugar by Bajaj HindustanAcquisition of Pratappur Sugar by Bajaj Hindustan
Acquisition of Pratappur Sugar by Bajaj Hindustan
 
Investment report on Keppel Land Ltd Singapore
Investment report on Keppel Land Ltd SingaporeInvestment report on Keppel Land Ltd Singapore
Investment report on Keppel Land Ltd Singapore
 
Industry Immersion Project(Internship Project)
Industry Immersion Project(Internship Project)Industry Immersion Project(Internship Project)
Industry Immersion Project(Internship Project)
 
Valuation of ITC
Valuation of ITCValuation of ITC
Valuation of ITC
 
Analysis of Emaar MGF IPO Failure and alternative means of raising money
Analysis of Emaar MGF IPO Failure and alternative means of raising moneyAnalysis of Emaar MGF IPO Failure and alternative means of raising money
Analysis of Emaar MGF IPO Failure and alternative means of raising money
 
Private Equity India Art Fund
Private Equity India Art FundPrivate Equity India Art Fund
Private Equity India Art Fund
 
The Ultra Tech Saga
The Ultra Tech SagaThe Ultra Tech Saga
The Ultra Tech Saga
 
Cognizant business plan competition Phase 1
Cognizant business plan competition Phase 1Cognizant business plan competition Phase 1
Cognizant business plan competition Phase 1
 
Venture Capitalist competition Analysis Team Lollapalooza
Venture Capitalist competition Analysis Team LollapaloozaVenture Capitalist competition Analysis Team Lollapalooza
Venture Capitalist competition Analysis Team Lollapalooza
 
Venture Capitalist Competition
Venture Capitalist CompetitionVenture Capitalist Competition
Venture Capitalist Competition
 
Webvan Final
Webvan FinalWebvan Final
Webvan Final
 

Sales and financial projections for Polysense company

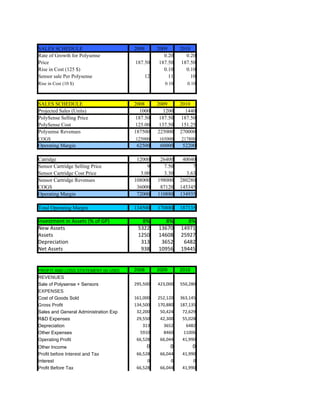
  • 1. SALES SCHEDULE 2008 2009 2010 Rate of Growth for Polysense 0.20 0.20 Price 187.50 187.50 187.50 Rise in Cost (125 $) 0.10 0.10 Sensor sale Per Polysense 12 11 10 Rise in Cost (10 $) 0.10 0.10 SALES SCHEDULE 2008 2009 2010 Projected Sales (Units) 1000 1200 1440 PolySense Selling Price 187.50 187.50 187.50 PolySense Cost 125.00 137.50 151.25 Polysense Revenues 187500 225000 270000 COGS 125000 165000 217800 Operating Margin 62500 60000 52200 Catridge 12000 26400 40040 Sensor Cartridge Selling Price 9 7.50 7 Sensor Cartridge Cost Price 3.00 3.30 3.63 Sensor Cartridge Revenues 108000 198000 280280 COGS 36000 87120 145345 Operating Margin 72000 110880 134935 Total Operating Margin 134500 170880 187135 Investment in Assets (% of GP) 8% 8% 8% New Assets 5322 13670 14971 Assets 1250 14608 25927 Depreciation 313 3652 6482 Net Assets 938 10956 19445 PROFIT AND LOSS STATEMENT (in USD) 2008 2009 2010 REVENUES Sale of Polysense + Sensors 295,500 423,000 550,280 EXPENSES Cost of Goods Sold 161,000 252,120 363,145 Gross Profit 134,500 170,880 187,135 Sales and General Administration Exp 32,200 50,424 72,629 R&D Expenses 29,550 42,300 55,028 Depreciation 313 3652 6482 Other Expenses 5910 8460 11006 Operating Profit 66,528 66,044 41,990 Other Income 0 0 0 Profit before Interest and Tax 66,528 66,044 41,990 Interest 0 0 0 Profit Before Tax 66,528 66,044 41,990
  • 2. Provision for Tax 23285 23115 14697 Profit After Tax 43,243 42,929 27,294 Provision for Dividend 313 313 313 Retained Earnings 42,930 42,616 26,981 BALANCE SHEET (in USD) 2008 2009 2010 SOURCES OF FUND Shareholder's Fund Share Capital - Promoters 2,500 2,500 2,500 Share Capital - VC 1,071 1,071 1,071 Share Premium 26,929 26,929 26,929 Reserves and Surplus 42,930 42,616 26,981 Net Worth 72,359 72,045 56,410 Loans Funds TOTAL LIABILITIES 72,359 72,045 56,410 APPLICATION OF FUNDS Fixed Assets Gross block 1,250 14,608 25,927 Accumulated Depreciation 313 3652 6482 Net Fixed assets 938 10956 19445 Investments 0 0 0 Current Assets Sundry Debtors 59,100 84,600 110,056 Cash in Hand & Bank 44521 26913 -462 Current Liabilities Sundry Creditors 32,200 50,424 72,629 Net Current Assets 71,421 61,089 36,965 TOTAL ASSETS 72,359 72,045 56,410 Ratio Analysis 2008 2009 2010 ROE 59.33% 59.15% 47.83% Sales/ Book Value 4 7 15 EPS assumin 1 share of 1$ 12.02 11.93 7.55 Operating Margin 46% 40% 34% Overhead Expenses to Opeating Exp 46% 56% 72% Gross Profit/ Net Profit 32% 25% 14% Return on Net Assets 60% 70% 73% Current Ratio 3.22 2.21 1.51 Cash to Net Assets 62% 44% -1% Break Even Analysis 2008 2009 2010 Sales 295,500 423,000 550,280 Variable cost 161,000 252,120 363,145 Semi- Variable Cost 38,110 58,884 83,635 Contribution 96,390 111,996 103,500 Contribution Per Unit 96 93 72 Fixed Cost 29,863 45,952 61,510
  • 3. Break Even (Units) 310 492 856
  • 4. Assumptions 2008 2009 2010 Growth 20% 20% Selling Price would not increase 187.5 187.5 187.5 Rise in COGS (%) 0% 10% 10% Sensor Sale per Machine would decrease in years 12 11 10 Rise in COGS of Sensor (%) 0% 10% 10% Sales Projection on Realistic basis 1000 1200 1440 Selling Price of Cartridge (it would kep reducing) 9 7.5 7 COGS of Sensor would increase 0% 10% 10% We assume that investment in miscelleaneus assets on % of GP 8% 8% 8% Depreciation WDV 25% 25% 25% Valuation Pre Investment 2008 2009 2010 PAT 43,243 42,929 27,294 Depreciation 313 313 313 Cash Flow 43,555 43,241 27,606 Year 1 2 3 Discounting Rate 0.12 0.12 0.12 Discounting Factor 0.89 0.8 0.71 PV of Cash Flows 38888.73 34471.55 19649.63 Other expenses are taken as percentage of sale @2% 2% Sum Of Present Values 93009.91 Purchase 30% Value - Equity Err:502
  • 5. Investment Strategy 2008 2009 2010 Equity 28000 Debt Commitment (with conditions) @10 % 50000 50000 75000 Rate of Interest 10% PLR+2.25% PLR+2.25% We would embed a real option into the debt converting debt into equity within a period of two years from the date of debt given but only till Dec 2011 as last Valuation of company for converting debt into equity would be Years 2008 2009 2010 Increment for Valuation in future years 40% 60% 80% Valuation of Company for these years 130667 149333 168000 Example Date of loan given Dec-08 Nov-09 Mar-10 Debt given 50000 50000 50000 Rate of Interest 10% PLR+2.25% PLR+2.25% Exercising Right Valid Till Dec-10 Nov-11 Dec-11 Debt conversion in the following years 50000 40000 40000 Equity 38% 27% 24% UPPER Cap on VC shareholding would not be more than 60% at any point of time Investment Plan 2008 2009 2010 Equity 28000 Debt Commitment 50000 50000 75000 Key Benchmarks to achieve Sales of minimum Machines 800 960 1100 Sensors 6400 14080 22880 Minimum Level of ROE 30% 30% 30% R&D expenses Both the Products are to be evalued and stage of development would be considered Rating of UNICEF would be takeninto consideration Equity Dilution Any stake dilution would not be permisible without the consent of VC The VC would have "First right of Refusal" THe Promoter cannot engage in any other business with the same kind of research Any dealings with Bhat Bio- Tech India Pvt Ltd would have to be cleared from the director of VC
  • 6.
  • 7. Cost of Manufacturing Annual Increase in Cost of Goods Sold* 10% Sales & General Expenses as proportion of Cost of Goods Sold 20% Sundry Debtors as % of Sales 20% Sundry Creditors as % of Cost of Goods sold 20% Initial Assets (Testing Eqpt and Electrode Mfg Eqpt) 50000 Annual Rate of Depreciation 25% Reducing Balance Method used for Depreciation Tax Rate (Corporate tax) 35% R& D Investment as % of Sales 10% Interest Rates Long term Debt 10% Provision for dividend (Including CDT) 12.50%