SlideShare uma empresa Scribd logo
1 de 16
Baixar para ler offline
HOW TO MAKE BULLET CHARTS
data visualisation tool
Poor Ok Good
Target
Actual
Good Job!
Why use bullet charts?
• Want to compare performance of a metric e.g.
Sales in two periods e.g. this year v’s last year
(or target) on a continuum that also shows
Poor, Ok and Good performance
• Quick to read and understand (if familiar with
them) …
0 200 400 600 800 1000 1200 1400 1600 1800 2000 2200 2400 2600 2800 3000
Product A
Sales YTD v's Last Year
How to read Bullet Charts
• The Scale here is ‘000 … hundred thousand
• Product A YTD is 100 (as in €100,000)
• Target (or alternatively last year’s Sales) is represented by thin blue
line.
• The first dark purple shade is Poor Performance
• The next shade (green) is OK performance
• The final shaded area in Red denotes good performance … last year
almost made this mark
• Conclusion … Way off the mark. Needs further examination. Could be
early in the year or else product is not being focused on, or have
competitors come in.
0 200 400 600 800 1000 1200 1400 1600 1800 2000 2200 2400 2600 2800 3000
'000 Euro
Product A
Sales YTD v's Last Year
Target
Step 1
• Download Excel Add on and Install
http://www.aculocity.com/BulletGraph.aspx**
• Outcome – Bullet chart tab in Excel
** The author is not associated with this business and this presentation does not imply an
endorsement for this organisation but the software works!
To create bullet chart
• Add a data chart as follows
• Can be linked to data in other sheets
YTD 2012
Sales 100000 268,842.07
Revenue Retailers 80000 259200.00
Revenue Online 20000 9642.07
Cost of Sales 90000 178,629.25
Gross Profit 10000 90,212.82
Owner's Salary / Drawings 0 9,000.00
Total Expenses 25000 96,855.04
Net Profit / Loss -15000 (6,642.22)
To create bullet chart cont.
• Click on bullet chart
• Select ADD NEW BULLET GRAPH
• This pop up appears
Menu Boxes explained
• Graph Location is taken from the name of your
Tab. No need to worry about it further!
• Not sure what this is called so will refer to it as
‘cell insert dropdown’
Menu Boxes explained
• Quantitative Scale Start
– Generally is left at Zero
– But it can be set to negative value … more on this
later!
-500 -400 -300 -200 -100 0 100 200 300 400 500 600 700 800 900 1000
Net Profit
Menu Boxes explained cont.
• Quantitative Scale Tick Interval
– The default is 100
– Decide when you decide on
• Quantitative Scale Ticks
– Default is 10 … ensures a nice scale chart. If goes
beyond 15 the chart gets unmanageable. This chart
has 5 ticks.
• If you multiply the tick interval by the number of
scale ticks you get a number which is the Max of
the Scale. As such if you want the scale to go to
1,0000,000 you have a few options:
– 100000 Tick Interval by 10 Ticks
– 50000 Tick Interval by 20 Ticks
• You can change all these in a minute anyways… 0
600
1200
1800
2400
3000
Bullet Graph
• Featured measure … in our case Sales YTD …
this is the one that will be the column. BTW if
the value changes the column changes
automatically.
• Comparative measure .. In our case Sales
Target results in the Target Line. … what fixed
target or benchmark are you comparing to!
Menu Boxes explained cont.
Featured
measure
0 200 400 600 800 1000 1200 1400 1600 1800 2000 2200 2400 2600 2800 3000
'000 Euro
Product A
Sales YTD v's Last Year
Comparative
Measure
Value of Shaded Areas
• The Bullet Chart allows comparison to Poor,
OK and Good Performance which by default
are set at 70%, 71-89%, and 90-100% … these
defaults can be changed … see next slides
Bottom
70%
0 200 400 600 800 1000 1200 1400 1600 1800 2000 2200 2400 2600 2800 3000
'000 Euro
Product A
Sales YTD v's Last Year
Top 10%
To edit the resulting chart
• When you have selected (highlighted) a Bullet
Chart, and click on the BULLET GRAPH Tab the
following menu appearing allowing the
selected Bullet Chart to be edited
Button Graph Tab Options
• Adjust Orientation … to change from a
horizontal (bar) to a vertical (column) chart.
• Change the label of the column
(Product A in previous examples)
• Change the font size etc etc
• Change the values of the Shaded Areas …
value of Poor, Ok and Good Performance.
Click on reverse to see what it does!
Other Edit functions
• Design allows changes to the Bar Chart .. E.g.
add Colour
• Layout lets you add a Chart Title…. But don’t
put on the legend.
• Format lets you work on Background colours
• For my Bullet Chart, I wanted lots of ticks but
still wanted a small chart.
• For this I added another two columns to my
table and used those to create the Bullet
Chart. See table on next slide.
And finally
Featured
measure
0 200 400 600 800 1000 1200 1400 1600 1800 2000 2200 2400 2600 2800 3000
'000 Euro
Product A
Sales YTD v's Last Year
Comparative
Measure
This presentation was uploaded to
Slideshare by Donncha Hughes in
July 2013
donncha@startuphughes.com
www.startuphughes.com

Mais conteúdo relacionado

Destaque

Financial Health of the Higher Education Sector 2013
Financial Health of the Higher Education Sector 2013Financial Health of the Higher Education Sector 2013
Financial Health of the Higher Education Sector 2013
Tom Davies
 
Role of CFO for better financial management
Role of CFO for better financial managementRole of CFO for better financial management
Role of CFO for better financial management
SuperCFO
 
21st century skills g&c
21st century skills g&c21st century skills g&c
21st century skills g&c
T.S.C(CHANGO)
 

Destaque (10)

Financial Health of the Higher Education Sector 2013
Financial Health of the Higher Education Sector 2013Financial Health of the Higher Education Sector 2013
Financial Health of the Higher Education Sector 2013
 
Role of CFO for better financial management
Role of CFO for better financial managementRole of CFO for better financial management
Role of CFO for better financial management
 
Financial planning for higher education
Financial planning for higher educationFinancial planning for higher education
Financial planning for higher education
 
Business Plans In A Nutshell
Business Plans In A NutshellBusiness Plans In A Nutshell
Business Plans In A Nutshell
 
21st century skills g&c
21st century skills g&c21st century skills g&c
21st century skills g&c
 
Open Data + Good Design: How Information Becomes an Empowerment Tool
Open Data + Good Design: How Information Becomes an Empowerment ToolOpen Data + Good Design: How Information Becomes an Empowerment Tool
Open Data + Good Design: How Information Becomes an Empowerment Tool
 
Vietnam Law on Tendering - Number 61 2005-QH11
Vietnam Law on Tendering - Number 61 2005-QH11Vietnam Law on Tendering - Number 61 2005-QH11
Vietnam Law on Tendering - Number 61 2005-QH11
 
The CFO contemporary role
The CFO contemporary roleThe CFO contemporary role
The CFO contemporary role
 
$5 COUPON LINK - Excel Udemy Course: Excel with Excel Dynamic Graphs, Dashboa...
$5 COUPON LINK - Excel Udemy Course: Excel with Excel Dynamic Graphs, Dashboa...$5 COUPON LINK - Excel Udemy Course: Excel with Excel Dynamic Graphs, Dashboa...
$5 COUPON LINK - Excel Udemy Course: Excel with Excel Dynamic Graphs, Dashboa...
 
How To Win Your Next Tender
How To Win Your Next TenderHow To Win Your Next Tender
How To Win Your Next Tender
 

Último

+971581248768>> SAFE AND ORIGINAL ABORTION PILLS FOR SALE IN DUBAI AND ABUDHA...
+971581248768>> SAFE AND ORIGINAL ABORTION PILLS FOR SALE IN DUBAI AND ABUDHA...+971581248768>> SAFE AND ORIGINAL ABORTION PILLS FOR SALE IN DUBAI AND ABUDHA...
+971581248768>> SAFE AND ORIGINAL ABORTION PILLS FOR SALE IN DUBAI AND ABUDHA...
?#DUbAI#??##{{(☎️+971_581248768%)**%*]'#abortion pills for sale in dubai@
 

Último (20)

Handwritten Text Recognition for manuscripts and early printed texts
Handwritten Text Recognition for manuscripts and early printed textsHandwritten Text Recognition for manuscripts and early printed texts
Handwritten Text Recognition for manuscripts and early printed texts
 
2024: Domino Containers - The Next Step. News from the Domino Container commu...
2024: Domino Containers - The Next Step. News from the Domino Container commu...2024: Domino Containers - The Next Step. News from the Domino Container commu...
2024: Domino Containers - The Next Step. News from the Domino Container commu...
 
How to Troubleshoot Apps for the Modern Connected Worker
How to Troubleshoot Apps for the Modern Connected WorkerHow to Troubleshoot Apps for the Modern Connected Worker
How to Troubleshoot Apps for the Modern Connected Worker
 
Tech Trends Report 2024 Future Today Institute.pdf
Tech Trends Report 2024 Future Today Institute.pdfTech Trends Report 2024 Future Today Institute.pdf
Tech Trends Report 2024 Future Today Institute.pdf
 
How to Troubleshoot Apps for the Modern Connected Worker
How to Troubleshoot Apps for the Modern Connected WorkerHow to Troubleshoot Apps for the Modern Connected Worker
How to Troubleshoot Apps for the Modern Connected Worker
 
Scaling API-first – The story of a global engineering organization
Scaling API-first – The story of a global engineering organizationScaling API-first – The story of a global engineering organization
Scaling API-first – The story of a global engineering organization
 
Bajaj Allianz Life Insurance Company - Insurer Innovation Award 2024
Bajaj Allianz Life Insurance Company - Insurer Innovation Award 2024Bajaj Allianz Life Insurance Company - Insurer Innovation Award 2024
Bajaj Allianz Life Insurance Company - Insurer Innovation Award 2024
 
GenAI Risks & Security Meetup 01052024.pdf
GenAI Risks & Security Meetup 01052024.pdfGenAI Risks & Security Meetup 01052024.pdf
GenAI Risks & Security Meetup 01052024.pdf
 
presentation ICT roal in 21st century education
presentation ICT roal in 21st century educationpresentation ICT roal in 21st century education
presentation ICT roal in 21st century education
 
Strategies for Unlocking Knowledge Management in Microsoft 365 in the Copilot...
Strategies for Unlocking Knowledge Management in Microsoft 365 in the Copilot...Strategies for Unlocking Knowledge Management in Microsoft 365 in the Copilot...
Strategies for Unlocking Knowledge Management in Microsoft 365 in the Copilot...
 
What Are The Drone Anti-jamming Systems Technology?
What Are The Drone Anti-jamming Systems Technology?What Are The Drone Anti-jamming Systems Technology?
What Are The Drone Anti-jamming Systems Technology?
 
Understanding Discord NSFW Servers A Guide for Responsible Users.pdf
Understanding Discord NSFW Servers A Guide for Responsible Users.pdfUnderstanding Discord NSFW Servers A Guide for Responsible Users.pdf
Understanding Discord NSFW Servers A Guide for Responsible Users.pdf
 
Strategize a Smooth Tenant-to-tenant Migration and Copilot Takeoff
Strategize a Smooth Tenant-to-tenant Migration and Copilot TakeoffStrategize a Smooth Tenant-to-tenant Migration and Copilot Takeoff
Strategize a Smooth Tenant-to-tenant Migration and Copilot Takeoff
 
+971581248768>> SAFE AND ORIGINAL ABORTION PILLS FOR SALE IN DUBAI AND ABUDHA...
+971581248768>> SAFE AND ORIGINAL ABORTION PILLS FOR SALE IN DUBAI AND ABUDHA...+971581248768>> SAFE AND ORIGINAL ABORTION PILLS FOR SALE IN DUBAI AND ABUDHA...
+971581248768>> SAFE AND ORIGINAL ABORTION PILLS FOR SALE IN DUBAI AND ABUDHA...
 
Exploring the Future Potential of AI-Enabled Smartphone Processors
Exploring the Future Potential of AI-Enabled Smartphone ProcessorsExploring the Future Potential of AI-Enabled Smartphone Processors
Exploring the Future Potential of AI-Enabled Smartphone Processors
 
04-2024-HHUG-Sales-and-Marketing-Alignment.pptx
04-2024-HHUG-Sales-and-Marketing-Alignment.pptx04-2024-HHUG-Sales-and-Marketing-Alignment.pptx
04-2024-HHUG-Sales-and-Marketing-Alignment.pptx
 
GenCyber Cyber Security Day Presentation
GenCyber Cyber Security Day PresentationGenCyber Cyber Security Day Presentation
GenCyber Cyber Security Day Presentation
 
Boost Fertility New Invention Ups Success Rates.pdf
Boost Fertility New Invention Ups Success Rates.pdfBoost Fertility New Invention Ups Success Rates.pdf
Boost Fertility New Invention Ups Success Rates.pdf
 
Strategies for Landing an Oracle DBA Job as a Fresher
Strategies for Landing an Oracle DBA Job as a FresherStrategies for Landing an Oracle DBA Job as a Fresher
Strategies for Landing an Oracle DBA Job as a Fresher
 
Boost PC performance: How more available memory can improve productivity
Boost PC performance: How more available memory can improve productivityBoost PC performance: How more available memory can improve productivity
Boost PC performance: How more available memory can improve productivity
 

How to make bullet charts

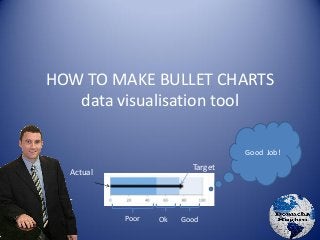
  • 1. HOW TO MAKE BULLET CHARTS data visualisation tool Poor Ok Good Target Actual Good Job!
  • 2. Why use bullet charts? • Want to compare performance of a metric e.g. Sales in two periods e.g. this year v’s last year (or target) on a continuum that also shows Poor, Ok and Good performance • Quick to read and understand (if familiar with them) … 0 200 400 600 800 1000 1200 1400 1600 1800 2000 2200 2400 2600 2800 3000 Product A Sales YTD v's Last Year
  • 3. How to read Bullet Charts • The Scale here is ‘000 … hundred thousand • Product A YTD is 100 (as in €100,000) • Target (or alternatively last year’s Sales) is represented by thin blue line. • The first dark purple shade is Poor Performance • The next shade (green) is OK performance • The final shaded area in Red denotes good performance … last year almost made this mark • Conclusion … Way off the mark. Needs further examination. Could be early in the year or else product is not being focused on, or have competitors come in. 0 200 400 600 800 1000 1200 1400 1600 1800 2000 2200 2400 2600 2800 3000 '000 Euro Product A Sales YTD v's Last Year Target
  • 4. Step 1 • Download Excel Add on and Install http://www.aculocity.com/BulletGraph.aspx** • Outcome – Bullet chart tab in Excel ** The author is not associated with this business and this presentation does not imply an endorsement for this organisation but the software works!
  • 5. To create bullet chart • Add a data chart as follows • Can be linked to data in other sheets YTD 2012 Sales 100000 268,842.07 Revenue Retailers 80000 259200.00 Revenue Online 20000 9642.07 Cost of Sales 90000 178,629.25 Gross Profit 10000 90,212.82 Owner's Salary / Drawings 0 9,000.00 Total Expenses 25000 96,855.04 Net Profit / Loss -15000 (6,642.22)
  • 6. To create bullet chart cont. • Click on bullet chart • Select ADD NEW BULLET GRAPH • This pop up appears
  • 7. Menu Boxes explained • Graph Location is taken from the name of your Tab. No need to worry about it further! • Not sure what this is called so will refer to it as ‘cell insert dropdown’
  • 8. Menu Boxes explained • Quantitative Scale Start – Generally is left at Zero – But it can be set to negative value … more on this later! -500 -400 -300 -200 -100 0 100 200 300 400 500 600 700 800 900 1000 Net Profit
  • 9. Menu Boxes explained cont. • Quantitative Scale Tick Interval – The default is 100 – Decide when you decide on • Quantitative Scale Ticks – Default is 10 … ensures a nice scale chart. If goes beyond 15 the chart gets unmanageable. This chart has 5 ticks. • If you multiply the tick interval by the number of scale ticks you get a number which is the Max of the Scale. As such if you want the scale to go to 1,0000,000 you have a few options: – 100000 Tick Interval by 10 Ticks – 50000 Tick Interval by 20 Ticks • You can change all these in a minute anyways… 0 600 1200 1800 2400 3000 Bullet Graph
  • 10. • Featured measure … in our case Sales YTD … this is the one that will be the column. BTW if the value changes the column changes automatically. • Comparative measure .. In our case Sales Target results in the Target Line. … what fixed target or benchmark are you comparing to! Menu Boxes explained cont. Featured measure 0 200 400 600 800 1000 1200 1400 1600 1800 2000 2200 2400 2600 2800 3000 '000 Euro Product A Sales YTD v's Last Year Comparative Measure
  • 11. Value of Shaded Areas • The Bullet Chart allows comparison to Poor, OK and Good Performance which by default are set at 70%, 71-89%, and 90-100% … these defaults can be changed … see next slides Bottom 70% 0 200 400 600 800 1000 1200 1400 1600 1800 2000 2200 2400 2600 2800 3000 '000 Euro Product A Sales YTD v's Last Year Top 10%
  • 12. To edit the resulting chart • When you have selected (highlighted) a Bullet Chart, and click on the BULLET GRAPH Tab the following menu appearing allowing the selected Bullet Chart to be edited
  • 13. Button Graph Tab Options • Adjust Orientation … to change from a horizontal (bar) to a vertical (column) chart. • Change the label of the column (Product A in previous examples) • Change the font size etc etc • Change the values of the Shaded Areas … value of Poor, Ok and Good Performance. Click on reverse to see what it does!
  • 14. Other Edit functions • Design allows changes to the Bar Chart .. E.g. add Colour • Layout lets you add a Chart Title…. But don’t put on the legend. • Format lets you work on Background colours
  • 15. • For my Bullet Chart, I wanted lots of ticks but still wanted a small chart. • For this I added another two columns to my table and used those to create the Bullet Chart. See table on next slide. And finally Featured measure 0 200 400 600 800 1000 1200 1400 1600 1800 2000 2200 2400 2600 2800 3000 '000 Euro Product A Sales YTD v's Last Year Comparative Measure
  • 16. This presentation was uploaded to Slideshare by Donncha Hughes in July 2013 donncha@startuphughes.com www.startuphughes.com