Late Summer US Inflation Spike Ends, Deflation Expectations Nosedive
•Transferir como PPTX, PDF•
1 gostou•2,628 visualizações

The late-summer spike in US CPI inflation ended in October. Deflation expectations fell sharply after the November election, and inflation expectations remain low

Recomendados
Recomendados
Mais conteúdo relacionado
Mais procurados
Mais procurados (20)
Semelhante a Late Summer US Inflation Spike Ends, Deflation Expectations Nosedive
Semelhante a Late Summer US Inflation Spike Ends, Deflation Expectations Nosedive (20)
Mais de Ed Dolan
Mais de Ed Dolan (20)
Último
Último (20)
Late Summer US Inflation Spike Ends, Deflation Expectations Nosedive
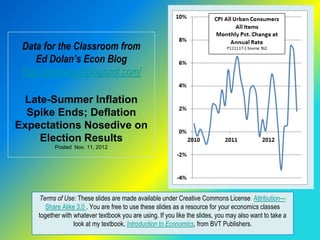
- 1. Data for the Classroom from Ed Dolan’s Econ Blog http://dolanecon.blogspot.com/ Late-Summer Inflation Spike Ends; Deflation Expectations Nosedive on Election Results Posted Nov. 11, 2012 Terms of Use: These slides are made available under Creative Commons License Attribution— Share Alike 3.0 . You are free to use these slides as a resource for your economics classes together with whatever textbook you are using. If you like the slides, you may also want to take a look at my textbook, Introduction to Economics, from BVT Publishers.
- 2. Late-Summer Inflation Spike Seems to Have Run its Course The all-items U.S. consumer price index rose at an annual rate of just 1.81 percent in October, down from a spike to 7.48 percent in August and 7.06 percent in September. Most of the slowdown came from a drop in energy prices, which had soared in the previous two months. New and used car prices also fell. Increases in the prices of food and apparel partly offset the decreases in energy and vehicles. Posted Nov. 17, 2012 on Ed Dolan’s Econ Blog http://dolanecon.blogspot.com
- 3. Core Inflation Remains Moderate Food and energy prices are volatile and usually account for much of the month-to-month change in the CPI Their effect can be removed by taking food and energy out of the CPI. The result is called the core inflation rate. Core inflation for October was 2.18 percent, about the average for the year Posted Nov. 17, 2012 on Ed Dolan’s Econ Blog http://dolanecon.blogspot.com
- 4. Trimmed Mean Inflation Also Remains Low Another way to remove volatility is the 16% trimmed mean CPI published by the Federal Reserve Bank of Cleveland. It removes the 8% of prices that increase most and the 8% that increase least in each month (or decrease most), whatever they are The 16 percent trimmed mean CPI slowed to an annual rate of 1.69 percent in October Posted Nov. 17, 2012 on Ed Dolan’s Econ Blog http://dolanecon.blogspot.com
- 5. Which Measure is Best? The CPI for all items gives the most accurate measure of current changes in the cost of living Economists at the Fed look closely at the core and trimmed mean CPIs to judge the effect of monetary policy on underlying inflationary trends The Fed considers inflation of about 2 percent to be consistent with prudent monetary policy. All three measures were close to that value in October. Posted Nov. 17, 2012 on Ed Dolan’s Econ Blog http://dolanecon.blogspot.com
- 6. The Longer Term Trend To see longer term trends in inflation, it is useful to look at year- on-year changes, which compare each month’s price level with that of the same month in the year before All y-o-y measures of inflation rates slowed during the global recession, then rose again for most of 2011. The three y-o-y series shown here are all now close to Fed’s 2 percent target Posted Nov. 17, 2012 on Ed Dolan’s Econ Blog http://dolanecon.blogspot.com
- 7. Deflation Probabilities The Atlanta Fed uses Treasury Inflation Protected Securities (TIPS) prices to calculate the probability of deflation over a given 5-year period This chart shows that the risk of deflation dropped sharply after the election Posted Nov. 17, 2012 on Ed Dolan’s Econ Blog http://dolanecon.blogspot.com
- 8. Expected Inflation The Cleveland Fed uses the same TIPS prices to estimate expected inflation over 5- and 10-year time horizons Inflation expectations have been trending downward for several years The most recent months show a moderate increase, perhaps reflecting an expectation that the Fed’s latest program of quantitative easing will have its intended effect of raising inflation close to the 2- percent target Posted Nov. 17, 2012 on Ed Dolan’s Econ Blog http://dolanecon.blogspot.com