
Recomendados
Mais conteúdo relacionado
Semelhante a Community Need Project Rubric The Community Need Projec.docx
Semelhante a Community Need Project Rubric The Community Need Projec.docx (20)
Mais de divinapavey
Mais de divinapavey (20)
Último
Último (20)
Community Need Project Rubric The Community Need Projec.docx
- 1. Community Need Project Rubric The Community Need Project has four important issues that need to be addressed: the description of the community, the description of the need/problem, the strategy to meet the need, and the assessment plan. This rubric examines each of these elements as well as the writing associated with the plan. In the case of a media presentation, the writing sections will be modified to assess the PowerPoint and the voice-over. Attribute Evaluated POS PTS PTS 1. Community and Key Stakeholders – This element looks at the first section of the project. A 1 indicates a major deficiency in this section: poor description of the community, no demographic information provided, no values and belief information provided, and no identification of the major stakeholders, or contradictory information provided. A 20 is awarded for a clear and insightful examination of the community that includes an introduction to the community, demographic information, values/beliefs information and discussion of the key stakeholders. Projects receiving a 20 also capture the imagination of the reader and paint a picture of the community.
- 2. 20 2. Need to be Addressed – This element looks at how well you were able to articulate the need (problem). A 1 indicates that there is no need identified and no explanation of the need and how the need impacts the community is omitted. A 20 indicates that the need is clearly identified, the nature of the need is discussed, the reason it should be addressed is explored, and the impact on the community is examined; furthermore, the use of language helps create compelling case for meeting the need. 20 3. Plan to Meet the Need – This area focuses on the plan to meet the need or solve the problem. A 1 indicates that there is no coherent plan articulated to meet the need. A 20 indicates that there is a thoughtful plan that is sufficiently integrated, addresses the issues of key stakeholders, and discusses in general terms the outcome for the community of meeting the need. 20 4. Assessment Plan – This element focuses on the assessment plan. A 1 indicates that the assessment plan is missing. A 20 is awarded when the two meaningful goals have appropriate measurement strategies and an overall plan that could generate actionable data. 20
- 3. 5. Organization, Language, Tone, & Sentence Structure– The use of language, the tone, and the sentence structure are evaluated against the appropriateness for a college level course. On this scale, 1 is inappropriate use of language, multiple wrong words selected, overly simplistic sentence structure, and/or a tone derived from the choice of words that undermines the project. Projects that also lack organization including a summary conclusion are awarded a 1. A 10 indicates an elegant use of language and sentence structure that balances an understanding of the audience with the need to communicate the essence of the project. Additionally, the paper meriting a 10 is well organized, flows smoothly through the four sections and includes a summary conclusion. 10 6. Grammar and Punctuation – The expectation is that you use appropriate grammar and have appropriate punctuation. Too many mistakes indicate that you don’t take the work seriously, so the reader should not either. A 1 on this scale indicates that there are numerous grammatical and punctuation errors which encourage the reader to stop reading. A 10 indicates that there were few if any mistakes and those errors did not interfere reader’s support for the project. 10 7. Documentation – You appropriately identify source material used in your arguments. Although there are no points for this rubric, as you are expected to
- 4. appropriately source other works. Please refer to NEC’s academic honesty policies and the APA format. 0 Total Points/Letter Grade 100 Comments & Observations: Morris, International Business, 1e Help | System Announcements DOWNLOADABLE eTEXTBOOK PRINTER VERSION BACK NEXT CHAPTER RESOURCES Reading Content Introduction 11.1 Technology as Physical Infrastructure 11.2 Technology of Information Infrastructure 11.3 Technology of Human Infrastructure 11.4 Technology Trends in International Business Summary and Case ORION: Build your Proficiency Videos
- 5. Animations Multimedia Study Tools Business Hot Topics COURSE RESOURCES Career Center Business Hot Topics Videos Animations PRACTICE Chapter 11 Reading Quiz APPENDIX 11.4 Technology Trends in International Business LEARNING OBJECTIVE Discuss how global business leaders position their firms to take advantage of technological opportunities. The creation of new technologies can have a profound impact on global business opportunities. For instance, Safaricom (one of the largest mobile operators in Kenya) and Vodacom (the African arm of Vodafone of the United Kingdom, which owns a 40 percent stake in Safaricom) teamed up ten years ago to provide a new product called M-Pesa. This simple but effective phone-based money transfer system enables individuals to deposit, withdraw, transfer, buy mobile minutes and data, and even pay for goods and services with a simple text message. Most Kenyans don't have access to a bank and don't have enough funds to open a bank account anyway. M-Pesa provides an alternative to the traditional
- 6. banking system but provides similar benefits for individuals: they are able to securely store and use their money. The product has been very successful in Kenya. In that country of 44 million people, M-Pesa has nearly 20 million registered users, including 90 percent of adults. The system is supported by more than 90,000 M-Pesa agents who act as points of contact for customers, enabling them to deposit and withdraw money from their M- Pesa accounts. M-Pesa payments now represent over 40 percent of the country's GDP. Nearly everyone in the country is using the service to buy and sell goods and services and to send money. Because it provides benefits like those of banking—with perhaps even more convenience—it has improved the lives of millions. Not only is the technology of M-Pesa providing individuals with value, it has provided many opportunities for business. For instance, because it offers a secure payment process, employers use it to pay salaries. When M- Pesa entered Afghanistan, the government there also began using M-Pesa to pay salaries. Immediately, police officers saw a roughly 30 percent increase in their paychecks because the process cut out corrupt officials who had been skimming the officers' salaries. M-Pesa also reduces crime because individuals are not walking around with cash, so there is less incentive for robberies. The service not only benefits the companies and customers that use it, but according to Bob Collymore, the CEO of Safaricom, the company makes a $250- million-a-year profit. In addition to making money for the company and providing a valuable service to millions, this new technology has paved the way for a flood of entrepreneurial ventures. For instance, M-KOPA Solar offers customers in
- 7. Kenya, Tanzania, and Uganda a “4-watt rooftop solar panel, a control box that attaches to the wall of a home or business, three lamps, and mobile-phone chargers.” To purchase the $200 unit, the company requires a roughly $35 down payment and then a daily payment of 40 Kenyan shillings, or about 40 cents, for 365 days, until the unit is paid off. The customer uses M-Pesa to make the daily payment, and if the payment is not made, the lights will not turn on until payments resume. The $200 cost may seem high, but it is actually cheaper than the kerosene lamp alternative most Kenyans currently use. Moreover, once the unit is paid for, the customer gets free power. The opportunity to invest in their personal energy needs has improved the lives of over 400,000 customers. Similarly, the village of Njogu-ini installed a clean-water well that uses mobile payments through the M-Pesa platform. Residents simply walk to the well and use their phone to pay the small fee to activate the pump, providing them access to clean water. Water obtained this way costs about $6 a month per person. The critical feature is that the technology allows micropayments that are reasonable in the context of Kenyan life, while still enabling villagers to get clean water. Now that the technology has been established, Safaricom is using the M-Pesa platform to expand to provide other services, such as mobile health care initiatives. The mHealth Kenya service enables doctors to remotely diagnose patients using cell phones, and patients can pay providers using their M-Pesa accounts. In addition, the government of Kenya is using M-Pesa to distribute e- vouchers for prenatal care in an effort to increase the health of mothers and babies.
- 8. 94 95 96 97 98 99 100 101 DOWNLOADABLE eTEXTBOOK PRINTER VERSION BACK NEXT CHAPTER RESOURCES Reading Content Introduction 11.1 Technology as Physical Infrastructure 11.2 Technology of Information Infrastructure 11.3 Technology of Human Infrastructure 11.4 Technology Trends in International Business Summary and Case ORION: Build your Proficiency Videos Animations Multimedia Study Tools
- 9. Business Hot Topics COURSE RESOURCES Career Center Business Hot Topics Videos Animations PRACTICE Chapter 11 Reading Quiz APPENDIX 11.4 Technology Trends in International Business LEARNING OBJECTIVE Discuss how global business leaders position their firms to take advantage of technological opportunities. The creation of new technologies can have a profound impact on global business opportunities. For instance, Safaricom (one of the largest mobile operators in Kenya) and Vodacom (the African arm of Vodafone of the United Kingdom, which owns a 40 percent stake in Safaricom) teamed up ten years ago to provide a new product called M-Pesa. This simple but effective phone-based money transfer system enables individuals to deposit, withdraw, transfer, buy mobile minutes and data, and even pay for goods and services with a simple text message. Most Kenyans don't have access to a bank and don't have enough funds to open a bank account anyway. M-Pesa provides an alternative to the traditional banking system but provides similar benefits for individuals: they are able to securely store and use their money.
- 10. The product has been very successful in Kenya. In that country of 44 million people, M-Pesa has nearly 20 million registered users, including 90 percent of adults. The system is supported by more than 90,000 M-Pesa agents who act as points of contact for customers, enabling them to deposit and withdraw money from their M- Pesa accounts. M-Pesa payments now represent over 40 percent of the country's GDP. Nearly everyone in the country is using the service to buy and sell goods and services and to send money. Because it provides benefits like those of banking—with perhaps even more convenience—it has improved the lives of millions. Not only is the technology of M-Pesa providing individuals with value, it has provided many opportunities for business. For instance, because it offers a secure payment process, employers use it to pay salaries. When M- Pesa entered Afghanistan, the government there also began using M-Pesa to pay salaries. Immediately, police officers saw a roughly 30 percent increase in their paychecks because the process cut out corrupt officials who had been skimming the officers' salaries. M-Pesa also reduces crime because individuals are not walking around with cash, so there is less incentive for robberies. The service not only benefits the companies and customers that use it, but according to Bob Collymore, the CEO of Safaricom, the company makes a $250- million-a-year profit. In addition to making money for the company and providing a valuable service to millions, this new technology has paved the way for a flood of entrepreneurial ventures. For instance, M-KOPA Solar offers customers in Kenya, Tanzania, and Uganda a “4-watt rooftop solar panel, a control box that attaches to the wall of a home or
- 11. business, three lamps, and mobile-phone chargers.” To purchase the $200 unit, the company requires a roughly $35 down payment and then a daily payment of 40 Kenyan shillings, or about 40 cents, for 365 days, until the unit is paid off. The customer uses M-Pesa to make the daily payment, and if the payment is not made, the lights will not turn on until payments resume. The $200 cost may seem high, but it is actually cheaper than the kerosene lamp alternative most Kenyans currently use. Moreover, once the unit is paid for, the customer gets free power. The opportunity to invest in their personal energy needs has improved the lives of over 400,000 customers. Similarly, the village of Njogu-ini installed a clean-water well that uses mobile payments through the M-Pesa platform. Residents simply walk to the well and use their phone to pay the small fee to activate the pump, providing them access to clean water. Water obtained this way costs about $6 a month per person. The critical feature is that the technology allows micropayments that are reasonable in the context of Kenyan life, while still enabling villagers to get clean water. Now that the technology has been established, Safaricom is using the M-Pesa platform to expand to provide other services, such as mobile health care initiatives. The mHealth Kenya service enables doctors to remotely diagnose patients using cell phones, and patients can pay providers using their M-Pesa accounts. In addition, the government of Kenya is using M-Pesa to distribute e- vouchers for prenatal care in an effort to increase the health of mothers and babies. 94 95
- 12. 96 97 98 99 100 101 https://edugen.wileyplus.com/edugen/lti/main.uni 2020/6/10 17;39 第 1 ⻚⻚(共 4 ⻚⻚) M-Pesa has changed the economic landscape in Kenya and is expanding to Tanzania, Afghanistan, South Africa, India, Eastern Europe, and more. The simple but effective technology is also starting to be copied by other companies in more advanced markets. Tencent—a large computer technology company in China—has announced WeChat mobile payments, and even Apple is working on a text-based payment system that would enable users to text money to one another. All these opportunities—and countless more—came about because a new technology enabled millions of Kenyans, traditionally overlooked by international businesses, to safely store money and make mobile payments. The Globalization of Research and Development Historically, international companies conducted their research
- 13. and development (R&D) at their corporate headquarters and pushed the products they invented there to the rest of the world. Over the past decade, this strategy has changed in two ways. First, international companies are spending more money on R&D. Second, they have moved R&D to locations around the world, particularly China and India. When looking at R&D trends, most analyses focus on the level of gross expenses on research and development (GERD). For instance, total worldwide GERD in 2001 was just $753 billion. Five years later, in 2006, it had ticked up to $1.05 trillion, and in 2011, the amount passed $1.43 trillion—nearly double the 2001 figure. The trend has accelerated, with GERD topping $1.88 trillion in 2015. At that level, roughly 1.75 percent of world GPD is being spent on R&D. Of that, over $1.80 trillion is being spent by the top forty countries ranked by GDP. The United States represents more than 26 percent of global spending, China accounts for over 20 percent, and Japan comes in third with nearly 9 percent of worldwide R&D spending. While the amount of R&D spending is increasing everywhere, it is growing most rapidly in Asia, as global companies rush to fill the needs of the world's largest markets— China and India. A recent National Science Foundation report highlights this increase, noting that, while R&D spending is increasing in the United States and the European Union, the increase is proportional to increases in the countries' GDP. In Asia, on the other hand, R&D is increasing at a rate faster than the growth of GDP. These trends are highlighted in Figure 11.15. 102
- 14. 103 104 105 106 107 M-Pesa has changed the economic landscape in Kenya and is expanding to Tanzania, Afghanistan, South Africa, India, Eastern Europe, and more. The simple but effective technology is also starting to be copied by other companies in more advanced markets. Tencent—a large computer technology company in China—has announced WeChat mobile payments, and even Apple is working on a text-based payment system that would enable users to text money to one another. All these opportunities—and countless more—came about because a new technology enabled millions of Kenyans, traditionally overlooked by international businesses, to safely store money and make mobile payments. The Globalization of Research and Development Historically, international companies conducted their research and development (R&D) at their corporate headquarters and pushed the products they invented there to the rest of the world. Over the past decade, this strategy has changed in two ways. First, international companies are spending more money on R&D. Second, they have moved R&D to locations around the world, particularly China and India.
- 15. When looking at R&D trends, most analyses focus on the level of gross expenses on research and development (GERD). For instance, total worldwide GERD in 2001 was just $753 billion. Five years later, in 2006, it had ticked up to $1.05 trillion, and in 2011, the amount passed $1.43 trillion—nearly double the 2001 figure. The trend has accelerated, with GERD topping $1.88 trillion in 2015. At that level, roughly 1.75 percent of world GPD is being spent on R&D. Of that, over $1.80 trillion is being spent by the top forty countries ranked by GDP. The United States represents more than 26 percent of global spending, China accounts for over 20 percent, and Japan comes in third with nearly 9 percent of worldwide R&D spending. While the amount of R&D spending is increasing everywhere, it is growing most rapidly in Asia, as global companies rush to fill the needs of the world's largest markets— China and India. A recent National Science Foundation report highlights this increase, noting that, while R&D spending is increasing in the United States and the European Union, the increase is proportional to increases in the countries' GDP. In Asia, on the other hand, R&D is increasing at a rate faster than the growth of GDP. These trends are highlighted in Figure 11.15. 102 103 104 105
- 16. 106 107 https://edugen.wileyplus.com/edugen/lti/main.uni 2020/6/10 17;39 第 2 ⻚⻚(共 4 ⻚⻚) FIGURE 11.15 Total R&D spending and R&D spending as a percentage of GDP for select countries, 1981–2011 Source: “Chapter 4. Research and Development: National Trends and International Comparisons,” in “Science and Engineering Indicators 2014,” National Science Foundation, February 2014, www.nsf.gov/statistics/seind14/index.cfm/chapter-4/c4s2.htm. Private businesses, governments, higher education institutions, and private nonprofit donors typically invest in R&D. In the United States, nearly 70 percent of R&D is funded by businesses; that's less than the 83 percent in Israel but much more than the 36 percent funded by businesses in India. Perhaps more interesting is the nearly universal increase in business-sponsored funding (see Figure 11.16), indicating that global businesses are recognizing the competitive advantages that come from being at the forefront of technology. Share of total (%) Country GERD PPP ($billions) Business Government Institutions of higher
- 17. education Private nonprofit R&D funding sources United States (2011) $429.1 58.6% 31.2% 6.4% 3.8% China (2011) $208.2 73.9% 21.7% NA 1.3% Japan (2011) $146.5 76.5% 16.4% 6.6% 0.5% Germany (2010) $93.1 65.6% 30.3% 0.2% 3.9% South Korea (2011) $59.9 73.7% 24.9% 1.2% 0.2% France (2010) $51.9 53.5% 37.0% 1.8% 7.6% United Kingdom (2011) $39.6 44.6% 32.2% 6.2% 17.0% ** = included in data for other performing sectors; NA = not available. GERD = gross expenditures on R&D; PPP = purchasing power parity. FIGURE 11.16 Percentage of GERD by funding source, 2005–
- 18. 2011 Gross expenditures on R&D for selected countries, by performing sector and funding sources: 2011 or most recent year Source: Adapted by the authors from “Chapter 4. Research and Development: National Trends and International Comparisons,” in “Science and Engineering Indicators 2014,” National Science Foundation, February 2014, www.nsf.gov/statistics/seind14/index.cfm/chapter-4/c4s2.htm. The shift toward business-sponsored R&D is driven by the rise within emerging markets of local companies that develop advanced products for local and global customers. In response, many multinational companies are shifting R&D into those same markets to reclaim an edge. For instance, GE built R&D centers in China and India in 2000, expanded to Israel and Brazil in 2011, and entered Saudi Arabia in 2015. As a result, GE has introduced to its global customer base new products that were designed for a local market such as India. As a result, the company is now meeting customer needs different from those it traditionally focused on. 108 109 110 111 Concept Check 11.4 ! " Question 1 of 3 NEXT NEXT Question 1 There is a positive correlation between education spending and economic output. FIGURE 11.15 Total R&D spending and R&D spending as a
- 19. percentage of GDP for select countries, 1981–2011 Source: “Chapter 4. Research and Development: National Trends and International Comparisons,” in “Science and Engineering Indicators 2014,” National Science Foundation, February 2014, www.nsf.gov/statistics/seind14/index.cfm/chapter-4/c4s2.htm. Private businesses, governments, higher education institutions, and private nonprofit donors typically invest in R&D. In the United States, nearly 70 percent of R&D is funded by businesses; that's less than the 83 percent in Israel but much more than the 36 percent funded by businesses in India. Perhaps more interesting is the nearly universal increase in business-sponsored funding (see Figure 11.16), indicating that global businesses are recognizing the competitive advantages that come from being at the forefront of technology. Share of total (%) Country GERD PPP ($billions) Business Government Institutions of higher education Private nonprofit R&D funding sources United States (2011) $429.1 58.6% 31.2% 6.4% 3.8%
- 20. China (2011) $208.2 73.9% 21.7% NA 1.3% Japan (2011) $146.5 76.5% 16.4% 6.6% 0.5% Germany (2010) $93.1 65.6% 30.3% 0.2% 3.9% South Korea (2011) $59.9 73.7% 24.9% 1.2% 0.2% France (2010) $51.9 53.5% 37.0% 1.8% 7.6% United Kingdom (2011) $39.6 44.6% 32.2% 6.2% 17.0% ** = included in data for other performing sectors; NA = not available. GERD = gross expenditures on R&D; PPP = purchasing power parity. FIGURE 11.16 Percentage of GERD by funding source, 2005– 2011 Gross expenditures on R&D for selected countries, by performing sector and funding sources: 2011 or most recent year Source: Adapted by the authors from “Chapter 4. Research and Development: National Trends and International Comparisons,” in “Science and Engineering Indicators 2014,” National Science Foundation, February 2014, www.nsf.gov/statistics/seind14/index.cfm/chapter-4/c4s2.htm. The shift toward business-sponsored R&D is driven by the rise within emerging markets of local companies that
- 21. develop advanced products for local and global customers. In response, many multinational companies are shifting R&D into those same markets to reclaim an edge. For instance, GE built R&D centers in China and India in 2000, expanded to Israel and Brazil in 2011, and entered Saudi Arabia in 2015. As a result, GE has introduced to its global customer base new products that were designed for a local market such as India. As a result, the company is now meeting customer needs different from those it traditionally focused on. 108 109 110 111 Concept Check 11.4 ! " Question 1 of 3 NEXT NEXT Question 1 There is a positive correlation between education spending and economic output. https://edugen.wileyplus.com/edugen/lti/main.uni 2020/6/10 17;39 第 3 ⻚⻚(共 4 ⻚⻚) Copyright © 2018 by John Wiley & Sons, Inc. All rights reserved. Question Attempts: 0 of 1 used CHECK ANSWER True
- 22. False Copyright © 2018 by John Wiley & Sons, Inc. All rights reserved. Question Attempts: 0 of 1 used CHECK ANSWER True False https://edugen.wileyplus.com/edugen/lti/main.uni 2020/6/10 17;39 第 4 ⻚⻚(共 4 ⻚⻚) Morris, International Business, 1e Help | System Announcements DOWNLOADABLE eTEXTBOOK PRINTER VERSION BACK NEXT CHAPTER RESOURCES Reading Content Introduction 11.1 Technology as Physical Infrastructure 11.2 Technology of Information Infrastructure 11.3 Technology of Human Infrastructure 11.4 Technology Trends
- 23. in International Business Summary and Case ORION: Build your Proficiency Videos Animations Multimedia Study Tools Business Hot Topics COURSE RESOURCES Career Center Business Hot Topics Videos Animations PRACTICE Chapter 11 Reading Quiz APPENDIX 11.3 Technology of Human Infrastructure LEARNING OBJECTIVE Describe the effect of human capital on opportunities in a global business. Global companies not only face physical and information infrastructure challenges but also are often constrained by the level of human capital that is available in a market. Several factors are indicators of the availability of human capital. As Figure 11.13 suggests, these include education, corporate training, and alignment of educational, company, and government initiative
- 24. to build human capital. We now discuss each of these in turn. FIGURE 11.13 A Framework for assessing the level of technological infrastructure in countries Human capital infrastructure includes education, corporate training, and cooperation between companies, educational institutions, and governments. Education Human capital is the abilities, skills, experience, and knowledge possessed by individuals. The quality of human capital can have important implications for the growth and development of opportunities for international business. Economic output, for instance, is a function of labor and technology. If labor (human capital) is skilled, it will produce higher output per person per hour, leading to growth. Education is thus positively associated with positive economic outcomes. According to the National Center for Education Statistics, the United States spends about $12,000 per child per year for elementary and secondary education and more than $26,000 per student per year for postsecondary education—the highest amount in the OECD (see Figure 11.14). Note the positive slope of the line in Figure 11.14; this suggests that higher spending on education is correlated with higher GDP per person in a country. In other words, the more a country invests in education, the more wealthy it is likely to be. 73 DOWNLOADABLE eTEXTBOOK PRINTER VERSION BACK NEXT CHAPTER RESOURCES
- 25. Reading Content Introduction 11.1 Technology as Physical Infrastructure 11.2 Technology of Information Infrastructure 11.3 Technology of Human Infrastructure 11.4 Technology Trends in International Business Summary and Case ORION: Build your Proficiency Videos Animations Multimedia Study Tools Business Hot Topics COURSE RESOURCES Career Center Business Hot Topics Videos Animations PRACTICE Chapter 11 Reading Quiz APPENDIX 11.3 Technology of Human Infrastructure LEARNING OBJECTIVE
- 26. Describe the effect of human capital on opportunities in a global business. Global companies not only face physical and information infrastructure challenges but also are often constrained by the level of human capital that is available in a market. Several factors are indicators of the availability of human capital. As Figure 11.13 suggests, these include education, corporate training, and alignment of educational, company, and government initiative to build human capital. We now discuss each of these in turn. FIGURE 11.13 A Framework for assessing the level of technological infrastructure in countries Human capital infrastructure includes education, corporate training, and cooperation between companies, educational institutions, and governments. Education Human capital is the abilities, skills, experience, and knowledge possessed by individuals. The quality of human capital can have important implications for the growth and development of opportunities for international business. Economic output, for instance, is a function of labor and technology. If labor (human capital) is skilled, it will produce higher output per person per hour, leading to growth. Education is thus positively associated with positive economic outcomes. According to the National Center for Education Statistics, the United States spends about $12,000 per child per year for elementary and secondary education and more than $26,000 per student per year for postsecondary education—the highest amount in the OECD (see Figure 11.14). Note the positive slope of the line in Figure 11.14; this suggests that higher spending on
- 27. education is correlated with higher GDP per person in a country. In other words, the more a country invests in education, the more wealthy it is likely to be. 73 https://edugen.wileyplus.com/edugen/lti/main.uni 2020/6/10 17;38 第 1 ⻚⻚(共 4 ⻚⻚) FIGURE 11.14 Postsecondary Spending In 2012, among OECD countries, the United States spent the most per student on postsecondary education. Source: “Education Expenditures by Country,” National Center for Education Statistics, Institute of Education Sciences, May 2017, http://nces.ed.gov/programs/coe/indicator_cmd.asp. ManpowerGroup conducts surveys of global business leaders each year to ask them questions about hiring global talent. According to the 2016 survey, 40 percent of the 42,000 participating employers indicated they were facing a skills shortage, or having difficulty finding people with the right skills to fill vacant positions. The survey reaches companies in forty-three countries, so this is not a localized effect. Basic skills like reading, writing, and math are not the problem; rather, specific skills like mobile app design, nursing, and sales are in short supply. This skill shortage is particularly acute in Japan, where 83 percent of employers report having trouble. Some economists argue that a skills shortage should not exist because the unemployed would just move to fill the jobs, but others are quick to point out that those currently unemployed
- 28. simply do not have the skill sets needed for the available jobs, and in many countries laws prohibit those who do have the skills from immigrating to the country. For instance, given the United Kingdom's 2016 decision to leave the EU (“Brexit”), many are fearful that the skills shortage in the United Kingdom will increase. Students at a university in Seoul, South Korea, come from across the world—Brazil, Kenya, Pakistan, India, Nigeria, Turkey, Romania, Vietnam, and other countries— because their own countries faced severe skills shortages. Samsung recognized the skills shortages in these countries when it tried to find people who could run its global electronics operations. To combat the shortage, the company recruited the brightest undergraduate students from their home countries and gave them scholarships to study for an MBA in Korea. Upon graduation, the students would work for Samsung in Korea for a couple of years to further refine their skills. After that time, they would return to their home countries with all the skills to lead Samsung's businesses in these markets. This solution was effective for a time, but it was expensive for Samsung. Worse still, the newly trained employees were often hired away by other global companies in the local markets—after all, they were often some of the most skilled employees in their country. While most countries provide primary education for the majority of their populations, the quality of this education varies greatly. India operates the largest education system in the world, and that alone brings many challenges. Often, schools lack basic resources such as desks, books, and even teachers. In response, despite the availability of public education, roughly
- 29. 40 percent of families choose to send their children to private schools—even though private education represents a significant cost to the family. This trend is common throughout Asia. In Japan, Singapore, and Korea, families commonly invest heavily in private education, sending their children to after-school classes for math, English, and the sciences. After- school classes are so aggressive and competitive in Korea that the government instituted laws requiring schools to close at 10 p.m. and not start again before 6 a.m. Corporate Training and Development In addition to the level of education within a country, corporate training has important effects on human capital. Global companies spend over $130 billion a year on corporate training—nearly double the estimated $70 74 75 76 77 78 79 80 81 82 FIGURE 11.14 Postsecondary Spending In 2012, among OECD
- 30. countries, the United States spent the most per student on postsecondary education. Source: “Education Expenditures by Country,” National Center for Education Statistics, Institute of Education Sciences, May 2017, http://nces.ed.gov/programs/coe/indicator_cmd.asp. ManpowerGroup conducts surveys of global business leaders each year to ask them questions about hiring global talent. According to the 2016 survey, 40 percent of the 42,000 participating employers indicated they were facing a skills shortage, or having difficulty finding people with the right skills to fill vacant positions. The survey reaches companies in forty-three countries, so this is not a localized effect. Basic skills like reading, writing, and math are not the problem; rather, specific skills like mobile app design, nursing, and sales are in short supply. This skill shortage is particularly acute in Japan, where 83 percent of employers report having trouble. Some economists argue that a skills shortage should not exist because the unemployed would just move to fill the jobs, but others are quick to point out that those currently unemployed simply do not have the skill sets needed for the available jobs, and in many countries laws prohibit those who do have the skills from immigrating to the country. For instance, given the United Kingdom's 2016 decision to leave the EU (“Brexit”), many are fearful that the skills shortage in the United Kingdom will increase. Students at a university in Seoul, South Korea, come from across the world—Brazil, Kenya, Pakistan, India, Nigeria, Turkey, Romania, Vietnam, and other countries— because their own countries faced severe skills shortages. Samsung recognized the skills shortages in these
- 31. countries when it tried to find people who could run its global electronics operations. To combat the shortage, the company recruited the brightest undergraduate students from their home countries and gave them scholarships to study for an MBA in Korea. Upon graduation, the students would work for Samsung in Korea for a couple of years to further refine their skills. After that time, they would return to their home countries with all the skills to lead Samsung's businesses in these markets. This solution was effective for a time, but it was expensive for Samsung. Worse still, the newly trained employees were often hired away by other global companies in the local markets—after all, they were often some of the most skilled employees in their country. While most countries provide primary education for the majority of their populations, the quality of this education varies greatly. India operates the largest education system in the world, and that alone brings many challenges. Often, schools lack basic resources such as desks, books, and even teachers. In response, despite the availability of public education, roughly 40 percent of families choose to send their children to private schools—even though private education represents a significant cost to the family. This trend is common throughout Asia. In Japan, Singapore, and Korea, families commonly invest heavily in private education, sending their children to after-school classes for math, English, and the sciences. After- school classes are so aggressive and competitive in Korea that the government instituted laws requiring schools to close at 10 p.m. and not start again before 6 a.m. Corporate Training and Development In addition to the level of education within a country, corporate
- 32. training has important effects on human capital. Global companies spend over $130 billion a year on corporate training—nearly double the estimated $70 74 75 76 77 78 79 80 81 82 https://edugen.wileyplus.com/edugen/lti/main.uni 2020/6/10 17;38 第 2 ⻚⻚(共 4 ⻚⻚) Global companies spend over $130 billion a year on corporate training—nearly double the estimated $70 billion spent on public education in the U.S. alone. This training is designed to develop a range of skills such as leadership, negotiation, and sales. Many global companies have formal leadership development programs that recruit employees into two- to four-year rotational programs with opportunities to learn different facets of
- 33. the company. MetLife, GE, IBM, and many others offer such programs across a host of functional areas, including global human resources, global supply chain, global leadership, and global marketing. In addition to these longer formal programs, most global companies offer skill-based training, much of which takes advantage of new technologies by moving online. New companies such as edX, Coursera, and Udemy offer classes for people around the globe. The use of virtual technologies has shifted corporate training closer to employees and has made it more hands-on. In addition to providing internal corporate training, some companies partner with employers and employees to identify the skills lacking in the labor market and then develop those skills, working directly with individuals to build them. For instance, LabourNet is a service in India with a mission to provide training and skill development to workers who are not in formal jobs, with a goal of providing vocational training to 1 million workers. Industry, Education, and Government The quality of the human capital infrastructure is influenced not only by the level of education and training available in countries but also by the level of collaboration and coordination among companies, educational institutions, and government agencies. Global industries struggle when companies don't work with universities to determine current and future needs, when universities and governments don't work together on research and development, and when industry and government fail to set priorities and agendas. When companies, universities, and governments work together, however, they can build world-class opportunities. For instance,
- 34. Germany successfully cultivated a booming synthetic dye industry by bringing together companies' resources, universities' research, and the government's money. Similarly, Silicon Valley in California became a world-class center for technology by bringing together academics from Stanford and Berkley, including tech firms from the Valley, and gaining government support from nearby municipalities. The city of Tel Aviv, Israel, sought to replicate the Silicon Valley model by combining government support, educational resources, and business forces to create a tech hub. The government requires all men and women to join the Israeli army and puts the brightest in high-tech intelligence units such as its famous Unit 8200, where it trains them on cutting-edge technologies and encourages them to pursue tech opportunities after their two- year military service. The businesses of the country also spend the most per capita on research and development. Finally, universities in Israel provide world-class programs, particularly in engineering and information technology. The combination of these forces has resulted in an abundance of tech start-ups that have created significant economic growth. On the other hand, where governments, industries, or educational institutions are not supportive and do not work together, businesses are forced to develop or find resources on their own, narrowing the margins for success. One of the key organizations that can bring firms, universities, and governments together is a “business incubator.” A business incubator is a company that helps found and grow new businesses. It provides new companies with space, tools, and leadership skills to help
- 35. accelerate their early growth. For instance, MIT has created an organization called the Global Startup Lab (GSL), which provides resources to undergraduate students from emerging markets. In addition to providing resources directly to students, the GSL partners with institutions such as governments, businesses, and universities in emerging markets, with the goal of helping students develop commercial opportunities. 83 84 85 86 87 88 89 90 91 92 93 Concept Check 11.3 ! " Question 1 of 3 NEXT NEXT Question 1
- 36. Digital technology infrastructure includes: Global companies spend over $130 billion a year on corporate training—nearly double the estimated $70 billion spent on public education in the U.S. alone. This training is designed to develop a range of skills such as leadership, negotiation, and sales. Many global companies have formal leadership development programs that recruit employees into two- to four-year rotational programs with opportunities to learn different facets of the company. MetLife, GE, IBM, and many others offer such programs across a host of functional areas, including global human resources, global supply chain, global leadership, and global marketing. In addition to these longer formal programs, most global companies offer skill-based training, much of which takes advantage of new technologies by moving online. New companies such as edX, Coursera, and Udemy offer classes for people around the globe. The use of virtual technologies has shifted corporate training closer to employees and has made it more hands-on. In addition to providing internal corporate training, some companies partner with employers and employees to identify the skills lacking in the labor market and then develop those skills, working directly with individuals to build them. For instance, LabourNet is a service in India with a mission to provide training and skill development to workers who are not in formal jobs, with a goal of providing vocational training to 1 million workers. Industry, Education, and Government The quality of the human capital infrastructure is influenced not
- 37. only by the level of education and training available in countries but also by the level of collaboration and coordination among companies, educational institutions, and government agencies. Global industries struggle when companies don't work with universities to determine current and future needs, when universities and governments don't work together on research and development, and when industry and government fail to set priorities and agendas. When companies, universities, and governments work together, however, they can build world-class opportunities. For instance, Germany successfully cultivated a booming synthetic dye industry by bringing together companies' resources, universities' research, and the government's money. Similarly, Silicon Valley in California became a world-class center for technology by bringing together academics from Stanford and Berkley, including tech firms from the Valley, and gaining government support from nearby municipalities. The city of Tel Aviv, Israel, sought to replicate the Silicon Valley model by combining government support, educational resources, and business forces to create a tech hub. The government requires all men and women to join the Israeli army and puts the brightest in high-tech intelligence units such as its famous Unit 8200, where it trains them on cutting-edge technologies and encourages them to pursue tech opportunities after their two- year military service. The businesses of the country also spend the most per capita on research and development. Finally, universities in Israel provide world-class programs, particularly in engineering and information technology. The combination of these forces has resulted in an abundance of tech start-ups that have created significant economic growth.
- 38. On the other hand, where governments, industries, or educational institutions are not supportive and do not work together, businesses are forced to develop or find resources on their own, narrowing the margins for success. One of the key organizations that can bring firms, universities, and governments together is a “business incubator.” A business incubator is a company that helps found and grow new businesses. It provides new companies with space, tools, and leadership skills to help accelerate their early growth. For instance, MIT has created an organization called the Global Startup Lab (GSL), which provides resources to undergraduate students from emerging markets. In addition to providing resources directly to students, the GSL partners with institutions such as governments, businesses, and universities in emerging markets, with the goal of helping students develop commercial opportunities. 83 84 85 86 87 88 89 90
- 39. 91 92 93 Concept Check 11.3 ! " Question 1 of 3 NEXT NEXT Question 1 Digital technology infrastructure includes: https://edugen.wileyplus.com/edugen/lti/main.uni 2020/6/10 17;38 第 3 ⻚⻚(共 4 ⻚⻚) Copyright © 2018 by John Wiley & Sons, Inc. All rights reserved. Question Attempts: 0 of 1 used CHECK ANSWER Communication technologies Internet technologies All of these Data technologies Copyright © 2018 by John Wiley & Sons, Inc. All rights reserved.
- 40. Question Attempts: 0 of 1 used CHECK ANSWER Communication technologies Internet technologies All of these Data technologies https://edugen.wileyplus.com/edugen/lti/main.uni 2020/6/10 17;38 第 4 ⻚⻚(共 4 ⻚⻚) Morris, International Business, 1e Help | System Announcements DOWNLOADABLE eTEXTBOOK PRINTER VERSION CHAPTER RESOURCES Reading Content Introduction 11.1 Technology as Physical Infrastructure 11.2 Technology of Information Infrastructure 11.3 Technology of Human Infrastructure 11.4 Technology Trends in International Business Summary and Case ORION: Build your
- 41. Proficiency Videos Animations Multimedia Study Tools Business Hot Topics COURSE RESOURCES Career Center Business Hot Topics Videos Animations PRACTICE Chapter 11 Reading Quiz APPENDIX Animation: Technology InfrastructureAnimation: Technology Infrastructure 11.2 Technology of Information Infrastructure LEARNING OBJECTIVE Identify the way information infrastructure creates business opportunities. UPS estimates that it saves nearly 1 million gallons of gas each year across North America just by using mapping technology that minimizes left turns (drivers turning left risk being delayed by oncoming traffic). The mapping system has also eliminated millions of miles of travel by matching packages, delivery times, and truck
- 42. locations in order to optimize routes and maximize delivery densities. tracking this data in real time and running complex analytics, the firm is able to improve efficiency, thereby saving time and money. Digital technologies make this possible (see Figure 11.7). FIGURE 11.7 Assessing the level of information infrastructure in countries The information infrastructure consists of communication technologies and information technologies such as data storage and processing. In a similar way, the country Estonia uses digital technology to run many government operations. Estonia began the process of digitizing its operations in 1997. The system now enables citizens to register vehicles, file health insurance claims, and even vote, all through an electronic platform called X-Road. The system is so successful that over 900 agencies—some global, including energy, telecom, and banking—offer services through the site. Because of the boost in efficiency, the platform saves an estimated five days a year per citizen by eliminating trips to government offices by both citizens and businesses, which can access information such as land deeds. The efficiency of the system adds 7 million workdays to the Estonian economy. For instance, in Estonia taxes can be filed in five minutes using prefilled, auto-generated reports; by contrast, most Germans hire tax consultants to help them fill out tax forms and spend hours on
- 43. the process. Digital infrastructure like the Internet can also help international businesses improve their communication networks, data storage, and information processing, as we'll see next. Communication Technologies Changes in communication technologies can dramatically affect international business opportunities. For example, even in Brazil's 41 42 DOWNLOADABLE eTEXTBOOK PRINTER VERSION CHAPTER RESOURCES Reading Content Introduction 11.1 Technology as Physical Infrastructure 11.2 Technology of Information Infrastructure 11.3 Technology of Human Infrastructure 11.4 Technology Trends in International Business Summary and Case ORION: Build your Proficiency Videos Animations
- 44. Multimedia Study Tools Business Hot Topics COURSE RESOURCES Career Center Business Hot Topics Videos Animations PRACTICE Chapter 11 Reading Quiz APPENDIX Animation: Technology InfrastructureAnimation: Technology Infrastructure 11.2 Technology of Information Infrastructure LEARNING OBJECTIVE Identify the way information infrastructure creates business opportunities. UPS estimates that it saves nearly 1 million gallons of gas each year across North America just by using mapping technology that minimizes left turns (drivers turning left risk being delayed by oncoming traffic). The mapping system has also eliminated millions of miles of travel by matching packages, delivery times, and truck locations in order to optimize routes and maximize delivery densities. tracking this data in real time and running complex analytics, the firm is able to improve efficiency, thereby saving time and
- 45. money. Digital technologies make this possible (see Figure 11.7). FIGURE 11.7 Assessing the level of information infrastructure in countries The information infrastructure consists of communication technologies and information technologies such as data storage and processing. In a similar way, the country Estonia uses digital technology to run many government operations. Estonia began the process of digitizing its operations in 1997. The system now enables citizens to register vehicles, file health insurance claims, and even vote, all through an electronic platform called X-Road. The system is so successful that over 900 agencies—some global, including energy, telecom, and banking—offer services through the site. Because of the boost in efficiency, the platform saves an estimated five days a year per citizen by eliminating trips to government offices by both citizens and businesses, which can access information such as land deeds. The efficiency of the system adds 7 million workdays to the Estonian economy. For instance, in Estonia taxes can be filed in five minutes using prefilled, auto-generated reports; by contrast, most Germans hire tax consultants to help them fill out tax forms and spend hours on the process. Digital infrastructure like the Internet can also help international businesses improve their communication networks,
- 46. data storage, and information processing, as we'll see next. Communication Technologies Changes in communication technologies can dramatically affect international business opportunities. For example, even in Brazil's 41 42 https://edugen.wileyplus.com/edugen/lti/main.uni 2020/6/10 17;38 第 1 ⻚⻚(共 6 ⻚⻚) Changes in communication technologies can dramatically affect international business opportunities. For example, even in Brazil's poorest favelas (slums), satellite TV and even Internet access are nearly ubiquitous (Figure 11.8). Because nearly all consumers have access to media, international companies like Samsung, LG, and Apple can market their electronics to global customers. Companies can launch products in new markets more quickly and efficiently when they can harness global media. FIGURE 11.8 Satellite TV antennae on the houses of Brazil's poorest neighborhoods Nearly 43 percent of people on the planet have access to the Internet. In the OECD countries, mobile broadband is used by more than
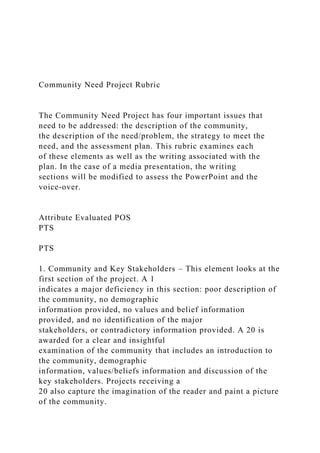
- 47. 95% of the population. This is 1.27 billion people with access to the Internet. Japan has the highest level of access to the Internet of any country in the world, with close to 150 mobile broadband subscriptions per 100 people. In other words, almost half of the Japanese people have more than one broadband subscription. The numbers are almost as high in Finland as well (see Figure 11.9 States primarily relies on DSL and cable, whereas in Japan, fiber-optic networks dominate the country. There are now more than 7 billion cellular subscriptions worldwide—that is almost one for every man, woman, and child alive today—and 95 percent of the world's population is covered by a cellular network. FIGURE 11.9 Mobile Broadband, by country, 2016 Source: Andrew Burger, February 2017, “OECD Mobile Broadband Penetration Rises to 95%, Now Reaches 1.2 Billion,” Telecompetitor. http://www.telecompetitor.com/oecd-mobile- broadband-penetration-rises-to-95-percent-now-reaches-1-2- billion/ This statistic highlights the need for international business managers to understand how such nearly universal connectivity affects them. In rural fishing villages in India, for instance, economists recorded the market price that fishermen received for their daily catch before and after the introduction of phones in three separate markets. Look at Figure 11.10; you can see on the left side of each chart that the price of the daily catch varied significantly up and down in each market. Once phones were introduced in these markets, fishermen were
- 48. 43 44 Changes in communication technologies can dramatically affect international business opportunities. For example, even in Brazil's poorest favelas (slums), satellite TV and even Internet access are nearly ubiquitous (Figure 11.8). Because nearly all consumers have access to media, international companies like Samsung, LG, and Apple can market their electronics to global customers. Companies can launch products in new markets more quickly and efficiently when they can harness global media. FIGURE 11.8 Satellite TV antennae on the houses of Brazil's poorest neighborhoods Nearly 43 percent of people on the planet have access to the Internet. In the OECD countries, mobile broadband is used by more than 95% of the population. This is 1.27 billion people with access to the Internet. Japan has the highest level of access to the Internet of any country in the world, with close to 150 mobile broadband subscriptions per 100 people. In other words, almost half of the Japanese people have more than one broadband subscription. The numbers are almost as high in Finland as well (see Figure 11.9 States primarily relies on DSL and cable, whereas in Japan, fiber-optic networks dominate the country. There are now more than 7 billion cellular subscriptions worldwide—that is almost one for every man, woman, and child alive today—and 95 percent of the world's
- 49. population is covered by a cellular network. FIGURE 11.9 Mobile Broadband, by country, 2016 Source: Andrew Burger, February 2017, “OECD Mobile Broadband Penetration Rises to 95%, Now Reaches 1.2 Billion,” Telecompetitor. http://www.telecompetitor.com/oecd-mobile- broadband-penetration-rises-to-95-percent-now-reaches-1-2- billion/ This statistic highlights the need for international business managers to understand how such nearly universal connectivity affects them. In rural fishing villages in India, for instance, economists recorded the market price that fishermen received for their daily catch before and after the introduction of phones in three separate markets. Look at Figure 11.10; you can see on the left side of each chart that the price of the daily catch varied significantly up and down in each market. Once phones were introduced in these markets, fishermen were 43 44 https://edugen.wileyplus.com/edugen/lti/main.uni 2020/6/10 17;38 第 2 ⻚⻚(共 6 ⻚⻚) price of the daily catch varied significantly up and down in each market. Once phones were introduced in these markets, fishermen were able to compare prices efficiently with other fishermen, and
- 50. prices quickly converged (notice the large price discrepancies on the left side of each chart). That is, prices now varied within a much smaller range than before, because fishermen were able to verify the actual market price. The power of connectivity helped the fishermen better understand their markets, price their catch properly, and earn more money. This study demonstrates an effect that has been witnessed around the world: when more communication is available, information flows more freely, and producers and consumers all benefit. FIGURE 11.10 The price of fish in rural India before and after cell phones were introduced Source: Robert Jensen, “The Digital Provide: Information (Technology), Market Performance and Welfare in the South Indian Fisheries Sector,” Quarterly Journal of Economics 122, no. 3 (2007): 879–924. Speed of the Internet Not only is global access to the Internet increasing, but the speed of the Internet itself is also increasing. As Figure 11.11 the global Internet runs on average at 5.6 Mbps, but in Korea— which boasts the world's fastest Internet—the average speed is 21.1 Mbps. By contrast, much of Africa has Internet speeds less than 2 Mbps. This discrepancy means that a web page will load ten times faster in Korea than in most parts of Africa. 45 46
- 51. 47 price of the daily catch varied significantly up and down in each market. Once phones were introduced in these markets, fishermen were able to compare prices efficiently with other fishermen, and prices quickly converged (notice the large price discrepancies on the left side of each chart). That is, prices now varied within a much smaller range than before, because fishermen were able to verify the actual market price. The power of connectivity helped the fishermen better understand their markets, price their catch properly, and earn more money. This study demonstrates an effect that has been witnessed around the world: when more communication is available, information flows more freely, and producers and consumers all benefit. FIGURE 11.10 The price of fish in rural India before and after cell phones were introduced Source: Robert Jensen, “The Digital Provide: Information (Technology), Market Performance and Welfare in the South Indian Fisheries Sector,” Quarterly Journal of Economics 122, no. 3 (2007): 879–924. Speed of the Internet Not only is global access to the Internet increasing, but the speed of the Internet itself is also increasing. As Figure 11.11 the global Internet runs on average at 5.6 Mbps, but in Korea— which boasts the world's fastest Internet—the average speed is 21.1 Mbps. By contrast, much of Africa has Internet speeds less than 2 Mbps. This discrepancy means that a web page will load ten times
- 52. faster in Korea than in most parts of Africa. 45 46 47 https://edugen.wileyplus.com/edugen/lti/main.uni 2020/6/10 17;38 第 3 ⻚⻚(共 6 ⻚⻚) FIGURE 11.11 The speed of the Internet in each country in 2015 Source: “Internet Speeds by Country (Mbps),” Fastmetrics www.fastmetrics.com/internet-connection-speed-by-country.php (accessed July 18, 2017). The implications of Internet speed are more than simple inconvenience for people who have slower access. Companies operating in global markets need to consider the local Internet speed when designing content for their Internet presence. For example, embedding a video testimonial on a website might be effective in Japan, where download speeds are high, but less effective in India, where speeds are slow. Peer-to-Peer and the Shared Economy Another significant change stemming from the rise of the digital infrastructure is the emergence of peer-to-peer (P2P) transactions in a virtual marketplace that is sometimes referred to as the “shared economy.” A shared economy, also called collaborative
- 53. consumption or the peer economy, is a system in which owners rent to strangers something they are not using, such as a room, a car, or even a service, using peer-to-peer services. Constant connectivity and access saturation have enabled people, especially in industrialized nations, to rent their goods and services directly to other people. Hotels, car rental agencies, and even banks have experienced some unexpected competition from the shared economy. For instance, the world's largest renter of rooms is not technically a hotel; it's the lodgings broker Airbnb, which matches individuals willing to rent out space in their own homes to people who want to rent that space. Airbnb's online market for lodgings in private residences boasts over 1.5 million listings around the globe. The average Airbnb host in New York City earned more than $5,000 in 2016. But in some markets such as San Francisco and New York City, the company faces laws that make renting out rooms illegal unless the renters register with the city. Similarly, Turo, a car-sharing service, enables individuals in the United States and Canada to rent their cars to others. The service matches car owners with prospective renters. Turo then offers insurance to protect the car owner and detailed reviews to protect the renter. People can even “share” their money now. Those who need money go to the appropriate P2P site, enter the amount they would like to
- 54. borrow, name the terms, and include details of their employment, location, and other personal information. Lenders from around the globe agree to loan the money at a certain rate. If both parties agree, the deal is completed and the P2P lender, such as Bitbond, Prosper, Upstart, or SoFi, receives a fee between 1 and 5 percent of the loan. The loans can be used to consolidate debt, buy a car, or remodel a house. The P2P phenomenon is not limited to developed markets. Taobao is a Chinese global market platform similar to eBay, bringing buyers and sellers together in both an auction and a fixed-priced model. The company's site is one of the world's most visited and has over 7 million sellers posting over a billion products. Taobao is so large that it represents over 80 percent of online commerce in China and is growing quickly abroad. Similarly, Yu'ebau is changing China's financial industry by paying interest on money left in people's Taobao Alipay accounts. Alipay is Taobao's payment system, similar to PayPal. With a simple click of a button, users can transfer money from their online account to an attached savings account, where they can earn interest. In just 3 years, the service has accumulated over $60 billion. Data Storage and Processing Technologies 48 49
- 55. 50 51 52 53 FIGURE 11.11 The speed of the Internet in each country in 2015 Source: “Internet Speeds by Country (Mbps),” Fastmetrics www.fastmetrics.com/internet-connection-speed-by-country.php (accessed July 18, 2017). The implications of Internet speed are more than simple inconvenience for people who have slower access. Companies operating in global markets need to consider the local Internet speed when designing content for their Internet presence. For example, embedding a video testimonial on a website might be effective in Japan, where download speeds are high, but less effective in India, where speeds are slow. Peer-to-Peer and the Shared Economy Another significant change stemming from the rise of the digital infrastructure is the emergence of peer-to-peer (P2P) transactions in a virtual marketplace that is sometimes referred to as the “shared economy.” A shared economy, also called collaborative consumption or the peer economy, is a system in which owners rent to strangers something they are not using, such as a room, a car, or even a service, using peer-to-peer services. Constant connectivity and access
- 56. saturation have enabled people, especially in industrialized nations, to rent their goods and services directly to other people. Hotels, car rental agencies, and even banks have experienced some unexpected competition from the shared economy. For instance, the world's largest renter of rooms is not technically a hotel; it's the lodgings broker Airbnb, which matches individuals willing to rent out space in their own homes to people who want to rent that space. Airbnb's online market for lodgings in private residences boasts over 1.5 million listings around the globe. The average Airbnb host in New York City earned more than $5,000 in 2016. But in some markets such as San Francisco and New York City, the company faces laws that make renting out rooms illegal unless the renters register with the city. Similarly, Turo, a car-sharing service, enables individuals in the United States and Canada to rent their cars to others. The service matches car owners with prospective renters. Turo then offers insurance to protect the car owner and detailed reviews to protect the renter. People can even “share” their money now. Those who need money go to the appropriate P2P site, enter the amount they would like to borrow, name the terms, and include details of their employment, location, and other personal information. Lenders from around the globe agree to loan the money at a certain rate. If both parties agree, the deal is completed and the P2P lender, such as
- 57. Bitbond, Prosper, Upstart, or SoFi, receives a fee between 1 and 5 percent of the loan. The loans can be used to consolidate debt, buy a car, or remodel a house. The P2P phenomenon is not limited to developed markets. Taobao is a Chinese global market platform similar to eBay, bringing buyers and sellers together in both an auction and a fixed-priced model. The company's site is one of the world's most visited and has over 7 million sellers posting over a billion products. Taobao is so large that it represents over 80 percent of online commerce in China and is growing quickly abroad. Similarly, Yu'ebau is changing China's financial industry by paying interest on money left in people's Taobao Alipay accounts. Alipay is Taobao's payment system, similar to PayPal. With a simple click of a button, users can transfer money from their online account to an attached savings account, where they can earn interest. In just 3 years, the service has accumulated over $60 billion. Data Storage and Processing Technologies 48 49 50 51
- 58. 52 53 https://edugen.wileyplus.com/edugen/lti/main.uni 2020/6/10 17;38 第 4 ⻚⻚(共 6 ⻚⻚) Data Storage The Rise of Global Data Centers Increased Processing Power Access to Data Data Storage and Processing Technologies In addition to the explosion of information that is dramatically affecting international business opportunities, the cost of gathering and using information has decreased dramatically. As a result, the store of global data has increased exponentially. Thirty years ago, computer systems like the Atari 1040ST helped bring about the personal computing revolution. The Atari was a wonder of its time and could store up to 360 kilobytes of data. Today, most users don't even know how much storage their computers have—the amount is so large it is almost irrelevant. Such large data stores are the result of the cost of data storage decreasing exponentially over the past sixty years. In 1960, one megabyte of data storage, enough to store about 870 pages of plain text, costed about $4,000. In 1994 the cost had fallen to $1, and
- 59. by 2010 it was a mere thousandth of a cent. For international businesses, this means that data about customers, inventory, suppliers, and everything else can and does grow at an exponential rate. The BBC estimates that about 2.5 exabytes, or 2.5 billion gigabytes, are created every day; that's the equivalent of 960 trillion pages of plain text. Experts estimate that 40 zettabytes (40 trillion gigabytes) of data will have been created by 2020. Companies are bursting with data, and many are using it to improve operations and interactions. For instance, Shell Oil Company now integrates millions of observations obtained when its crews are looking for oil and gas to determine how much is present and how easy recovering it will likely be. However, this explosion of information has challenges of its own. As economist Herbert Simon predicted over fifty years ago, global leaders today face a hard limit on their ability to use all available data. Simon noted, “In an information-rich world, the wealth of information means a dearth of something else: a scarcity of whatever it is that information consumes. What information consumes is rather obvious: it consumes the attention of its recipients. Hence, a wealth of information creates a poverty of attention and a need to allocate that attention efficiently among the overabundance of information sources that might consume it.” This information explosion has global leaders feeling overloaded in a flood of information. Indeed this problem affects not only leaders of organizations; a 2015
- 60. study by Fortune found that 65–76 percent of companies struggle with employees who feel overwhelmed. With the creation of so much data, global companies have emerged to help companies securely store their data either on-site, in remote data centers, or in “cloud-based” storage options. For instance, Interxion is a pan- European data storage company with 42 data centers in 12 countries. Its nondescript London location is tucked away in the remains of an old brewery. But inside is a state-of-the-art, high-security data center conveniently close to London's financial companies. These firms could save money by using a center outside London rather than one right in the heart of the city, but the milliseconds required to send and retrieve the data from a more distant location would slow the time- sensitive trades they make. As the pace of business increases, even the smallest fraction of a second can mean the creation or loss of a fortune. As the cost of data storage has been reduced, the importance of the ability to process data has increased. In 1965, Gordon Moore, a cofounder of Intel, suggested that processing power—measured by the number of transistors that amplify or switch signals and electrical power on a microchip— would double every 24 months. This prediction has become known as Moore's law, and so far it has proven to be largely true. Processing power has increased by 3,500 times over the past fifty years, even as the cost has come down.
- 61. Energy use in microchips is 90,000 times more efficient today than in 1965, and the price per transistor has decreased by a factor of 60,000 over the same period. While these improvements have fueled many innovations—such as smartphones and tablets— some argue that the trend predicted by Moore's law has reached its limit. Horst Simon, the deputy director of Lawrence Berkeley National Laboratory, is among those who say our need for computing power may have plateaued. As a result, while Intel has led the pack in driving innovation, companies in Taiwan, Korea, and China are capturing an increasingly large share of the memory chip market by producing chips that are cheaper because they are sufficient for most purposes. Another major hurdle for international business today is ensuring access to critical data. In the past, companies kept their own data on site in order to maintain integrity and security. However, keeping data in-house makes it more difficult for an increasingly mobile workforce to access. For that reason, companies are moving to cloud-based solutions. In the United States, Amazon, Google, Microsoft, and others offer cloud-based hosting for data from hundreds of global companies via remote data centers with more than a million servers to handle the flow of the data. Spotify, the Swedish music streaming company, uses Google to host its music streaming services. Netflix uses Amazon's twelve regions to stream films to global markets. important advantage for global business is that cloud-based solutions enable companies to quickly take their electronic
- 62. content global. For instance, Amazon has existing infrastructure in the United States, Canada, Brazil, the European Union, India, Singapore, Australia, China, Korea, and Japan. The company's services span thirty- five of the world's thirty-eight time zones. Thanks to cloud- based applications, Amazon's data centers in India can host the same business processes as those in the United States. Despite the availability of data, a persistent challenge faced by global firms is sharing knowledge across country boundaries. Global 54 55 57 58 59 60 61 62 63 64 65
- 63. 66 67 69 Data Storage The Rise of Global Data Centers Increased Processing Power Access to Data Data Storage and Processing Technologies In addition to the explosion of information that is dramatically affecting international business opportunities, the cost of gathering and using information has decreased dramatically. As a result, the store of global data has increased exponentially. Thirty years ago, computer systems like the Atari 1040ST helped bring about the personal computing revolution. The Atari was a wonder of its time and could store up to 360 kilobytes of data. Today, most users don't even know how much storage their computers have—the amount is so large it is almost irrelevant. Such large data stores are the result of the cost of data storage decreasing exponentially over the past sixty years. In 1960, one megabyte of data storage, enough to store about 870 pages of plain text, costed about $4,000. In 1994 the cost had fallen to $1, and by 2010 it was a mere thousandth of a cent. For international businesses, this means that data about customers, inventory, suppliers, and everything else can and
- 64. does grow at an exponential rate. The BBC estimates that about 2.5 exabytes, or 2.5 billion gigabytes, are created every day; that's the equivalent of 960 trillion pages of plain text. Experts estimate that 40 zettabytes (40 trillion gigabytes) of data will have been created by 2020. Companies are bursting with data, and many are using it to improve operations and interactions. For instance, Shell Oil Company now integrates millions of observations obtained when its crews are looking for oil and gas to determine how much is present and how easy recovering it will likely be. However, this explosion of information has challenges of its own. As economist Herbert Simon predicted over fifty years ago, global leaders today face a hard limit on their ability to use all available data. Simon noted, “In an information-rich world, the wealth of information means a dearth of something else: a scarcity of whatever it is that information consumes. What information consumes is rather obvious: it consumes the attention of its recipients. Hence, a wealth of information creates a poverty of attention and a need to allocate that … Morris, International Business, 1e Help | System Announcements DOWNLOADABLE eTEXTBOOK CHAPTER RESOURCES
- 65. Reading Content Introduction 11.1 Technology as Physical Infrastructure 11.2 Technology of Information Infrastructure 11.3 Technology of Human Infrastructure 11.4 Technology Trends in International Business Summary and Case ORION: Build your Proficiency Videos Animations Multimedia Study Tools Business Hot Topics COURSE RESOURCES Career Center Business Hot Topics Videos Animations PRACTICE Chapter 11 Reading Quiz APPENDIX 11.1 Technology as Physical Infrastructure LEARNING OBJECTIVE
- 66. Assess the impact of physical infrastructure on international business opportunities Beginning with the inventions of the wheel, irrigation, and writing, technological improvements have been responsible for countless changes to the way we live and trade. For global business leaders, knowing how to understand, evaluate, and harness technological trends at the global and country levels is an increasingly important skill. In this chapter, we introduce a framework to help you understand the impact of technology and technological changes on the global enterprise and how global leaders can capitalize on these opportunities. This framework consists of physical infrastructure, information infrastructure, and human infrastructure (see Figure 11.1). FIGURE 11.1 Assessing the level of physical infrastructure Physical Infrastructure includes raw materials, manufacturing equipment, transportation networks, and energy resources. International businesses must consider an important factor: the level of physical infrastructure present in a given country. Countries with low levels of physical infrastructure may be less attractive to international businesses because producing and distributing goods and services are often difficult. Countries with high levels of physical infrastructure, however, present fewer challenges for international businesses. The physical infrastructure includes elements such as the availability of raw materials like plastics, metals, and minerals; the availability of machinery and equipment like weaving looms for textiles, precision
- 67. weighing and mixing equipment for pharmaceuticals, and metal stamping and welding equipment for automobiles; transportation networks that enable goods to move between producers and customers; and the energy resources that provide power to producers and consumers alike. Key questions for assessing the physical infrastructure are shown in Figure For instance, when Hindustan Unilever—a global seller of soaps, shampoos, and lotions—sought to move from urban cities to rural towns in India, it quickly recognized a problem. Competition was fierce in urban India, but while the country had over a billion potential customers, getting products to the half who lived in rural villages would be exceptionally challenging because of the country's undeveloped physical infrastructure. The lack of roads made transportation burdensome, the very small number of large retail stores made distribution channels difficult to establish, and a general lack of information made monitoring the distribution process nearly impossible. In assessing the physical infrastructure of a market, global leaders need to consider a host of factors, including access to raw materials, manufacturing capabilities and techniques, transportation networks, and energy resources. Raw Materials 4 DOWNLOADABLE eTEXTBOOK CHAPTER RESOURCES
- 68. Reading Content Introduction 11.1 Technology as Physical Infrastructure 11.2 Technology of Information Infrastructure 11.3 Technology of Human Infrastructure 11.4 Technology Trends in International Business Summary and Case ORION: Build your Proficiency Videos Animations Multimedia Study Tools Business Hot Topics COURSE RESOURCES Career Center Business Hot Topics Videos Animations PRACTICE Chapter 11 Reading Quiz APPENDIX 11.1 Technology as Physical Infrastructure LEARNING OBJECTIVE
- 69. Assess the impact of physical infrastructure on international business opportunities Beginning with the inventions of the wheel, irrigation, and writing, technological improvements have been responsible for countless changes to the way we live and trade. For global business leaders, knowing how to understand, evaluate, and harness technological trends at the global and country levels is an increasingly important skill. In this chapter, we introduce a framework to help you understand the impact of technology and technological changes on the global enterprise and how global leaders can capitalize on these opportunities. This framework consists of physical infrastructure, information infrastructure, and human infrastructure (see Figure 11.1). FIGURE 11.1 Assessing the level of physical infrastructure Physical Infrastructure includes raw materials, manufacturing equipment, transportation networks, and energy resources. International businesses must consider an important factor: the level of physical infrastructure present in a given country. Countries with low levels of physical infrastructure may be less attractive to international businesses because producing and distributing goods and services are often difficult. Countries with high levels of physical infrastructure, however, present fewer challenges for international businesses. The physical infrastructure includes elements such as the availability of raw materials like plastics, metals, and minerals; the availability of machinery and equipment like weaving looms for textiles, precision
- 70. weighing and mixing equipment for pharmaceuticals, and metal stamping and welding equipment for automobiles; transportation networks that enable goods to move between producers and customers; and the energy resources that provide power to producers and consumers alike. Key questions for assessing the physical infrastructure are shown in Figure For instance, when Hindustan Unilever—a global seller of soaps, shampoos, and lotions—sought to move from urban cities to rural towns in India, it quickly recognized a problem. Competition was fierce in urban India, but while the country had over a billion potential customers, getting products to the half who lived in rural villages would be exceptionally challenging because of the country's undeveloped physical infrastructure. The lack of roads made transportation burdensome, the very small number of large retail stores made distribution channels difficult to establish, and a general lack of information made monitoring the distribution process nearly impossible. In assessing the physical infrastructure of a market, global leaders need to consider a host of factors, including access to raw materials, manufacturing capabilities and techniques, transportation networks, and energy resources. Raw Materials 4 https://edugen.wileyplus.com/edugen/lti/main.uni 2020/6/10 17;38 第 1 ⻚⻚(共 6 ⻚⻚)
- 71. Ships Raw Materials Raw materials are the basic materials from which goods and components of goods are made. While many raw materials are abundant around the globe—such as the elements oxygen, silicone, aluminum, and iron—others are rare enough that companies' needs for them can influence global business decisions. For instance, many of today's batteries are lithium-ion batteries. Bolivia and Chile control nearly half the world's supply of lithium. This means foreign companies may struggle to gain access to an ample supply. They may not need to move to Chile or Bolivia, but managers of international companies should certainly build healthy trade relationships with Chilean and Bolivian suppliers and governmental officials. Often, governments will use access to raw materials as a source of advantage for their domestic companies. For instance, a RAND Corporation report suggests that China, which controls nearly 90 percent of the world's rare earth elements, charges global electronics firms much higher prices than what domestic Chinese competitors pay for rare earth elements such as lanthanum and cerium, which are often used in electronics (see 11.1). As a result, Chinese electronics firms may have a significant cost advantage in addition to preferred access to critical elements. In addition, China's near monopoly has forced other countries to develop alternative approaches that work around the requirements for
- 72. some elements. For instance, when China cut off sales of rare earth elements to Japan in 2010 during a spat over the fate of Chinese fishermen who were caught fishing in Japanese waters, Japan, among other nations, began seriously investing in finding alternative materials that could substitute for rare earth metals. TA B L E 11 . 1 China's Two-Tiered Pricing of Rare Earth Elements Material International Prices (USD/kg) Chinese Domestic Prices (USD/kg) Lanthanum 66.46 18.28 Cerium 59.31 20.65 Neodymium 244.23 122.76 Praseodymium 209.62 106.94 Samarium 95.31 14.48 Dysprosium 2032.31 1085.35 Europium 3800.00 2228.38 Terbium 2973.85 1767.93 Source: Richard Silberglitt et al., “Critical Materials: Present Danger to U.S. Manufacturing,” RAND National Defense Research Institute, www.rand.org/content/dam/rand/pubs/research_reports/RR100/ RR133/RAND_RR133.pdf.
- 73. Manufacturing Equipment In the past decade, the advances of new manufacturing equipment and techniques have changed many global industries. For instance, horizontal drilling allows vertical wells to twist and turn horizontally for over a mile underground. Coupled with hydraulic fracturing (in which a high-pressure solution is pumped into a well to crack the rock and release nearby pockets of hydrocarbons), this technique has increased production of natural gas from shale gas to more than eight times the rate of any earlier technologies. This capability reduces the bargaining power of OPEC producers, significantly altering the global oil and gas industry. This is just one example of how new technologies can overturn commonly held beliefs in any sector, even manufacturing. Another manufacturing innovation with a dramatic impact on global business is the creation of global manufacturing clusters, suppliers and producers of a given industry in the same geographic location. This proximity facilitates the free flow of ideas, people, and resources between firms and for well-designed hubs often results in global dominance. For instance, in Silicon Valley, tech firms cluster together, attracting talent, investors, and ideas from around the world. Similarly, Italy is the world's center for leather craft and high-end automobiles. center of the fashion industry. South Africa is the center of the world's mining industries. China is the center of the world's garment industry. rules exist that require new businesses to locate near the existing ones in their industry, but new entrants are still likely to benefit from proximity to them.
- 74. Transportation Networks Transportation technologies play a vital role in the success of international businesses. Transportation, whether between production facilities or from supplier to customer, relies on a network that links shipping, air, rail, and road; in the not-too-distant future it may even include delivery drones. Perhaps the most important technological advancement in the transportation industry in the past twenty years has been the invention of the 6 7 9 11 12 13 Ships Raw Materials Raw materials are the basic materials from which goods and components of goods are made. While many raw materials are abundant around the globe—such as the elements oxygen, silicone, aluminum, and iron—others are rare enough that companies' needs for them can influence global business decisions. For instance, many of today's batteries are lithium-ion batteries. Bolivia and Chile control nearly half the world's supply of lithium. This means foreign companies may struggle to gain access to an
- 75. ample supply. They may not need to move to Chile or Bolivia, but managers of international companies should certainly build healthy trade relationships with Chilean and Bolivian suppliers and governmental officials. Often, governments will use access to raw materials as a source of advantage for their domestic companies. For instance, a RAND Corporation report suggests that China, which controls nearly 90 percent of the world's rare earth elements, charges global electronics firms much higher prices than what domestic Chinese competitors pay for rare earth elements such as lanthanum and cerium, which are often used in electronics (see 11.1). As a result, Chinese electronics firms may have a significant cost advantage in addition to preferred access to critical elements. In addition, China's near monopoly has forced other countries to develop alternative approaches that work around the requirements for some elements. For instance, when China cut off sales of rare earth elements to Japan in 2010 during a spat over the fate of Chinese fishermen who were caught fishing in Japanese waters, Japan, among other nations, began seriously investing in finding alternative materials that could substitute for rare earth metals. TA B L E 11 . 1 China's Two-Tiered Pricing of Rare Earth Elements Material International Prices (USD/kg) Chinese Domestic Prices (USD/kg) Lanthanum 66.46 18.28
- 76. Cerium 59.31 20.65 Neodymium 244.23 122.76 Praseodymium 209.62 106.94 Samarium 95.31 14.48 Dysprosium 2032.31 1085.35 Europium 3800.00 2228.38 Terbium 2973.85 1767.93 Source: Richard Silberglitt et al., “Critical Materials: Present Danger to U.S. Manufacturing,” RAND National Defense Research Institute, www.rand.org/content/dam/rand/pubs/research_reports/RR100/ RR133/RAND_RR133.pdf. Manufacturing Equipment In the past decade, the advances of new manufacturing equipment and techniques have changed many global industries. For instance, horizontal drilling allows vertical wells to twist and turn horizontally for over a mile underground. Coupled with hydraulic fracturing (in which a high-pressure solution is pumped into a well to crack the rock and release nearby pockets of hydrocarbons), this technique has increased production of natural gas from shale gas to more than eight times the rate of any earlier technologies. This capability reduces the bargaining power of OPEC producers, significantly altering the global oil and gas industry. This is just one example of how new technologies can overturn commonly held beliefs in any
- 77. sector, even manufacturing. Another manufacturing innovation with a dramatic impact on global business is the creation of global manufacturing clusters, suppliers and producers of a given industry in the same geographic location. This proximity facilitates the free flow of ideas, people, and resources between firms and for well-designed hubs often results in global dominance. For instance, in Silicon Valley, tech firms cluster together, attracting talent, investors, and ideas from around the world. Similarly, Italy is the world's center for leather craft and high-end automobiles. center of the fashion industry. South Africa is the center of the world's mining industries. China is the center of the world's garment industry. rules exist that require new businesses to locate near the existing ones in their industry, but new entrants are still likely to benefit from proximity to them. Transportation Networks Transportation technologies play a vital role in the success of international businesses. Transportation, whether between production facilities or from supplier to customer, relies on a network that links shipping, air, rail, and road; in the not-too-distant future it may even include delivery drones. Perhaps the most important technological advancement in the transportation industry in the past twenty years has been the invention of the 6 7
- 78. 9 11 12 13 https://edugen.wileyplus.com/edugen/lti/main.uni 2020/6/10 17;38 第 2 ⻚⻚(共 6 ⻚⻚) Sea Ports and Canals. Ships Air Transport Perhaps the most important technological advancement in the transportation industry in the past twenty years has been the invention of the standardized shipping container. With ports, shippers, and transportation companies all agreeing to standard twenty-foot and forty-foot designs, ships, trains, and trucks can be loaded and unloaded quickly using standardized equipment. Maersk Line is the world's largest transporter of shipping containers today. It ships goods to and from 115 countries using 600 container vessels. That may not seem like much, but container ships are huge. In 2014, the company introduced the Triple-E (Figure 11.2), the world's largest container ship, which carries 18,000 shipping containers. To put that in perspective, if those containers were lined up end to end, they
- 79. would stretch for sixty miles. Standardization of shipping containers has enabled this kind of specialized ship, which in turn has increased efficiency and reduced costs in the shipping industry. FIGURE 11.2 Maersk's Triple-E The world's largest container ship boasts improved fuel efficiency, reduced emissions, and enormous size. Source: Vitron Trading Ltd. 2017. www.vesseltracking.net/wp- content/uploads/2015/12/final_maersk.jpg Like ships, ports have grown dramatically to keep pace with the demands of global shipping. Shanghai, China, is the world's busiest port, handling the equivalent of more than 15 million forty-foot containers per year. China exports so many goods that it is responsible for six of the ten busiest ports in the world. What does this mean for international businesses? China's investment in transportation makes it relatively easy for global firms to manufacture in China and ship to other markets and for Chinese businesses to export their products abroad. Major technological changes have increased the safety and efficiency of air transportation and air travel; these changes have led to reductions in their cost. The World Bank estimates that the number of air passengers worldwide has increased from around 300,000 per year in 1970 to over 3.4 billion per year in 2015, equating to more than 6 billion passenger-kilometers, or the number of kilometers flown multiplied by the number of passengers on the planes. The relative ease of travel has increased foreign business travel and foreign vacations, but perhaps more
- 80. important, it has also increased the ease of shipping goods as air cargo (see Figure 11.3). With the rise of several global e- commerce sites like Alibaba.com and Amazon.com, international air cargo is set to grow quickly because nearly a third of all e-commerce is from foreign customers who buy goods abroad and have them shipped to their home market. 16 17 18 19 20 22 23 24 25 Sea Ports and Canals. Ships Air Transport Perhaps the most important technological advancement in the transportation industry in the past twenty years has been the invention of the standardized shipping container. With ports, shippers, and
- 81. transportation companies all agreeing to standard twenty-foot and forty-foot designs, ships, trains, and trucks can be loaded and unloaded quickly using standardized equipment. Maersk Line is the world's largest transporter of shipping containers today. It ships goods to and from 115 countries using 600 container vessels. That may not seem like much, but container ships are huge. In 2014, the company introduced the Triple-E (Figure 11.2), the world's largest container ship, which carries 18,000 shipping containers. To put that in perspective, if those containers were lined up end to end, they would stretch for sixty miles. Standardization of shipping containers has enabled this kind of specialized ship, which in turn has increased efficiency and reduced costs in the shipping industry. FIGURE 11.2 Maersk's Triple-E The world's largest container ship boasts improved fuel efficiency, reduced emissions, and enormous size. Source: Vitron Trading Ltd. 2017. www.vesseltracking.net/wp- content/uploads/2015/12/final_maersk.jpg Like ships, ports have grown dramatically to keep pace with the demands of global shipping. Shanghai, China, is the world's busiest port, handling the equivalent of more than 15 million forty-foot containers per year. China exports so many goods that it is responsible for six of the ten busiest ports in the world. What does this mean for international businesses? China's investment in transportation makes it relatively easy for global firms to manufacture in China and ship to other markets and for Chinese businesses to export their products abroad.
- 82. Major technological changes have increased the safety and efficiency of air transportation and air travel; these changes have led to reductions in their cost. The World Bank estimates that the number of air passengers worldwide has increased from around 300,000 per year in 1970 to over 3.4 billion per year in 2015, equating to more than 6 billion passenger-kilometers, or the number of kilometers flown multiplied by the number of passengers on the planes. The relative ease of travel has increased foreign business travel and foreign vacations, but perhaps more important, it has also increased the ease of shipping goods as air cargo (see Figure 11.3). With the rise of several global e- commerce sites like Alibaba.com and Amazon.com, international air cargo is set to grow quickly because nearly a third of all e-commerce is from foreign customers who buy goods abroad and have them shipped to their home market. 16 17 18 19 20 22 23 24
- 83. 25 https://edugen.wileyplus.com/edugen/lti/main.uni 2020/6/10 17;38 第 3 ⻚⻚(共 6 ⻚⻚) Rail and Roads FIGURE 11.3 The rapid growth of air travel and air cargo from 1975 to 2014 Source: Franziska Kupfer et al., “The Underlying Drivers and Future Development of Air Cargo,” Journal of Air Transport Management 61 (June 2017): 6–14, www.sciencedirect.com/science/article/pii/S0969699715301678. Shipping by sea is cheap but slow and limited to coastal ports. Air freight is fast but expensive and limited to regions with established airports. Ground transportation bridges the gap between the two: trucks and trains take the containers shipped over the oceans and move them inland, where much of the world's population lives. In addition, many overland routes exist between countries like Mexico and the United States or Germany and Turkey, and these are best traveled by truck and/or train. Overall, the combination of improvements in shipping, ports, air, rail, and roads has made much of the world more easily and quickly accessible. As Figure 11.4 shows, a few areas are still remote—like the Arctic tundra, the Amazon basin, the Sahara, the Tibetan plateau, Antarctica, and Siberia— but thanks to advanced physical infrastructure, it is fairly easy