
Recomendados
Recomendados
Mais conteúdo relacionado
Mais procurados
Mais procurados (19)
Destaque
Destaque (20)
Semelhante a Physician Dispensing - BRP Pharmaceuticals
Semelhante a Physician Dispensing - BRP Pharmaceuticals (20)
Último
Último (20)
Physician Dispensing - BRP Pharmaceuticals
- 1. National Evaluation of Prescriber Drug Dispensing Mark A. Munger,1,2,* James H. Ruble,1 Scott D. Nelson,1 Lynsie Ranker,3 Renee C. Petty,1 Scott Silverstein,1 Erik Barton,4 and Michael Feehan1 1 Department of Pharmacotherapy, University of Utah, Salt Lake City, Utah; 2 Department of Internal Medicine, University of Utah, Salt Lake City, Utah; 3 The Modellers, LLC, Salt Lake City, Utah; 4 Department of Emergency Medicine, University of Utah, Salt Lake City, Utah OBJECTIVE To describe the legal, professional, and consumer status of prescribers dispensing legend and over-the-counter drugs in the United States. METHODS Legal and academic databases were searched to identify those states that permit prescribers to dispense medications to patients and any limitations on such practice. In addition, prescribers and patients-consumers were surveyed to learn about the prevalence and perceptions of such prac- tice. The use of drug samples was explicitly excluded from the study. MAIN RESULTS Surveys were obtained from 556 physicians, 64 NPs, and 999 patient-consumers of drugs dispensed by prescribers. Forty-four states authorize prescriber dispensing. Midlevel practitio- ners (i.e., NPs and physician assistants) are authorized to dispense in 43 states. Thirty-two states do not require dispensing prescribers to compete additional registration to dispense medications, and 30 states require some level of compliance with pharmacy practice requirements. Prescriber dispens- ing is common, independent of patient age or insurance coverage. Prescriber dispensing appears dri- ven by physician and patient perceptions of convenience and cost reductions. Future dispensing is likely to increase due to consumers’ satisfaction with the practice. Consumer self-reported adverse drug reactions (ADRs) were equivalent between pharmacist- and physician-dispensed drugs, but urgent and emergency clinic ADR consultations were slightly lower with physician dispensing. CONCLUSIONS Prescriber dispensing is firmly entrenched in the U.S. health care system, is likely to increase, does not appear to increase ADRs, and may reduce urgent care and emergency department visits. The reduction in urgent care and emergency department visits requires further study to con- firm these preliminary findings. KEY WORDS legal, public health, prescriber dispensing. (Pharmacotherapy 2014;34(10):1012–1021) doi: 10.1002/phar.1461 Dispensing of medicines has occurred throughout the centuries through a variety of channels. As commonly defined, dispensing means “to prepare and distribute medicines to those who are to use them” or to “to give out medicine and other necessities to the sick, and to fill a medical prescription.”1, 2 This practice has been a role of the medical and pharmacy professions since ancient times and has been under close scrutiny by health care and society throughout the centuries.1 Historically, pre- scriber dispensing rates dropped from 39% of prescribers in 1923 to only 1% in 1986 because the practice was not seen in a favorable light due to ethics, conflict of interest, patient welfare, and economics.3, 4 However, in the last 3 dec- ades, there appears to have been a resurgence in prescriber dispensing rates, although not without controversy.4 This study was presented in part at the 110th Annual Meeting of the National Association Boards of Pharmacy (NABP), May 17–20, 2014, in Phoenix, Arizona. This study was funded by State of Utah No. MP12023 Pharmacy Licensure, Department of Commerce. *Address for correspondence: Mark A. Munger, Univer- sity of Utah, 30 South, 2000 East, Room 105M, Salt Lake City, UT 84112-5820; e-mail: mmunger@hsc.utah.edu. Ó 2014 Pharmacotherapy Publications, Inc. O R I G I N A L R E S E A R C H A R T I C L E S
- 2. The controversy of prescriber dispensing rose to prominence in the 1980s. Many publications focused on physician professional autonomy, conflict of interest, patient acceptance, potential for harm, and economic competition between the medical and pharmacy professions.5–8 Fed- eral and state legislative initiatives were intro- duced for and against nonpharmacist dispensing.9 Additional publications described the professional role separation, practice privi- leges, and the regulatory basis for prescriber dis- pensing.4, 10–12 However, these publications did not offer specific citations to statutory or regula- tory authorization for prescriber dispensing. They also did not systematically address health care providers’ beliefs and behaviors around the practice or consumer perceptions of and reac- tions to this drug-dispensing practice. In 2012, the Utah legislature in association with the Division of Occupational and Profes- sional Licensing initiated an inquiry into the statutory basis and scope of legally authorized prescriber dispensing in the United States. To this end, the three studies reported here were conducted to provide a comprehensive overview of the practice. The objective of the first study was to provide a point-in-time description of state statutes and regulations that do or do not allow prescribers to dispense medications to their patients. The second study was undertaken to understand the reasons, procedures, and per- ceptions of physician and nurse practitioner (NP) dispensing practice versus similar practices of nondispensers of legend and over-the-counter (OTC) drugs in the United States. The objective of the third study was to understand consumer perceptions of physician or NP dispensing of legend and OTC medications across the United States. Methods Study 1: Review of State Statute and Administrative Codes State statute and administrative codes were reviewed to identify those states that permit pre- scribers to dispense medications to patients and any limitations on such practice. Statutory data were collected between October 2012 and Janu- ary 2013. Seven databases were accessed to obtain the statutory and regulatory information. These databases included LexisNexis Academic, National Conference of State Legislatures—Issues and Research, National Association of Boards of Pharmacy (NABP) Survey of Pharmacy Law 2012,13 and Cornell Law School—Legal Informa- tion Institute. Searches were also conducted in PubMed, International Pharmaceutical Abstracts and the Cochrane Library. For each state, online versions of the statutory code (i.e., laws) and administrative code (i.e., regulations) were located. In particular, data mining efforts were focused on state laws and regulations relevant to health professionals. Search terms for state codes to identify relevant sections were physician, den- tist, veterinarian, podiatrist, dispens*, practitioner, registration, label*, nurse practitioner, physician assistant, and non-pharmacist. Websites for the National Board of Medical Examiners14 and NABP15 were used to identify individual state boards of medicine and pharmacy websites, respectively. There are limitations in the data obtained from legal resources. There is substan- tial lack of uniform terminology, and each state does not consistently use the same definitions. Codes may be drafted in proscriptive form, pre- scriptive form, or combinations thereof. These writing styles introduce additional complexity to interpreting scope of authorization. Finally, laws and regulations change frequently, and current statutes and regulations, in particular jurisdic- tions, may not match the data presented. Study 2: Physician and Nurse Practitioner Survey Studies 2 and 3 were conducted in accordance with the International Conference on Harmoni- sation of Technical Requirements for Registra- tion of Pharmaceuticals for Human Use Guidelines for Good Clinical Practice and the Declaration of Helsinki, and they received approval from the University of Utah institu- tional review board. Participants were 556 licensed physicians and 64 NPs from one of the following specialties: optometry, medical oncology or hematology- oncology, plastic or reconstructive surgery, der- matology, primary care (family medicine or gen- eral practice), internal medicine, or psychiatry who indicated that they had or had not dis- pensed a legend or OTC drug in the past 3 months. Participants were recruited from the WorldOne (www.worldone.com, New York, NY) and Universal Survey (www.universalsur- vey.com, New York, NY) panels. Random elec- tronic invitations were sent from September to PRESCRIBER DISPENSING Munger et al 1013
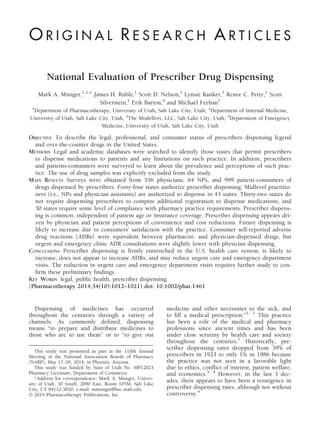
- 3. December 2012. The study was designed to recruit dispensers and nondispensers equally. Dispensing was defined as “having personally sold or given out medication, excluding medica- tion samples.” The use of drug samples was explicitly excluded from the study. A total 1527 responded to the invitation and entered the survey, with 620 qualified to complete the final survey. The survey assessed the level of dispensing among physician dispensers including dispens- ing frequency, drug categories dispensed, and the presence of pharmaceutical dispensing pro- cedures by a 10-point Likert scale where appli- cable, as shown in Tables 1 and 2. Attitudinal questions addressed the perceived importance and burden of each dispensing procedure among dispensers. Physicians/NPs were asked whether their perceived cost of dispensed medications were higher, neutral, or lower compared with the costs from community pharmacies. General attitudes toward dispensing among dispensers and nondispensers were assessed with a 16-item statement battery. Future dispensing intent among dispensers and nondispensers was deter- mined. Study 3: Consumer Survey Consumers were recruited from a separate, commercially available consumer panel operated by Toluna (www.toluna-group.com, Wilton, CT). Random invitations were sent out from September to December 2012. Prescription was defined for the consumer participants as “a med- ication requiring a prescription.” OTC was defined as “a medication you could purchase without a prescription.” The use of drug samples was explicitly excluded from the study. Mini- mum study quotas were set at 100 consumers 65 years or older, 300 without private insurance, and 750 who had purchased a prescription prod- uct from a physician or NP. A total of 9640 entered the survey with 1387 meeting the screening criteria. Of these, 388 were excluded due to incomplete or erroneous responses, for a final sample of 999 participants. In the consumer survey, participants were asked if they had health insurance, whether medications were dispensed following a visit with their prescriber, and in what specialty area the prescriber practices. Patients were also asked about perceived medication costs, future pur- chasing practices over the next 2 years, experi- encing an adverse drug reaction (ADR) when purchased from a physician or NP compared with a pharmacy, and the category of medication dispensed. If the consumer experienced an ADR, they were asked to identify who they consulted to provide medical information or management of the adverse effect. General attitudes toward medications purchased from a physician or NP were assessed with an 11-item statement battery, using a 10-point Likert scale shown in Table 3. Statistical Analysis Statistical analysis was conducted on the sur- vey data only. The 10-point Likert scale items were considered to be continuous variables for analysis,16 and comparisons between dispensers and nondispensers were made using an indepen- dent sample t test. For comparisons of categori- cal outcomes, groups were compared using a v2 test, with separate categories of the outcome var- iable being further compared using a v2 decom- position approach when deemed appropriate. Significance was set at p<0.05. Results Study 1: Review of State Statute and Administrative Codes Appendix 1 presents the references for sec- tions of the statutory and regulatory codes. A total of 44 states authorize unrestricted dispens- ing by legally authorized prescribers, as shown in Figure 1A. Massachusetts, New Jersey, New York, and Texas allow prescriber dispensing of small quantities of medications from 72 hours to 30 days including controlled substances (i.e., Massachusetts only). Montana expressly prohib- its dispensing activities by prescribers; however, the state creates a series of exceptions for unu- sual circumstances, such as rural locations that are geographically isolated from a pharmacy. Midlevel practitioners (i.e., NPs and physician assistants) are allowed to dispense within their respective scope of practice in 38 states, as shown in Figure 1B. Six states exclude midlevel practitioners from dispensing, and six states gen- erally prohibit all nonpharmacist dispensing. In 28 states, there is no requirement for non- pharmacist practitioners to register or notify licensing authorities of their intention to dis- pense medications (Figure 1C). In 16 states, nonpharmacist practitioners must register or notify their respective professional licensing board (e.g., medicine board, dental board, 1014 PHARMACOTHERAPY Volume 34, Number 10, 2014
- 5. podiatric medicine board, etc.) of their dispens- ing practice. However, nonpharmacist dispensers must register with the Nebraska Board of Phar- macy as a “delegated dispenser” and with the New Hampshire Board of Pharmacy as a “limited retail drug distributor.” A registration or formal notification process is required in 16 states, some of which require a separate registration form. Compliance with pharmacy practice require- ments for medication dispensing is required in 26 states (Figure 1D). Examples of compliance requirements include provision of labeling infor- mation, inventory control, and recordkeeping, among others. Eighteen states have no specific requirements for prescribers to comply with pharmacy dispensing requirements. Five states expressly require dispensing prescribers to abide by the same dispensing requirements for phar- macists. Study 2: Physician and Nurse Practitioner Survey The mean age of the physicians/NPs who completed the survey was 49.7 Æ 2.5 years, with dispensers (48.5 Æ 2.7) statistically younger than nondispensers (50.8 Æ 2.5) (p<0.05). Respondents practiced for a mean of 18.2 Æ 1.5 years (17.2 yrs for dispensers and 19.2 yrs for nondispensers). The total popula- tion was 82% white with a significant higher number of whites in the nondispenser group (86% nondispensers vs 79% dispensers; p<0.05). Additionally, approximately 16% of respon- dents were Asian, 10% Pacific Islander, 3–4% Table 3. Dispensing Prescriber’s Perception of Practice, Importance, and Burden of Dispensing Procedures Base size (n=311) Procedures in place, % Perceived importance mean (SD) Perceived burden mean (SD) Proper drug storage (i.e., lighting, temperature, security) 87 8.42 (2.06) 4.66 (2.70) Patient counseling 86 8.35 (2.05) 4.74 (2.64) Prescription and drug purchase record keeping 80 8.11 (2.37) 5.71 (2.76) Drug stock labeling and inventory control 67 7.53 (2.64) 5.64 (2.66) System verification of product prior to dispensing (double-check system) 67 7.87 (2.49) 5.09 (2.67) Prescription labeling 65 7.44 (2.77) 5.38 (2.76) Generic substitution 59 6.56 (2.81) 4.66 (2.78) Medication profile system/dispensing system 53 6.81 (2.93) 5.90 (2.81) U.S. pharmacopeia standard sterile compounding facility 25 4.99 (3.43) 6.58 (3.08) SD = standard deviation. Table 2. Frequency of Prescriber Dispensing by Legend Medication and OTC Medication Category Legend medication category Frequency of dispensing, % OTC medication category Frequency of dispensing, % CNS medications 24 Skin care products 26 Dermatologic 20 Pain medication 18 Antibiotics or antiviral 16 First aid treatments 13 Gastrointestinal agents 11 Cold or allergy products 12 Nonnarcotic analgesics 10 Eye products 11 Pain medications 9 Gastrointestinal products 9 Antiallergy agents 8 Other OTC 9 Chemotherapy active agents 7 Cardiovascular agents 6 Chemotherapy supportive care agents 5 Endocrine agents 5 Pulmonary agents 5 Hormone therapies 5 Ear, nose, and throat agents 3 Antiplatelet, antithrombotic, or hematologic agents 2 Narcotic analgesics 2 Contraceptive agents 2 Other legend agents 12 CNS = central nervous system; OTC = over the counter. 1016 PHARMACOTHERAPY Volume 34, Number 10, 2014
- 6. Hispanic, and 1–2% African American in the dis- penser and nondispenser groups. Survey respon- dents practiced in the following areas: optometry (17.9%), psychiatry (14.2%), derma- tology (13.6%), plastic/reconstructive surgery (12.1%), hematology/oncology (11.3%), internal medicine (9.2%), primary care (7.2%), medical oncology (8.2%), and NPs (6.3%). Among the 1527 prescribers who were screened, 62% reported having dispensed a med- ication in the past 90 days (Table 1). Half (52%) reported dispensing prescription medications every day, 32% weekly, and 16% every 1–3 months. The frequency was independent of the specialty group. Dispensing was more fre- quent among dermatologists. Dispensing behav- ior was independent of patient age or prescription insurance coverage. Only 8% of dis- pensing practitioners perceived the cost of medi- cations to be higher that what patients would pay in a pharmacy, 45% equivalently priced, and 47% lower priced than in a pharmacy. These perceptions were associated with physician spe- cialty groups (v2 = 31.05, p=0.013). Twenty- four percentage of dispensing prescribers planned to increase the practice in the next 2 years, 60% reported planning no change in the proportion of drugs dispensed, and 16% reported to decrease their dispensing. Among nondispensing prescribers, 55% have never con- sidered dispensing, 39% have considered dis- pensing but are yet to start the process, 2% have started the process but have not yet dispensed any medications, and 4% started but abandoned the practice. Dispensing prescribers were significantly more likely to agree that dispensing improved patient adherence compared with the neutrality of nondispensing prescribers (Table 4). Dis- pensing prescribers were also significantly more likely to agree that “dispensing reduces the cost of health care to my patients and dispensing improves patient safety” compared with nondis- pensing prescribers. When asked to comment on the statement that “dispensing reduces the cost of health care to society,” dispensing phy- sician/NPs were more likely to agree compared with nondispensing prescribers who are close to neutral. Table 2 shows the dispensing frequency of legend/OTC medications categories. The highest dispensing rate of legend medications were for the central nervous system and dermatologic cat- egories. In comparison, skin care and pain man- agement products were the two most frequent OTC dispensed categories. Allowed (44 States) Restricted (6 States) Mass - No specific law authorizing; CS dispensing limited to 30 day supp Mont - dispensing prohibted; but some minor exceptions NJ - dispensing allowed - but limited to 7-day supply NY - dispensing not allowed - but 72 hour supply allowed Tex - dispensing not allowed - but 72 hour supply allowed UT - dispensing not allowed, exceptions - cosmetic drugs & oncology patients No Registration Required (28 states) Registration Required (16 states) States require registration with respective professional licensing board, except: Neb - register with BoP as "Delegated Dispenser" NH - register with BoP as "Limited Retail Drug Distributor" No Specific Requirements on Dispensing (23 states) Some Dispensing Requirements (17 states) Must Follow All Pharmacy Requirements (4 states) MD, DO, DDS, DPM, DVM, PA, NP (38 states) Restricted to MD, DO, DDS, DPM, DVM (6 states) A B C D Figure 1. Legally authorized prescriber dispensing in the United States. PRESCRIBER DISPENSING Munger et al 1017
- 7. Table 3 lists the procedures in place for the management of dispensing practice. Proper drug storage (87%; mean importance rating 8.42 [scale 1–10]; mean burden rating 4.66 [scale 1– 10]), patient counseling (86%; importance 8.35; burden 4.74), and maintaining prescription and drug recordkeeping (80%; importance 8.11; bur- den 5.71) are reported most frequently. Approx- imately 67% of dispensing prescribers have drug stock labeling and inventory control, 67% used system verification of product before dispensing, and 65% had prescription labeling in place with mean importance ratings of 7.53, 7.87, and 7.44 and mean burden ratings of 5.64, 5.09, and 5.38, respectively. Over half of dispensing pre- scribers have generic substitutions in place (59%, importance 6.56, burden 4.66) and medi- cation profile/dispensing systems in place (53%, importance 6.81, burden 5.90). There is a statis- tically significant inverse relationship between a prescriber’s perceived importance of dispensing practice and his or her perceived burden (r = À0.95, p=0.001). Study 3: Consumer Survey The average patient consumer age was 46.6 Æ 2.2 years. There was no significant differ- ence in age between consumers who received their prescriptions from a dispensing prescriber versus a pharmacist. More than 15% were older than 65 years. Most patients (82%) were white, 10% were African American, and 7% were Asian or Hispanic. Most had private insurance (67.5%), and 76.4% had purchased a prescription product in the last year from a dispensing prescriber. Two-thirds of patient consumers report pur- chasing their prescription medications primarily Table 4. Prescriber Attitudes for Dispensing Base size (n) Total Dispensers Nondispensers t p 620 311 309 Mean (SD) Mean (SD) Mean (SD) Patient factors Dispensing by physicians in my specialty improves patient adherence 6.39 (2.46) 7.33 (2.01) 5.44 (2.52) 10.34 <0.0001* My patients are pleased that I dispense medications to them 5.96 (2.85) 7.86 (1.87) 4.06 (2.36) 22.25 <0.0001* Dispensing by physicians in my specialty reduces the cost of health care to my patients 5.90 (2.59) 7.03 (2.14) 4.75 (2.49) 12.21 <0.0001* Dispensing by physicians in my specialty improves patient safety 5.83 (2.44) 6.81 (2.14) 4.48 (2.33) 10.98 <0.0001* Dispensing by physicians in my specialty reduces the cost of health care to society 5.76 (2.59) 6.83 (2.21) 4.68 (2.49) 11.37 <0.0001* My patients request that I dispense medication to them 4.76 (2.88) 6.35 (2.35) 3.16 (2.44) 16.55 <0.0001* My patients are willing to pay a premium for the convenience of receiving their medication at my practice, rather than at a pharmacy 4.74 (2.52) 5.56 (2.45) 3.92 (2.31) 8.60 <0.0001* Guidelines State guidelines for dispensing in my specialty are unclear 5.81 (2.41) 5.70 (2.45) 5.93 (2.36) 1.19 NS State guidelines for dispensing in my specialty are too restrictive 5.59 (2.44) 5.71 (2.51) 5.46 (2.37) 1.31 NS It is difficult for physicians in my specialty to obtain permission to dispense medications in my state 5.47 (2.59) 5.30 (2.73) 5.64 (2.43) 1.68 NS Health care professionals Physicians in my specialty should receive the training in how to dispense medications 5.88 (2.78) 6.36 (2.53) 5.39 (2.92) 4.41 <0.0001* Dispensing medications to my patients makes me feel I provide a higher level of care 5.84 (2.79) 7.13 (2.19) 4.55 (2.73) 12.93 <0.0001* Pharmacists It is important for pharmacists to double-check my work 5.08 (2.81) 4.81 (2.79) 5.34 (2.80) 2.37 0.018* Pharmacists make too many medication errors when they dispense medications 3.80 (2.39) 4.27 (2.58) 3.33 (2.08) 5.00 <0.0001* Economics It is financially beneficial to my practice to dispense medications 5.40 (2.71) 6.02 (2.56) 4.77 (2.71) 5.88 <0.0005* I would like to be able to dispense medications from a broader range of products than I do now 5.26 (2.91) 6.16 (2.61) 4.36 (2.92) 8.06 <0.0001* NS = not significant; SD = standard deviation. *Statistically significant difference between groups (p<0.05). 1018 PHARMACOTHERAPY Volume 34, Number 10, 2014
- 8. from a local pharmacy, local supermarket, or convenience store in the past year, with 14% of purchases made from a physician office or clinic. The remainder of consumers purchased their prescriptions by mail order (16%) or other out- lets (4%). Primary care practitioners and internal medicine specialists were reported as the highest dispensing practitioners; these purchases were recurring, with a mean of three purchases in the past year. Of the prescription purchases, three- quarters were routine purchases; the remainder was emergency refills. Overall, 7% of patients reported experiencing an ADR, which was the same among patients who received their prescriptions dispensed by a dispensing prescriber or pharmacist. Among patients who experienced a serious ADR while taking a prescription dispensed by a pharmacist, 42% consulted their primary care physician, 41% consulted a pharmacist, 15% went to urgent care or the emergency department, and 2% con- sulted another physician/NP. In contrast, when a prescription was purchased from a dispensing prescriber, 64% first consulted the physician/NP who sold them the prescription, 28% consulted a pharmacist, 6% went to urgent care or emer- gency departments (a 9% absolute decrease in urgent or emergent care usage as compared with pharmacist dispensing [p<0.05]), and 2% con- sulted another physician or NP. Among patients purchasing prescription medi- cations from a dispensing prescriber, 19% per- ceived the cost of a prescription to be higher than in a pharmacy, 58% about the same, and 23% less than in a pharmacy. A total of 63% of patients expected to purchase the same propor- tion of their medications from a physician/NP in the next 2 years. Seventeen percent of these pre- scription purchasers believed they would pur- chase more; 20% believed they would purchase fewer medications form this source. In terms of attitudes, patients tended to mod- erately agree that dispensing by the prescriber “improves how safe it is for me to take the med- ication.” Patients were more neutral regarding the medication cost savings by prescriber dis- pensing, but 25% of customers were willing to pay more for the convenience. Only 24% requested that their physician or NP dispense directly to them, but 42% percent were pleased with the practice, feeling they received a higher level of care; 40% would like to purchase a broader range of medications. Interestingly, 64% of patients strongly agreed that “having a physi- cian/NP and pharmacist both check my medica- tion makes it safer for me to take the medication.” Half of patients strongly agreed that “I have a safer level of taking my medica- tions when I can talk with my pharmacist about my medications.” Discussion These studies describe the legal authorization, frequency, driving forces, and patient percep- tions regarding legally authorized prescriber dis- pensing across the United States. Overall, dispensing by a legally authorized prescriber is firmly entrenched in the U.S. health care system, although substantial interstate variation exists in the statutory and regulatory authorization. Pre- scriber dispensing appears driven by prescriber perceptions of better convenience and reduc- tions in health care costs with patient agree- ment, and improved medication adherence without patient agreement. Overall, patients appear satisfied with the practice. Prescriber dispensing has grown substantially since the late 1980s, becoming routine practice across many specialties.17, 18 Most legend medi- cation categories are now currently dispensed, sustaining the growth in practice popularity. Patient consumers in the current study are sup- portive of the practice, based principally on two factors: convenience and lower perceived cost of health care. These findings suggest that the phy- sician-patient relationship is strengthened through the provision of dispensing medications, a finding supported by previous studies.16, 18 Yet most patients remain committed to a system of physician/NP prescribing with pharmacist dis- pensing,19 a position also noted in our study. Despite growing capacity and patient support for prescriber dispensing, the bi-provider system of dispensing remains important, and perceived to be beneficial, in the minds of many patient con- sumers. In preventing errors, the Swiss cheese model of human errors would suggest that a system con- sisting of physician/NP prescribing with pharma- cist dispensing would reduce patient harm.20 However, the results of the current consumer study suggest that the rate of consulted ADRs (7%) was exactly the same with prescriber dis- pensing compared with pharmacist dispensing, with patients receiving their prescriptions from their physician/NP reporting fewer emergency department consultations. It is estimated that 0.6–1.7% of all emergency department visits are related to ADRs,21–23 typically occurring in the PRESCRIBER DISPENSING Munger et al 1019
- 9. very young (i.e., 1–4 yrs) or the very old (i.e., older than 65 yrs), and more commonly in women.24 Therefore, patients presenting at the emergency department may cause an increased cost to the health care system. As this study’s results suggest, a potential for reduced health care costs by reduced emergency department utiliza- tion exists; however, cost savings is multifactorial and economic analyses on the cost-effectiveness of prescriber dispensing are still needed. Addi- tionally, actual costs or patient comorbidities were not included in this study. Furthermore, a prospective systematic comparison of reportable ADRs between dispensing prescribers and nondis- pensing prescribers (pharmacist dispensing) may help address patient safety concerns. The present study was not directed at detect- ing direct ADR risk from prescriber dispensing in contrast to the bi-provider system of dispens- ing medications. The lack of consistent dispens- ing procedures by physicians/NPs (e.g., proper drug storage, patient counseling, drug purchase recordkeeping, system verification of product, prescription labeling, etc.), as noted in Table 3, may contribute to dispensing errors and ADRs, carrying the potential for enhanced physician or NP duty of care liability risk. In accordance with pharmacy case law, dispensing liability for drugs is generally considered to be a completely error- free standard; in other words, a no-mistake prac- tice environment.25 With prescriber dispensing, it will be interesting to learn if the same error- free liability standard is applied by the courts to dispensing prescribers. Inconsistent dispensing procedures by dispensing prescribers may offer an opportunity for state medical and pharmacy boards and respective national organizations to collaborate on whether the current dispensing regulatory policies are in fact providing the intended patient protection or whether these regulations might be reframed to apply to all drug-dispensing professions without increasing adverse drug events and reducing liability risk. There is much public policy dialogue about the blurring of scopes of practice among health care practitioners. Traditional paradigms allocate prescribing to legally authorized practitioners within their respective scope of practice, drug administration to nurses, and dispensing to pharmacists. The use of midlevel practitioners in the prescribing process as well as the involve- ment of pharmacists in more direct patient man- agement, such as through medication therapy management or even pharmacist prescribing,26, 27 tends to obscure the scope of practice defini- tions. It is clear from the results of these research studies that scope of practice of these professions is continuing to evolve. Conclusion Prescriber dispensing of legend and OTC drugs is firmly entrenched in the U.S. health care system, is likely to increase, does not appear to increase ADRs, and may reduce urgent care and emergency department visits. The reduction in urgent care and emergency depart- ment visits requires further study to confirm these preliminary findings. References 1. Dispense. Dorland’s illustrated medical dictionary. Elsevier Health Sciences, 2011. Credo Reference. Available from http:// ezproxy.lib.utah.edu/login?qurl=http://search.credoreference.com/ content/entry/ehsdorland/dispense/0 Accessed November 12, 2013. 2. Pugh MB (ed.) Stedman’s medical dictionary, 28th ed. Balti- more, MD: Lippincott Williams & Wilkins, 2006. ISBN 0-7817-3390-8. 3. Kremers E, Urdang G. Economic Structure. In: Sonnedecker G, ed. History of pharmacy, 2nd ed. Philadelphia, PA: JB Lip- pincott, 1951:405–13. 4. Abood RR. Physician dispensing: issues of law, legislation and social policy. Am J Law Med 1989;14(4):307–52. 5. Olch DI. Conflict of interest and physician dispensing. Inter- nist 1987;28:13–6. 6. Perri M III, Kotzan JA, Carroll NV, Fincham JE. Attitudes about physician dispensing among pharmacists, physicians, and patients. Am Pharm 1987;27:57–61. 7. Lober CW, Behlmer SD, Penneys NS, Shupack JL, Thiers BH. Physician drug dispensing. J Am Acad Derm 1988;19(5 Pt 1):915–9. 8. Trytek KA. Physician dispensing of drugs: usurping the phar- macist’s role. J Leg Med 1988;9:637–61. 9. Relman AS. Doctors and the dispensing of drugs [editorial]. N Engl J Med 1987;317:311–2. 10. The American Academy of Urgent Care Medicine. Available from http://aaucm.org/Professionals/MedicalClinicalNews/Dis- pensingRegulations/default.aspx. Accessed November 12, 2013. 11. National Association of Boards of Pharmacy. Physician dis- pensing/pharmacist prescribing survey results. NABP Newslett 1986;Nov:144–52. 12. Anonymous. MD dispensing/pharmacist prescribing: a state- by-state survey. US Pharm 1987;Jun:84,89,92,94,97. 13. National Association Boards of Pharmacy. Survey of phar- macy law [CD-ROM]. Mount Prospect, IL: National Associa- tion Boards of Pharmacy, 2012. 14. National Board of Medical Examiners. Available from www.NBME.org Accessed January 13, 2013. 15. National Association of Boards of Pharmacy. Available from www.NABP.net Accessed January 13, 2013. 16. Nunnally JC, Bernstein IH. Psychometric theory, 3rd ed. New York, NY: McGraw-Hill Book Company, 1994:115. 17. Ogbogu P, Fleischer AB, Brodell RT, Bhalla G, Draelos ZD, Feldman SR. Physicians’ and patients’ perspectives on office- based dispensing. Arch Dermatol 2001;137:151–4. 18. Abood RR. Federal regulation of medications: dispensing. In: Abood RR, ed. Pharmacy practice and the law, 7th ed. Burling- ton, MA: Jones and Bartlett Learning, 2014:123–81. 19. Pink LA, Hageboeck TL, Moore DL. The public’s attitudes, beliefs, and desires regarding physician dispensing and phar- macists. J Pharmaceut Market Manag 1989;4:41–63. 1020 PHARMACOTHERAPY Volume 34, Number 10, 2014
- 10. 20. Reason J. Human error: models and management. BMJ 2000;320:768–70. 21. Capuano A, Irpino A, Gallo M, et al. Regional surveillance of emergency-department visits for outpatient adverse drug events. Eur J Clin Pharmacol 2009;65:721–8. 22. Budnitz DS, Pollock DA, Weidenbach KN, Mendelsohn AB, Schroeder TJ, Annest JL. National surveillance of emergency department visits for outpatient adverse drug events. JAMA 2006;296:1858–66. 23. Cohen AL, Budnitz DS, Weidenbach KN, et al. National sur- veillance of emergency department visits for outpatient adverse drug events in children and adolescents. J Pediatr 2008;152:416–21. Erratum in: J Pediatr. 2008 Jun;152(6):893. 24. Hafner JW Jr, Belknap SM, Squillante MD, Bucheit KA. Adverse drug events in emergency department patients. Ann Emerg Med 2002;39:258–67. 25. Furnish TL. Professional malpractice. Departing from tradi- tional no duty to warn: a new trend for pharmacy malpractice. Am J Trial Advoc 1997;199:199–203. 26. Abramowitz PW, Shane R, Daigle LA, Noonan KA, Letendre DE. Pharmacist interdependent prescribing: a new model for optimizing patient outcomes. Am J Health Syst Pharm 2012;69:1976–81. 27. Victor RG. Expanding pharmacists’ role in the era of health care reform. Am J Health Syst Pharm 2012;69:1959. Supporting Information The following supporting information is available in the online version of this paper: Appendix S1. Statutory and regulatory citations for legally authorized prescriber dispensing in the United States PRESCRIBER DISPENSING Munger et al 1021