SlideShare uma empresa Scribd logo
1 de 9
Radio Shows Revenue Gains Again in Q1 2012

                                       Digital, Off-Air, Political Spending Shine

CLICK HERE FOR FULL REPORT

New York, New York – May 18, 2012 – Radio posted its third consecutive Q1 increase in 2012 with a 1% rise to
$3.814B. Surges in Digital (+10%) and Network (+8%) and a significant increase in Off-Air (+3%) combined
with a stable Spot sector, led to the positive results.


                                              Q1 Revenue Growth Trend (in Billions)


                                                                                                                             Source: Miller, Kaplan, Arase & Co.


“Q1 2012 results confirm that Radio commands a solid position in brands’ total marketing plans,” stated Erica
Farber, RAB President and CEO. “While advertisers continue to capitalize on Radio’s Spot and Network
efficiencies, they’re increasingly utilizing local digital capabilities and audience engagement that this medium
affords.”

                                          Revenue Comparisons – Q1 2012 vs. Q1 2011
                                                       (in Millions)
                    Revenue                                                          $Q1 '12                        % Chg
                    Spot                                                                3,047                         Flat
                    Network                                                                 282                       8%
                    Digital                                                                 165                      10%
                    Off-Air                                                                 320                       3%
                    Grand Total                                                         3,814                         1%

                                                     Source: Miller, Kaplan, Arase & Co.*

Growth from a diverse group of categories and advertisers contributed to the Q1 increases. “Radio continues to
benefit from new advertisers beyond the traditional top tier,” stated Farber. “Advertisers using Radio to sell


                              If you have any questions, please email revenuereport@rab.com or call 212-681-7200.

                                                                                                                                                                   1
products and promote program tune-in have consistently enhanced their Radio presence. These increases
confirm Radio’s ability to drive sales and brand awareness.”

The top ten Spot Radio advertisers for Q1 2012 in order:
                   Comcast Xfinity Cable - $89.7M
                   McDonald’s - $87.6M
                   Safeway - $59.3M
                   Verizon Wireless - $48.5M
                   GEICO - $46M
                   AT&T - $45.5M
                   T-Mobile - $42.2M
                   Toyota Dealer Association - $41.7M
                   Fox TV Network - $39.6M
                   Honda Dealer Association - $32M

Political advertising is playing an important role in Radio’s 2012 revenue growth. The RAB has partnered with
PQ Media to provide the industry with a deep-dive view of the political sector and its impact on Radio.

*Spot Radio, Digital and Off-Air revenues are based on a pool of more than 100 markets as reported by the accounting firm of Miller, Kaplan, Arase & Co.
and extrapolated to the entire U.S. Digital Revenue is comprised from activity generated by websites, Internet/web streaming and HD Radio including
HD2 and HD3 stations. Network Revenue includes the top five Radio network companies. Revenue data has been randomly verified since 2002.

The lineup of markets/stations/networks may vary from year to year. Percent change is calculated on revenue adjusted to current year reporting.

The Radio Advertising Bureau serves more than 6,000 member Radio stations in the U.S. and over 1,000 member networks, representative firms,
broadcast vendors, and international organizations. RAB leads and participates in educational, research, sales, and advocacy programs that promote and
advance Radio as a primary advertising medium.


CLICK HERE FOR FULL REPORT

                                                        2012 Growth Leaders Analysis

Advertisers in the rebounding automotive, supermarket, home furnishings, and retail categories - aided by the
gaming industry selling promises and dreams - provided boosts to Radio’s Q1 ‘12 Spot comps:
                                                First Quarter 2012 Leading Growth Categories
                                                            Spot Radio (in Millions)

            Category                                                                                       $Q1 '12             % Chg
            Automotive Dealers/Dealer Groups/Manufacturers                                                $352.9M                 1%
            Grocery/Convenience Stores                                                                    $192.5M               11%
            Casinos/Lottery                                                                               $122.5M                 7%
            Home Furnishings/Floor Coverings                                                              $113.6M               30%
            Department/Discount Stores & Shopping Centers                                                  $75.0M                 1%


                                                  Source: Miller, Kaplan, Arase & Co.: X-Ray Markets
               (Extrapolated dollar amounts based on the 40 market X-Ray pool may not be fully indicative of industry results as a whole.)


Auto Dealers/Dealer Groups/Manufacturers
Automobile sales are tracking toward a very good year in 2012 and manufacturers and dealers are employing
Radio to help make this happen. Radio’s automotive Spot revenue grew 1% in Q1 2012, building on the huge


                                    If you have any questions, please email revenuereport@rab.com or call 212-681-7200.

                                                                                                                                                           2
27% rebound posted for the same period last year. Automotive is the top category for the quarter across the
Spot Radio markets.

With inventories restored following the March 2011 earthquake and tsunami, Japanese automakers are again
able to compete for share. Toyota Dealer Association and Honda Dealer Association move up into the top
rankings in this category in Q1. GMC Motor Corporation surges into the #3 spot, and Chrysler’s Corporate and
Dealer expenditures round out the top ranks for the quarter.


                            Q1 2012, Automotive Top 5 Spenders (in Millions)


                                                                                                         Source: Miller, Kaplan, Arase & Co.


Radio also saw impressive Q1 Spot growth from Ford Dealer Association (+54% to $14.4M), Chevrolet Dealer
Association (+12% to $12.2M), Honda Motor Corp (+145% to $10.9M), Scion Motor Corporation (+131% to
$9.3M), Mercedes-Benz Dealer Association (+32% to $9.3M), and Acura Dealer Association (+117% to $6.3M).

Across Network Radio airwaves, Automotive is ranked #5 with $14.8M. Ford Motor Co. was the top spending
advertiser for the quarter with $3.9M, followed by Midas Muffler Shops with $2.4M. Advertisers with significant
Q1 2012 increases were:
                    General Motors Corp. – up 69% to $2.4M
                    Daimler AG – up 74% to $752K
                    Interstate Battery System of America – up 319% to $491K
                    Goodyear Tire & Rubber Co. – up 34% to $429K

Grocery/Convenience Stores
Radio bagged an additional 11% from Spot advertisers in the Grocery category in Q1 and the $192.5M
expenditure moves them from 7th overall in Q1 2011 to #5 this quarter.

Safeway dominates the category at $59.3M and is ranked third in total Radio Spot spending this quarter.
Category #2 Kroger Food Stores spent an additional 9% (to $24.6M) while Aldi Food Stores’ move from $0.5M to
$11.4M catapulted them into the #3 category slot. Others who boosted their Spot spend are Giant Eagle
Supermarket (+39%, to $9.6M), Albertson’s (+24%, to $7.0M), and Supervalu (+49%, to $6.2M).

Casinos & Lottery
Continuing an upward trend from year-end 2011, this category grew 7% in Q1 2012. State Lotteries continues
to be a positive influence within the category (accounting for 59% of the total) and was up over a half-million
dollars (+1%) but Casinos & Hotels is the driving force.


                          If you have any questions, please email revenuereport@rab.com or call 212-681-7200.

                                                                                                                                               3
Across the Spot Radio markets, Casinos grew 17% - up $7.2M versus Q1 2011. Lead spender within this
segment, Hard Rock Hotel & Casino grew 7% (+$400K). #2 and #3 Casino advertisers, Harrah’s Hotel & Casino
and Caesar’s Hotel & Casino increased Q1 2012 spending 81% (+$2.8M) and 50% ($1.8M), respectively.

Home Furnishings
Ranked at #10, Home Furnishings has experienced its fifth consecutive quarter of growth with a 30% increase
over Q1 2011 – up $26.5M.

Mattress Firm, year-end 2011 category leader, started 2012 at the same position with $18.5M across the Spot
Radio markets – up 60% versus Q1 2011. Mattress Firm has consistently held a top two position within the
category since Q3 2009.

The remaining top four spenders within the category were:

                                                  Home Furnishings
                                     Q1 2012 vs. Q1 2011 Spot Radio (in Millions)
                        Advertiser                                    $FY '12                           % Chg
                        Select Comfort                                   15.6                            49%
                        Sleepy’s Mattress Store                          11.0                              4%
                        Mattress Discounters                             10.0                            57%
                        Sleep Train Mattress Center                       8.0                              3%

                                          Source: Miller, Kaplan, Arase & Co.: X-Ray Markets
                          (Extrapolated dollar amounts based on the 40 market X-Ray pool may not be fully
                                               indicative of industry results as a whole.)


Health Care
Increased Spot Radio activity from various health care and service providers injected the quarter with 39%
growth over Q1 2011 to $64.5M.

With multiple locations in over 25 states, laser hair removal service provider Ideal Image topped Q1 2012 in the
category at $14.7B – up 86% over Q1 2011. Kaiser Permanente, 2011 year-end category spend leader, placed
an additional 9% (to $7.3M) in the first three months of 2012 versus same time period last year.


                           If you have any questions, please email revenuereport@rab.com or call 212-681-7200.

                                                                                                                   4
Political Overview

While benefitting from activity in hotly contested markets, Radio saw only the tip of the iceberg in Q1 2012.

                                 Within the Miller Kaplan markets political spending from candidates, Issues, PACs,
                                 etc., totaled $6.9M for the quarter. Over half (55%, $3.7M) of these dollars were
                                 driven by PACs and various coalitions. The pro-Gingrich Super PAC, Winning our
                                 Future, topped the charts with $724K, followed by pro-Romney Super PAC,
                                 Restore Our Future, with $538K.

                                 Spending from various candidates accounted for 32% of the political dollars
                                 ($2.2M). Mitt Romney, the presumed Republican presidential candidate, and his
                                 committee, Romney for President, placed over $363K in the quarter – accounting
                                 for 16% of the subcategory.

Political Insights from Leo Kivijarv, Ph.D., VP/Research, PQ Media

Where was Q1 political spending for Radio? Was it driven by candidates, PACs, Issues, etc.?
Political spending in Radio for Q1 showed some uptick but was not as high as some other media. Some Radio
broadcasters experienced lifts in revenue but that was predominantly driven by the Republican Party PACs
within the battleground states. With their incumbent running for re-election, the Democratic Party wasn’t
active in a primary race in Q1, but spending will increase through the November general election date.

What factors will influence increases in Radio spending?
There will always be advertising for voter turnout in states where there are controversial issues. For example,
education is always a big race driver in California. In many states, both sides of the issues will be putting money
on Radio’s airwaves in states where voters will be deciding on one or two key issues, which in turn could impact
the close candidate races in some DMAs.

Which markets have or will see the greatest influx of political ads?
Senate and House Races will have the greatest impact in political spending this year, with only 12 gubernatorial
races, half of which are not contentious. Smaller DMAs, with only a few TV station competitors in the market,
will see the strongest increase when contentious races merit a surge in spending by various PACs making TV
inventory tight and candidates want to target key demos Radio offers. In larger DMAs, the increase won’t be as
pronounced because of competition from the local cable MSOs when TV station inventory becomes tight. Post-
Labor Day campaign activity will be on the rise as the battleground states for candidates and issues become
more focused, generating a huge influx of spending for Radio stations, particularly those in DMAs with two or
more hotly-contested races and/or issues.

Where do you see Radio’s projected share at the end of this political year?
It is still early to tell where total political spending will net out. However, we do anticipate that Radio will see
double digit growth.


Dr. Leo Kivijarv is a respected source of analysis for more than 100 news and trade sources including Bloomberg TV, NPR
Radio, MSNBC, Fortune, Kiplinger’s, and Broadcasting & Cable.


                             If you have any questions, please email revenuereport@rab.com or call 212-681-7200.

                                                                                                                          5
Advertiser Category Analysis

                                                              Q1 2012

Retail – Including Department & Discount Stores, Home Improvement
Post-holiday spending within the retail category has traditionally curtailed during the first quarter of the year.

Spot Radio spending within the Department & Discount Stores subcategory grew 1% to $75M. Walmart
substantially increased Q1 2012 spending – up 36% to $17.8M – propelling it to the #1 slot. Sears increased
spending as well – nearly three-fold over Q1 2011 to $9.3M.

Top five spenders for the subcategory are:

                             Q1 2012 Spending, Top 5 Department and Discount Stores (in Millions)


                                                                                                                 Source: Miller, Kaplan, Arase & Co.


Within the Home Improvement subcategory, Home Depot maintains its position as the top spender in Q1 2012
with $17.5M. Home Depot has maintained the top spot every quarter since Q1 2011. Lowe’s Cos., ranked at
#2, remained relatively flat for the quarter.

Retail was the top spending category across Network Radio’s airwaves in Q1 2012 – up 62% to $80.4M. Top five
Department and Discount Store retailers collectively increased spending 88% - an additional $7.8M placed on
Network Radio:
                   Macy’s – up 55% to $4.3M
                   Sears Holdings Corp. – up 142% to $4.3M
                   Walmart – up 85% to $3.3M
                   Kohl’s – up 49% to $2.5M
                   JC Penney Co., Inc. – up 168% to $2.2M

Home Depot ranked #1 in Network Radio for the quarter in the Home Improvement sub-category at $11M (up
26%) followed by Lowes Cos. at $5.7M (up 81%).


                           If you have any questions, please email revenuereport@rab.com or call 212-681-7200.

                                                                                                                                                       6
Television/Networks/Cable Providers
With total spot volume flat against last year, Television/Networks/Cable enjoys the #2 rank for Spot Radio in Q1,
up from #3 same period 2011.

Category top spender Comcast Xfinity Cable is also Radio’s leading Spot advertiser at $89.7M (+2% over Q1 ’11)
while category #2 Fox TV Network ($39.6M) is ranked #9 across all categories this quarter.

NBC-TV Network nearly doubled its Spot Radio commitment to $31.5M (+87%) to move into the #3 category
rank this quarter. Also up significantly are Charter Communications Cable, +67%, to $18M and CBS-TV
Network, +30% to $11.5M.

Restaurants
Leading Spot spenders in this category increased their Q1 Radio presence for the most part as they competed to
attract consumers who are increasing their dining out events as the economy improves.

Restaurant-category topper McDonald’s is Radio’s second-largest Spot advertiser this quarter at $87.6M. This
expenditure is greater than the next four combined: Subway, $29.4M (+12% over Q1 2011); Taco Bell, $22.1M
(-7%); Dunkin Donuts, $21.5M (+35%); and Wendy’s, $12.9M (+15%).

Other spenders upping Q1 Spot Radio dollars are Buffalo Wild Wings, $10.8M (+14%); Bonefish Grill, $8M
(+7%); and Firehouse Subs, $7.0M (+119%). Firehouse Subs, not on the air in Q1 2010 – cracked the top 25 at
#24 in Q1 ’11 and moves into the #10 slot in category spending for Q1 ’12.

Total Q1 Restaurant Spot spending was virtually flat, mainly reflecting cutbacks on the part of a number of
third-tier advertisers compared to last year’s Q1.

Many of these advertisers also increased their presence on Network Radio for the quarter. Subway, at #1 within
the sector, increased spending 2% to $2.5M. The remaining top three advertisers were: Little Caesars Pizza
Restaurant, $1.2M (versus no activity in Q1 2011); Buffalo Wild Wings Grill, $582K (+59%); and McDonald’s,
$338K (+150%).

Financial Services
Spot spending among the Financial sector dipped approximately one-fifth versus Q1 2011, reflecting
fluctuating signals in the U.S. economy.

Bright spots in the Spot picture are Capital One (+61%, to $17M), Wells Fargo Bank (+21%, to $13.7M), and
TD Bank Financial Group (from $0.4M to $11.9M).

Services aimed at ”The 99%” also increased their Spot spending: Cash Call (+26%, to $6.9M), Consolidated
Credit Counseling (+30%, to $4.8M), Ace Cash Express (+11%, to $3.0M), and Quicken Loans (up seven-fold,
to $2.1M).

Within the Network Radio sector, Wells Fargo increased Q1 2012 spending 168% over Q1 2011 to $2.3M.
Capital One placed $264K compared to no activity in Q1 2011.

Communications/Cellular
Three of Radio’s top ten Spot spenders in Q1 2012 are Communications advertisers: Verizon Wireless (#4),
AT&T (#6), and T-Mobile (#7).


                           If you have any questions, please email revenuereport@rab.com or call 212-681-7200.

                                                                                                                    7
Spot for this category is off by nearly one fourth and drops in rank from first to fourth in contrast with Q1 ’11.
Recent activity has been affected by complicated merger proposals, as well as a lack of truly innovative new
product rollouts that had occurred in prior years.

Communications category spending has become much more competitive among the top five Spot advertisers,
providing more balance and less reliance on revenue from any one account going forward.


                              Q1 2012 Spending, Top 5 Communications/Cellular (in Millions)


                                                                                                                  Source: Miller, Kaplan, Arase & Co.


Insurance Companies
The Insurance category’s Spot results are relatively flat against Q1 2011 despite heated competition among the
auto insurers. The category holds the #6 rank in spot revenue for the quarter, also on par with last year.

Radio’s #5 Spot advertiser GEICO leads this category, outspending all others by sizable amounts:

                                                      Insurance
                                         2012 vs. 2011 Spot Radio (in Millions)
                         Advertiser                                   $Q1 '12                           % Chg
                         GEICO                                             46.0                            1%
                         State Farm                                        24.3                         217%
                         American Family                                   23.9                          75%
                         Allstate Insurance                                14.1                           -1%
                         Safe Auto Insurance                                9.0                          41%

                                          Source: Miller, Kaplan, Arase & Co.: X-Ray Markets
                           (Extrapolated dollar amounts based on the 40 market X-Ray pool may not be fully
                                                indicative of industry results as a whole.)


Within the Network Radio sector, this category experienced a 7% increase for the first three months of 2012
compared to the same time period last year. The following top three advertisers within the category
collectively increased spending $7.9M:
                            GEICO – up 30% to $8.8M
                            Allstate Insurance – up 413% to $6.1M
                            Progressive – up 24% to $4.9M


                            If you have any questions, please email revenuereport@rab.com or call 212-681-7200.

                                                                                                                                                   8
Professional Services
While the category was flat in Q1 2012, advertisers trying to reach consumers for tax preparation services
contributed $6.3M to Spot Radio’s bottom line. H&R Block, the top spender within the category, increased first
quarter spending 13% to $28.1M. Jackson Hewitt Tax Service increased spending 50% to $9.8M.


Advertisers offering hair services also contributed to the Radio’s growth - by $2.1M collectively.
                        Great Clips – up 6% to $6.9M
                        Fantastic Sams – up 44% to $3.1M
                        Sport Clips – up 50% to $2.3M

H&R Block also increased their presence on Network Radio - up 16% to $4.5M. Tax Resolution Services Co.
spending also increased in Q1 2012 over Q1 2011 – a 92% spike to $1.5M.

Specialty Retail
With a 5% increase over Q1 2011, this category has now experienced its fifth consecutive quarter of growth.
This category represents a diverse line-up of retailers targeting specific consumer segments.

Significant spending increases by recognized advertisers such as PetSmart (up 94% to $3.1M) and Luxottica
Group (up 27% to $2.8M) were just part of the reason for the category’s growth. Advertisers placing $12.4M in
activity that were not present in Spot Radio in Q1 2011, and contributing to the categories growth were:
                        GameStop                      $3.4M
                        United Retail Group*          $3.3M
                        Fingerhut                     $3.3M
                        Ulta Beauty Supply            $2.4M


*The Avenue Stores


Spot Radio Advertiser Category analysis is based on data from Miller, Kaplan, Arase & Co. X-Ray Market Reports. X-Ray Market Reports are compiled from
advertiser expenditure data direct from station billing in 35 markets, extrapolated to the entire U.S. Extrapolated dollar amounts may not be fully
indicative of industry results as a whole. X-Ray Markets represent approximately 80% of the dollars from the pool of 100 markets.

The lineup of markets/stations/networks may vary from year to year. Percent change is calculated on revenue adjusted to current year reporting.

Network Radio Advertiser Category spending analysis is based on data from Kantar Media.

PQ Media (www.pqmedia.com) is the leading provider of econometric research and consulting services to the media, entertainment and
communications industries. PQ Media’s proprietary research methodology delivers actionable strategic intelligence to media companies, financiers,
agencies, brands and consultants. PQ Media partners with private equity firm Veronis Suhler Stevenson on the VSS Communications Industry Forecast,
the US industry’s benchmark for spending, usage and growth data for 25 years. For more information, contact Gabriella Kallay at gkallay@pqmedia.com
or 203-921-0368.


                                    If you have any questions, please email revenuereport@rab.com or call 212-681-7200.

                                                                                                                                                         9

Mais conteúdo relacionado

Mais procurados

Q1 2006 Earnings Release
Q1 2006 Earnings ReleaseQ1 2006 Earnings Release
Q1 2006 Earnings Releasefinance7
 
Time Warner Cable Strategy
Time Warner Cable StrategyTime Warner Cable Strategy
Time Warner Cable StrategyDavid Green
 
The World of Pay TV
The World of Pay TVThe World of Pay TV
The World of Pay TVJeehyun Moon
 
Sutanto_QuantitativeAnalysis_APA
Sutanto_QuantitativeAnalysis_APASutanto_QuantitativeAnalysis_APA
Sutanto_QuantitativeAnalysis_APASamuel Sutanto
 
IMPERIAL TOBACCO GROUP PLC
IMPERIAL TOBACCO GROUP PLCIMPERIAL TOBACCO GROUP PLC
IMPERIAL TOBACCO GROUP PLCHardik Bendbar
 
news corp Annual Reports 2007
news corp Annual Reports 2007news corp Annual Reports 2007
news corp Annual Reports 2007finance9
 
news corp Annual Reports 2006
news corp Annual Reports 2006news corp Annual Reports 2006
news corp Annual Reports 2006finance9
 
[2016 Outlook] Media Advertisement
[2016 Outlook] Media Advertisement [2016 Outlook] Media Advertisement
[2016 Outlook] Media Advertisement Jeehyun Moon
 
Affiliate survey-2012
Affiliate survey-2012Affiliate survey-2012
Affiliate survey-2012Jochem Vroom
 
alltel 4Q 04_EarningsRelease
alltel  4Q 04_EarningsReleasealltel  4Q 04_EarningsRelease
alltel 4Q 04_EarningsReleasefinance27
 
alltel 4Q 04_Earningsrelease
alltel  4Q 04_Earningsreleasealltel  4Q 04_Earningsrelease
alltel 4Q 04_Earningsreleasefinance27
 

Mais procurados (15)

Q1 2006 Earnings Release
Q1 2006 Earnings ReleaseQ1 2006 Earnings Release
Q1 2006 Earnings Release
 
CBS qr2q 05
CBS qr2q 05CBS qr2q 05
CBS qr2q 05
 
Time Warner Cable Strategy
Time Warner Cable StrategyTime Warner Cable Strategy
Time Warner Cable Strategy
 
The World of Pay TV
The World of Pay TVThe World of Pay TV
The World of Pay TV
 
Sutanto_QuantitativeAnalysis_APA
Sutanto_QuantitativeAnalysis_APASutanto_QuantitativeAnalysis_APA
Sutanto_QuantitativeAnalysis_APA
 
Market Analysis Report
Market Analysis ReportMarket Analysis Report
Market Analysis Report
 
IMPERIAL TOBACCO GROUP PLC
IMPERIAL TOBACCO GROUP PLCIMPERIAL TOBACCO GROUP PLC
IMPERIAL TOBACCO GROUP PLC
 
news corp Annual Reports 2007
news corp Annual Reports 2007news corp Annual Reports 2007
news corp Annual Reports 2007
 
news corp Annual Reports 2006
news corp Annual Reports 2006news corp Annual Reports 2006
news corp Annual Reports 2006
 
[2016 Outlook] Media Advertisement
[2016 Outlook] Media Advertisement [2016 Outlook] Media Advertisement
[2016 Outlook] Media Advertisement
 
Media Update - July 2011
Media Update - July 2011Media Update - July 2011
Media Update - July 2011
 
T-MobileValuation
T-MobileValuationT-MobileValuation
T-MobileValuation
 
Affiliate survey-2012
Affiliate survey-2012Affiliate survey-2012
Affiliate survey-2012
 
alltel 4Q 04_EarningsRelease
alltel  4Q 04_EarningsReleasealltel  4Q 04_EarningsRelease
alltel 4Q 04_EarningsRelease
 
alltel 4Q 04_Earningsrelease
alltel  4Q 04_Earningsreleasealltel  4Q 04_Earningsrelease
alltel 4Q 04_Earningsrelease
 

Semelhante a Radio shows revenue gains again in q1 2012

Media Maven: Ad Outlook March 2012
Media Maven: Ad Outlook March 2012Media Maven: Ad Outlook March 2012
Media Maven: Ad Outlook March 2012rpw327
 
Nibc 2016 mba-m fin - true north investments - ppt
Nibc 2016   mba-m fin - true north investments - pptNibc 2016   mba-m fin - true north investments - ppt
Nibc 2016 mba-m fin - true north investments - pptJohn McGlynn
 
ATSYD 13 Jason Barnes/Kaylie Smith - News Ltd/Rubicon
ATSYD 13 Jason Barnes/Kaylie Smith - News Ltd/RubiconATSYD 13 Jason Barnes/Kaylie Smith - News Ltd/Rubicon
ATSYD 13 Jason Barnes/Kaylie Smith - News Ltd/RubiconGavin Stewart
 
Quarterly Statistics on Media, Mobile, Social Media and Advertising
Quarterly Statistics on Media, Mobile, Social Media and AdvertisingQuarterly Statistics on Media, Mobile, Social Media and Advertising
Quarterly Statistics on Media, Mobile, Social Media and AdvertisingEM3
 
Marketingcharts powerpoint-the-marketing-data-box
Marketingcharts powerpoint-the-marketing-data-boxMarketingcharts powerpoint-the-marketing-data-box
Marketingcharts powerpoint-the-marketing-data-boxMathilde Lenoir
 
Marketing Analytics: A Smarter Way for Auto and Home Insurers to Gain Competi...
Marketing Analytics: A Smarter Way for Auto and Home Insurers to Gain Competi...Marketing Analytics: A Smarter Way for Auto and Home Insurers to Gain Competi...
Marketing Analytics: A Smarter Way for Auto and Home Insurers to Gain Competi...Cognizant
 
Meeting with investors of september 2013
Meeting with investors of september 2013Meeting with investors of september 2013
Meeting with investors of september 2013TIM RI
 
Cummins_I Q3 Pres
Cummins_I Q3 PresCummins_I Q3 Pres
Cummins_I Q3 Presfinance21
 
Ad exchanges targeting & optimization april 2011
Ad exchanges targeting & optimization april 2011Ad exchanges targeting & optimization april 2011
Ad exchanges targeting & optimization april 2011Linda Gridley
 
Co-op Advertising: Digital's Lost Opportunity
Co-op Advertising: Digital's Lost OpportunityCo-op Advertising: Digital's Lost Opportunity
Co-op Advertising: Digital's Lost OpportunityRebecca Lieb
 
AGC AdTech Industry Update_01.2016
AGC AdTech Industry Update_01.2016AGC AdTech Industry Update_01.2016
AGC AdTech Industry Update_01.2016Linda Gridley
 
Marketing Response and Optimization Model for Casinos
Marketing Response and Optimization Model for CasinosMarketing Response and Optimization Model for Casinos
Marketing Response and Optimization Model for CasinosMichael Wolfe
 
Ad Industry Holding Company Report Premium Version
Ad Industry Holding Company Report Premium VersionAd Industry Holding Company Report Premium Version
Ad Industry Holding Company Report Premium Versionttgoods
 
Usa Turkey Telecom And Mobile Marketing Advertising Benchmarking Limited Edition
Usa Turkey Telecom And Mobile Marketing Advertising Benchmarking Limited EditionUsa Turkey Telecom And Mobile Marketing Advertising Benchmarking Limited Edition
Usa Turkey Telecom And Mobile Marketing Advertising Benchmarking Limited EditionEvrim Dirik
 
Stifel Internet Research - The Long Runway to Solving Consumer Problems
Stifel Internet Research - The Long Runway to Solving Consumer ProblemsStifel Internet Research - The Long Runway to Solving Consumer Problems
Stifel Internet Research - The Long Runway to Solving Consumer ProblemsScott Devitt
 
TAM AdEx-Mirroring Y 2020 for Radio Advertising
TAM AdEx-Mirroring Y 2020 for Radio AdvertisingTAM AdEx-Mirroring Y 2020 for Radio Advertising
TAM AdEx-Mirroring Y 2020 for Radio AdvertisingSocial Samosa
 

Semelhante a Radio shows revenue gains again in q1 2012 (20)

Media Maven: Ad Outlook March 2012
Media Maven: Ad Outlook March 2012Media Maven: Ad Outlook March 2012
Media Maven: Ad Outlook March 2012
 
Nibc 2016 mba-m fin - true north investments - ppt
Nibc 2016   mba-m fin - true north investments - pptNibc 2016   mba-m fin - true north investments - ppt
Nibc 2016 mba-m fin - true north investments - ppt
 
ATSYD 13 Jason Barnes/Kaylie Smith - News Ltd/Rubicon
ATSYD 13 Jason Barnes/Kaylie Smith - News Ltd/RubiconATSYD 13 Jason Barnes/Kaylie Smith - News Ltd/Rubicon
ATSYD 13 Jason Barnes/Kaylie Smith - News Ltd/Rubicon
 
Quarterly Statistics on Media, Mobile, Social Media and Advertising
Quarterly Statistics on Media, Mobile, Social Media and AdvertisingQuarterly Statistics on Media, Mobile, Social Media and Advertising
Quarterly Statistics on Media, Mobile, Social Media and Advertising
 
Marketingcharts powerpoint-the-marketing-data-box
Marketingcharts powerpoint-the-marketing-data-boxMarketingcharts powerpoint-the-marketing-data-box
Marketingcharts powerpoint-the-marketing-data-box
 
Marketing Analytics: A Smarter Way for Auto and Home Insurers to Gain Competi...
Marketing Analytics: A Smarter Way for Auto and Home Insurers to Gain Competi...Marketing Analytics: A Smarter Way for Auto and Home Insurers to Gain Competi...
Marketing Analytics: A Smarter Way for Auto and Home Insurers to Gain Competi...
 
Meeting with investors of september 2013
Meeting with investors of september 2013Meeting with investors of september 2013
Meeting with investors of september 2013
 
Cummins_I Q3 Pres
Cummins_I Q3 PresCummins_I Q3 Pres
Cummins_I Q3 Pres
 
CMIQ3Pres
CMIQ3PresCMIQ3Pres
CMIQ3Pres
 
Ad exchanges targeting & optimization april 2011
Ad exchanges targeting & optimization april 2011Ad exchanges targeting & optimization april 2011
Ad exchanges targeting & optimization april 2011
 
Co-op Advertising: Digital's Lost Opportunity
Co-op Advertising: Digital's Lost OpportunityCo-op Advertising: Digital's Lost Opportunity
Co-op Advertising: Digital's Lost Opportunity
 
Tata Motos Limited
Tata Motos LimitedTata Motos Limited
Tata Motos Limited
 
AGC AdTech Industry Update_01.2016
AGC AdTech Industry Update_01.2016AGC AdTech Industry Update_01.2016
AGC AdTech Industry Update_01.2016
 
Marketing Response and Optimization Model for Casinos
Marketing Response and Optimization Model for CasinosMarketing Response and Optimization Model for Casinos
Marketing Response and Optimization Model for Casinos
 
Cable Direct Marketing
Cable Direct MarketingCable Direct Marketing
Cable Direct Marketing
 
Ad Industry Holding Company Report Premium Version
Ad Industry Holding Company Report Premium VersionAd Industry Holding Company Report Premium Version
Ad Industry Holding Company Report Premium Version
 
Usa Turkey Telecom And Mobile Marketing Advertising Benchmarking Limited Edition
Usa Turkey Telecom And Mobile Marketing Advertising Benchmarking Limited EditionUsa Turkey Telecom And Mobile Marketing Advertising Benchmarking Limited Edition
Usa Turkey Telecom And Mobile Marketing Advertising Benchmarking Limited Edition
 
Stifel Internet Research - The Long Runway to Solving Consumer Problems
Stifel Internet Research - The Long Runway to Solving Consumer ProblemsStifel Internet Research - The Long Runway to Solving Consumer Problems
Stifel Internet Research - The Long Runway to Solving Consumer Problems
 
TAM AdEx-Mirroring Y 2020 for Radio Advertising
TAM AdEx-Mirroring Y 2020 for Radio AdvertisingTAM AdEx-Mirroring Y 2020 for Radio Advertising
TAM AdEx-Mirroring Y 2020 for Radio Advertising
 
Airtel
AirtelAirtel
Airtel
 

Mais de 中文互联网数据研究资讯中心--199it

Mais de 中文互联网数据研究资讯中心--199it (20)

Back to-school spending grows as parents restock, replenish children’s needs
Back to-school spending grows as parents restock, replenish children’s needsBack to-school spending grows as parents restock, replenish children’s needs
Back to-school spending grows as parents restock, replenish children’s needs
 
The economics of online advertising august 2012
The economics of online advertising  august 2012The economics of online advertising  august 2012
The economics of online advertising august 2012
 
人口统计学定向方法低效
人口统计学定向方法低效人口统计学定向方法低效
人口统计学定向方法低效
 
Distimo publication-july-20122
Distimo publication-july-20122Distimo publication-july-20122
Distimo publication-july-20122
 
Germany automotive-advertising
Germany automotive-advertisingGermany automotive-advertising
Germany automotive-advertising
 
Comscore media metrix ranks top 50 u.s. web properties for june 2012
Comscore media metrix ranks top 50 u.s. web properties for june 2012Comscore media metrix ranks top 50 u.s. web properties for june 2012
Comscore media metrix ranks top 50 u.s. web properties for june 2012
 
零售商调研
零售商调研零售商调研
零售商调研
 
新一代的电商模式
新一代的电商模式新一代的电商模式
新一代的电商模式
 
全球100品牌社会化媒体应用情况
全球100品牌社会化媒体应用情况全球100品牌社会化媒体应用情况
全球100品牌社会化媒体应用情况
 
中国联通沃商店( Wo store)应用监测2012.5 7.17
中国联通沃商店( Wo store)应用监测2012.5 7.17中国联通沃商店( Wo store)应用监测2012.5 7.17
中国联通沃商店( Wo store)应用监测2012.5 7.17
 
2012年Q2移动搜索营销报告
2012年Q2移动搜索营销报告2012年Q2移动搜索营销报告
2012年Q2移动搜索营销报告
 
互联网精准广告定向技术-by牛国柱
互联网精准广告定向技术-by牛国柱互联网精准广告定向技术-by牛国柱
互联网精准广告定向技术-by牛国柱
 
社会化媒体赞助广告研究报告
社会化媒体赞助广告研究报告社会化媒体赞助广告研究报告
社会化媒体赞助广告研究报告
 
移动互联网月度监测(2012年07月)
移动互联网月度监测(2012年07月)移动互联网月度监测(2012年07月)
移动互联网月度监测(2012年07月)
 
Big datafordevelopment un-globalpulsejune2012
Big datafordevelopment un-globalpulsejune2012Big datafordevelopment un-globalpulsejune2012
Big datafordevelopment un-globalpulsejune2012
 
Socialogue,heart wired or hard-wired
Socialogue,heart wired or hard-wiredSocialogue,heart wired or hard-wired
Socialogue,heart wired or hard-wired
 
IBM:2012年全球ceo调研报告全文
IBM:2012年全球ceo调研报告全文IBM:2012年全球ceo调研报告全文
IBM:2012年全球ceo调研报告全文
 
品牌广告移动营销2012 安沃行业报告
品牌广告移动营销2012 安沃行业报告品牌广告移动营销2012 安沃行业报告
品牌广告移动营销2012 安沃行业报告
 
Outlook 2012 ecommerce-2
Outlook 2012 ecommerce-2Outlook 2012 ecommerce-2
Outlook 2012 ecommerce-2
 
2012 shopper study
2012 shopper study2012 shopper study
2012 shopper study
 

Último

Call Girls Electronic City Just Call 👗 7737669865 👗 Top Class Call Girl Servi...
Call Girls Electronic City Just Call 👗 7737669865 👗 Top Class Call Girl Servi...Call Girls Electronic City Just Call 👗 7737669865 👗 Top Class Call Girl Servi...
Call Girls Electronic City Just Call 👗 7737669865 👗 Top Class Call Girl Servi...amitlee9823
 
Call Girls Navi Mumbai Just Call 9907093804 Top Class Call Girl Service Avail...
Call Girls Navi Mumbai Just Call 9907093804 Top Class Call Girl Service Avail...Call Girls Navi Mumbai Just Call 9907093804 Top Class Call Girl Service Avail...
Call Girls Navi Mumbai Just Call 9907093804 Top Class Call Girl Service Avail...Dipal Arora
 
Enhancing and Restoring Safety & Quality Cultures - Dave Litwiller - May 2024...
Enhancing and Restoring Safety & Quality Cultures - Dave Litwiller - May 2024...Enhancing and Restoring Safety & Quality Cultures - Dave Litwiller - May 2024...
Enhancing and Restoring Safety & Quality Cultures - Dave Litwiller - May 2024...Dave Litwiller
 
B.COM Unit – 4 ( CORPORATE SOCIAL RESPONSIBILITY ( CSR ).pptx
B.COM Unit – 4 ( CORPORATE SOCIAL RESPONSIBILITY ( CSR ).pptxB.COM Unit – 4 ( CORPORATE SOCIAL RESPONSIBILITY ( CSR ).pptx
B.COM Unit – 4 ( CORPORATE SOCIAL RESPONSIBILITY ( CSR ).pptxpriyanshujha201
 
M.C Lodges -- Guest House in Jhang.
M.C Lodges --  Guest House in Jhang.M.C Lodges --  Guest House in Jhang.
M.C Lodges -- Guest House in Jhang.Aaiza Hassan
 
Famous Olympic Siblings from the 21st Century
Famous Olympic Siblings from the 21st CenturyFamous Olympic Siblings from the 21st Century
Famous Olympic Siblings from the 21st Centuryrwgiffor
 
John Halpern sued for sexual assault.pdf
John Halpern sued for sexual assault.pdfJohn Halpern sued for sexual assault.pdf
John Halpern sued for sexual assault.pdfAmzadHosen3
 
KYC-Verified Accounts: Helping Companies Handle Challenging Regulatory Enviro...
KYC-Verified Accounts: Helping Companies Handle Challenging Regulatory Enviro...KYC-Verified Accounts: Helping Companies Handle Challenging Regulatory Enviro...
KYC-Verified Accounts: Helping Companies Handle Challenging Regulatory Enviro...Any kyc Account
 
Mysore Call Girls 8617370543 WhatsApp Number 24x7 Best Services
Mysore Call Girls 8617370543 WhatsApp Number 24x7 Best ServicesMysore Call Girls 8617370543 WhatsApp Number 24x7 Best Services
Mysore Call Girls 8617370543 WhatsApp Number 24x7 Best ServicesDipal Arora
 
Call Girls In Panjim North Goa 9971646499 Genuine Service
Call Girls In Panjim North Goa 9971646499 Genuine ServiceCall Girls In Panjim North Goa 9971646499 Genuine Service
Call Girls In Panjim North Goa 9971646499 Genuine Serviceritikaroy0888
 
👉Chandigarh Call Girls 👉9878799926👉Just Call👉Chandigarh Call Girl In Chandiga...
👉Chandigarh Call Girls 👉9878799926👉Just Call👉Chandigarh Call Girl In Chandiga...👉Chandigarh Call Girls 👉9878799926👉Just Call👉Chandigarh Call Girl In Chandiga...
👉Chandigarh Call Girls 👉9878799926👉Just Call👉Chandigarh Call Girl In Chandiga...rajveerescorts2022
 
VIP Call Girls In Saharaganj ( Lucknow ) 🔝 8923113531 🔝 Cash Payment (COD) 👒
VIP Call Girls In Saharaganj ( Lucknow  ) 🔝 8923113531 🔝  Cash Payment (COD) 👒VIP Call Girls In Saharaganj ( Lucknow  ) 🔝 8923113531 🔝  Cash Payment (COD) 👒
VIP Call Girls In Saharaganj ( Lucknow ) 🔝 8923113531 🔝 Cash Payment (COD) 👒anilsa9823
 
Call Girls In DLf Gurgaon ➥99902@11544 ( Best price)100% Genuine Escort In 24...
Call Girls In DLf Gurgaon ➥99902@11544 ( Best price)100% Genuine Escort In 24...Call Girls In DLf Gurgaon ➥99902@11544 ( Best price)100% Genuine Escort In 24...
Call Girls In DLf Gurgaon ➥99902@11544 ( Best price)100% Genuine Escort In 24...lizamodels9
 
Cracking the Cultural Competence Code.pptx
Cracking the Cultural Competence Code.pptxCracking the Cultural Competence Code.pptx
Cracking the Cultural Competence Code.pptxWorkforce Group
 
It will be International Nurses' Day on 12 May
It will be International Nurses' Day on 12 MayIt will be International Nurses' Day on 12 May
It will be International Nurses' Day on 12 MayNZSG
 
Monthly Social Media Update April 2024 pptx.pptx
Monthly Social Media Update April 2024 pptx.pptxMonthly Social Media Update April 2024 pptx.pptx
Monthly Social Media Update April 2024 pptx.pptxAndy Lambert
 
Dr. Admir Softic_ presentation_Green Club_ENG.pdf
Dr. Admir Softic_ presentation_Green Club_ENG.pdfDr. Admir Softic_ presentation_Green Club_ENG.pdf
Dr. Admir Softic_ presentation_Green Club_ENG.pdfAdmir Softic
 
The Path to Product Excellence: Avoiding Common Pitfalls and Enhancing Commun...
The Path to Product Excellence: Avoiding Common Pitfalls and Enhancing Commun...The Path to Product Excellence: Avoiding Common Pitfalls and Enhancing Commun...
The Path to Product Excellence: Avoiding Common Pitfalls and Enhancing Commun...Aggregage
 

Último (20)

Call Girls Electronic City Just Call 👗 7737669865 👗 Top Class Call Girl Servi...
Call Girls Electronic City Just Call 👗 7737669865 👗 Top Class Call Girl Servi...Call Girls Electronic City Just Call 👗 7737669865 👗 Top Class Call Girl Servi...
Call Girls Electronic City Just Call 👗 7737669865 👗 Top Class Call Girl Servi...
 
Call Girls Navi Mumbai Just Call 9907093804 Top Class Call Girl Service Avail...
Call Girls Navi Mumbai Just Call 9907093804 Top Class Call Girl Service Avail...Call Girls Navi Mumbai Just Call 9907093804 Top Class Call Girl Service Avail...
Call Girls Navi Mumbai Just Call 9907093804 Top Class Call Girl Service Avail...
 
Enhancing and Restoring Safety & Quality Cultures - Dave Litwiller - May 2024...
Enhancing and Restoring Safety & Quality Cultures - Dave Litwiller - May 2024...Enhancing and Restoring Safety & Quality Cultures - Dave Litwiller - May 2024...
Enhancing and Restoring Safety & Quality Cultures - Dave Litwiller - May 2024...
 
B.COM Unit – 4 ( CORPORATE SOCIAL RESPONSIBILITY ( CSR ).pptx
B.COM Unit – 4 ( CORPORATE SOCIAL RESPONSIBILITY ( CSR ).pptxB.COM Unit – 4 ( CORPORATE SOCIAL RESPONSIBILITY ( CSR ).pptx
B.COM Unit – 4 ( CORPORATE SOCIAL RESPONSIBILITY ( CSR ).pptx
 
M.C Lodges -- Guest House in Jhang.
M.C Lodges --  Guest House in Jhang.M.C Lodges --  Guest House in Jhang.
M.C Lodges -- Guest House in Jhang.
 
Mifty kit IN Salmiya (+918133066128) Abortion pills IN Salmiyah Cytotec pills
Mifty kit IN Salmiya (+918133066128) Abortion pills IN Salmiyah Cytotec pillsMifty kit IN Salmiya (+918133066128) Abortion pills IN Salmiyah Cytotec pills
Mifty kit IN Salmiya (+918133066128) Abortion pills IN Salmiyah Cytotec pills
 
Famous Olympic Siblings from the 21st Century
Famous Olympic Siblings from the 21st CenturyFamous Olympic Siblings from the 21st Century
Famous Olympic Siblings from the 21st Century
 
Forklift Operations: Safety through Cartoons
Forklift Operations: Safety through CartoonsForklift Operations: Safety through Cartoons
Forklift Operations: Safety through Cartoons
 
John Halpern sued for sexual assault.pdf
John Halpern sued for sexual assault.pdfJohn Halpern sued for sexual assault.pdf
John Halpern sued for sexual assault.pdf
 
KYC-Verified Accounts: Helping Companies Handle Challenging Regulatory Enviro...
KYC-Verified Accounts: Helping Companies Handle Challenging Regulatory Enviro...KYC-Verified Accounts: Helping Companies Handle Challenging Regulatory Enviro...
KYC-Verified Accounts: Helping Companies Handle Challenging Regulatory Enviro...
 
Mysore Call Girls 8617370543 WhatsApp Number 24x7 Best Services
Mysore Call Girls 8617370543 WhatsApp Number 24x7 Best ServicesMysore Call Girls 8617370543 WhatsApp Number 24x7 Best Services
Mysore Call Girls 8617370543 WhatsApp Number 24x7 Best Services
 
Call Girls In Panjim North Goa 9971646499 Genuine Service
Call Girls In Panjim North Goa 9971646499 Genuine ServiceCall Girls In Panjim North Goa 9971646499 Genuine Service
Call Girls In Panjim North Goa 9971646499 Genuine Service
 
👉Chandigarh Call Girls 👉9878799926👉Just Call👉Chandigarh Call Girl In Chandiga...
👉Chandigarh Call Girls 👉9878799926👉Just Call👉Chandigarh Call Girl In Chandiga...👉Chandigarh Call Girls 👉9878799926👉Just Call👉Chandigarh Call Girl In Chandiga...
👉Chandigarh Call Girls 👉9878799926👉Just Call👉Chandigarh Call Girl In Chandiga...
 
VIP Call Girls In Saharaganj ( Lucknow ) 🔝 8923113531 🔝 Cash Payment (COD) 👒
VIP Call Girls In Saharaganj ( Lucknow  ) 🔝 8923113531 🔝  Cash Payment (COD) 👒VIP Call Girls In Saharaganj ( Lucknow  ) 🔝 8923113531 🔝  Cash Payment (COD) 👒
VIP Call Girls In Saharaganj ( Lucknow ) 🔝 8923113531 🔝 Cash Payment (COD) 👒
 
Call Girls In DLf Gurgaon ➥99902@11544 ( Best price)100% Genuine Escort In 24...
Call Girls In DLf Gurgaon ➥99902@11544 ( Best price)100% Genuine Escort In 24...Call Girls In DLf Gurgaon ➥99902@11544 ( Best price)100% Genuine Escort In 24...
Call Girls In DLf Gurgaon ➥99902@11544 ( Best price)100% Genuine Escort In 24...
 
Cracking the Cultural Competence Code.pptx
Cracking the Cultural Competence Code.pptxCracking the Cultural Competence Code.pptx
Cracking the Cultural Competence Code.pptx
 
It will be International Nurses' Day on 12 May
It will be International Nurses' Day on 12 MayIt will be International Nurses' Day on 12 May
It will be International Nurses' Day on 12 May
 
Monthly Social Media Update April 2024 pptx.pptx
Monthly Social Media Update April 2024 pptx.pptxMonthly Social Media Update April 2024 pptx.pptx
Monthly Social Media Update April 2024 pptx.pptx
 
Dr. Admir Softic_ presentation_Green Club_ENG.pdf
Dr. Admir Softic_ presentation_Green Club_ENG.pdfDr. Admir Softic_ presentation_Green Club_ENG.pdf
Dr. Admir Softic_ presentation_Green Club_ENG.pdf
 
The Path to Product Excellence: Avoiding Common Pitfalls and Enhancing Commun...
The Path to Product Excellence: Avoiding Common Pitfalls and Enhancing Commun...The Path to Product Excellence: Avoiding Common Pitfalls and Enhancing Commun...
The Path to Product Excellence: Avoiding Common Pitfalls and Enhancing Commun...
 

Radio shows revenue gains again in q1 2012

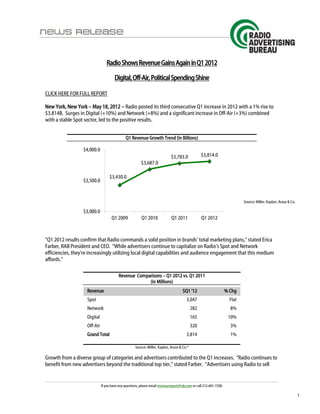
  • 1. Radio Shows Revenue Gains Again in Q1 2012 Digital, Off-Air, Political Spending Shine CLICK HERE FOR FULL REPORT New York, New York – May 18, 2012 – Radio posted its third consecutive Q1 increase in 2012 with a 1% rise to $3.814B. Surges in Digital (+10%) and Network (+8%) and a significant increase in Off-Air (+3%) combined with a stable Spot sector, led to the positive results. Q1 Revenue Growth Trend (in Billions) Source: Miller, Kaplan, Arase & Co. “Q1 2012 results confirm that Radio commands a solid position in brands’ total marketing plans,” stated Erica Farber, RAB President and CEO. “While advertisers continue to capitalize on Radio’s Spot and Network efficiencies, they’re increasingly utilizing local digital capabilities and audience engagement that this medium affords.” Revenue Comparisons – Q1 2012 vs. Q1 2011 (in Millions) Revenue $Q1 '12 % Chg Spot 3,047 Flat Network 282 8% Digital 165 10% Off-Air 320 3% Grand Total 3,814 1% Source: Miller, Kaplan, Arase & Co.* Growth from a diverse group of categories and advertisers contributed to the Q1 increases. “Radio continues to benefit from new advertisers beyond the traditional top tier,” stated Farber. “Advertisers using Radio to sell If you have any questions, please email revenuereport@rab.com or call 212-681-7200. 1
  • 2. products and promote program tune-in have consistently enhanced their Radio presence. These increases confirm Radio’s ability to drive sales and brand awareness.” The top ten Spot Radio advertisers for Q1 2012 in order:  Comcast Xfinity Cable - $89.7M  McDonald’s - $87.6M  Safeway - $59.3M  Verizon Wireless - $48.5M  GEICO - $46M  AT&T - $45.5M  T-Mobile - $42.2M  Toyota Dealer Association - $41.7M  Fox TV Network - $39.6M  Honda Dealer Association - $32M Political advertising is playing an important role in Radio’s 2012 revenue growth. The RAB has partnered with PQ Media to provide the industry with a deep-dive view of the political sector and its impact on Radio. *Spot Radio, Digital and Off-Air revenues are based on a pool of more than 100 markets as reported by the accounting firm of Miller, Kaplan, Arase & Co. and extrapolated to the entire U.S. Digital Revenue is comprised from activity generated by websites, Internet/web streaming and HD Radio including HD2 and HD3 stations. Network Revenue includes the top five Radio network companies. Revenue data has been randomly verified since 2002. The lineup of markets/stations/networks may vary from year to year. Percent change is calculated on revenue adjusted to current year reporting. The Radio Advertising Bureau serves more than 6,000 member Radio stations in the U.S. and over 1,000 member networks, representative firms, broadcast vendors, and international organizations. RAB leads and participates in educational, research, sales, and advocacy programs that promote and advance Radio as a primary advertising medium. CLICK HERE FOR FULL REPORT 2012 Growth Leaders Analysis Advertisers in the rebounding automotive, supermarket, home furnishings, and retail categories - aided by the gaming industry selling promises and dreams - provided boosts to Radio’s Q1 ‘12 Spot comps: First Quarter 2012 Leading Growth Categories Spot Radio (in Millions) Category $Q1 '12 % Chg Automotive Dealers/Dealer Groups/Manufacturers $352.9M 1% Grocery/Convenience Stores $192.5M 11% Casinos/Lottery $122.5M 7% Home Furnishings/Floor Coverings $113.6M 30% Department/Discount Stores & Shopping Centers $75.0M 1% Source: Miller, Kaplan, Arase & Co.: X-Ray Markets (Extrapolated dollar amounts based on the 40 market X-Ray pool may not be fully indicative of industry results as a whole.) Auto Dealers/Dealer Groups/Manufacturers Automobile sales are tracking toward a very good year in 2012 and manufacturers and dealers are employing Radio to help make this happen. Radio’s automotive Spot revenue grew 1% in Q1 2012, building on the huge If you have any questions, please email revenuereport@rab.com or call 212-681-7200. 2
  • 3. 27% rebound posted for the same period last year. Automotive is the top category for the quarter across the Spot Radio markets. With inventories restored following the March 2011 earthquake and tsunami, Japanese automakers are again able to compete for share. Toyota Dealer Association and Honda Dealer Association move up into the top rankings in this category in Q1. GMC Motor Corporation surges into the #3 spot, and Chrysler’s Corporate and Dealer expenditures round out the top ranks for the quarter. Q1 2012, Automotive Top 5 Spenders (in Millions) Source: Miller, Kaplan, Arase & Co. Radio also saw impressive Q1 Spot growth from Ford Dealer Association (+54% to $14.4M), Chevrolet Dealer Association (+12% to $12.2M), Honda Motor Corp (+145% to $10.9M), Scion Motor Corporation (+131% to $9.3M), Mercedes-Benz Dealer Association (+32% to $9.3M), and Acura Dealer Association (+117% to $6.3M). Across Network Radio airwaves, Automotive is ranked #5 with $14.8M. Ford Motor Co. was the top spending advertiser for the quarter with $3.9M, followed by Midas Muffler Shops with $2.4M. Advertisers with significant Q1 2012 increases were:  General Motors Corp. – up 69% to $2.4M  Daimler AG – up 74% to $752K  Interstate Battery System of America – up 319% to $491K  Goodyear Tire & Rubber Co. – up 34% to $429K Grocery/Convenience Stores Radio bagged an additional 11% from Spot advertisers in the Grocery category in Q1 and the $192.5M expenditure moves them from 7th overall in Q1 2011 to #5 this quarter. Safeway dominates the category at $59.3M and is ranked third in total Radio Spot spending this quarter. Category #2 Kroger Food Stores spent an additional 9% (to $24.6M) while Aldi Food Stores’ move from $0.5M to $11.4M catapulted them into the #3 category slot. Others who boosted their Spot spend are Giant Eagle Supermarket (+39%, to $9.6M), Albertson’s (+24%, to $7.0M), and Supervalu (+49%, to $6.2M). Casinos & Lottery Continuing an upward trend from year-end 2011, this category grew 7% in Q1 2012. State Lotteries continues to be a positive influence within the category (accounting for 59% of the total) and was up over a half-million dollars (+1%) but Casinos & Hotels is the driving force. If you have any questions, please email revenuereport@rab.com or call 212-681-7200. 3
  • 4. Across the Spot Radio markets, Casinos grew 17% - up $7.2M versus Q1 2011. Lead spender within this segment, Hard Rock Hotel & Casino grew 7% (+$400K). #2 and #3 Casino advertisers, Harrah’s Hotel & Casino and Caesar’s Hotel & Casino increased Q1 2012 spending 81% (+$2.8M) and 50% ($1.8M), respectively. Home Furnishings Ranked at #10, Home Furnishings has experienced its fifth consecutive quarter of growth with a 30% increase over Q1 2011 – up $26.5M. Mattress Firm, year-end 2011 category leader, started 2012 at the same position with $18.5M across the Spot Radio markets – up 60% versus Q1 2011. Mattress Firm has consistently held a top two position within the category since Q3 2009. The remaining top four spenders within the category were: Home Furnishings Q1 2012 vs. Q1 2011 Spot Radio (in Millions) Advertiser $FY '12 % Chg Select Comfort 15.6 49% Sleepy’s Mattress Store 11.0 4% Mattress Discounters 10.0 57% Sleep Train Mattress Center 8.0 3% Source: Miller, Kaplan, Arase & Co.: X-Ray Markets (Extrapolated dollar amounts based on the 40 market X-Ray pool may not be fully indicative of industry results as a whole.) Health Care Increased Spot Radio activity from various health care and service providers injected the quarter with 39% growth over Q1 2011 to $64.5M. With multiple locations in over 25 states, laser hair removal service provider Ideal Image topped Q1 2012 in the category at $14.7B – up 86% over Q1 2011. Kaiser Permanente, 2011 year-end category spend leader, placed an additional 9% (to $7.3M) in the first three months of 2012 versus same time period last year. If you have any questions, please email revenuereport@rab.com or call 212-681-7200. 4
  • 5. Political Overview While benefitting from activity in hotly contested markets, Radio saw only the tip of the iceberg in Q1 2012. Within the Miller Kaplan markets political spending from candidates, Issues, PACs, etc., totaled $6.9M for the quarter. Over half (55%, $3.7M) of these dollars were driven by PACs and various coalitions. The pro-Gingrich Super PAC, Winning our Future, topped the charts with $724K, followed by pro-Romney Super PAC, Restore Our Future, with $538K. Spending from various candidates accounted for 32% of the political dollars ($2.2M). Mitt Romney, the presumed Republican presidential candidate, and his committee, Romney for President, placed over $363K in the quarter – accounting for 16% of the subcategory. Political Insights from Leo Kivijarv, Ph.D., VP/Research, PQ Media Where was Q1 political spending for Radio? Was it driven by candidates, PACs, Issues, etc.? Political spending in Radio for Q1 showed some uptick but was not as high as some other media. Some Radio broadcasters experienced lifts in revenue but that was predominantly driven by the Republican Party PACs within the battleground states. With their incumbent running for re-election, the Democratic Party wasn’t active in a primary race in Q1, but spending will increase through the November general election date. What factors will influence increases in Radio spending? There will always be advertising for voter turnout in states where there are controversial issues. For example, education is always a big race driver in California. In many states, both sides of the issues will be putting money on Radio’s airwaves in states where voters will be deciding on one or two key issues, which in turn could impact the close candidate races in some DMAs. Which markets have or will see the greatest influx of political ads? Senate and House Races will have the greatest impact in political spending this year, with only 12 gubernatorial races, half of which are not contentious. Smaller DMAs, with only a few TV station competitors in the market, will see the strongest increase when contentious races merit a surge in spending by various PACs making TV inventory tight and candidates want to target key demos Radio offers. In larger DMAs, the increase won’t be as pronounced because of competition from the local cable MSOs when TV station inventory becomes tight. Post- Labor Day campaign activity will be on the rise as the battleground states for candidates and issues become more focused, generating a huge influx of spending for Radio stations, particularly those in DMAs with two or more hotly-contested races and/or issues. Where do you see Radio’s projected share at the end of this political year? It is still early to tell where total political spending will net out. However, we do anticipate that Radio will see double digit growth. Dr. Leo Kivijarv is a respected source of analysis for more than 100 news and trade sources including Bloomberg TV, NPR Radio, MSNBC, Fortune, Kiplinger’s, and Broadcasting & Cable. If you have any questions, please email revenuereport@rab.com or call 212-681-7200. 5
  • 6. Advertiser Category Analysis Q1 2012 Retail – Including Department & Discount Stores, Home Improvement Post-holiday spending within the retail category has traditionally curtailed during the first quarter of the year. Spot Radio spending within the Department & Discount Stores subcategory grew 1% to $75M. Walmart substantially increased Q1 2012 spending – up 36% to $17.8M – propelling it to the #1 slot. Sears increased spending as well – nearly three-fold over Q1 2011 to $9.3M. Top five spenders for the subcategory are: Q1 2012 Spending, Top 5 Department and Discount Stores (in Millions) Source: Miller, Kaplan, Arase & Co. Within the Home Improvement subcategory, Home Depot maintains its position as the top spender in Q1 2012 with $17.5M. Home Depot has maintained the top spot every quarter since Q1 2011. Lowe’s Cos., ranked at #2, remained relatively flat for the quarter. Retail was the top spending category across Network Radio’s airwaves in Q1 2012 – up 62% to $80.4M. Top five Department and Discount Store retailers collectively increased spending 88% - an additional $7.8M placed on Network Radio:  Macy’s – up 55% to $4.3M  Sears Holdings Corp. – up 142% to $4.3M  Walmart – up 85% to $3.3M  Kohl’s – up 49% to $2.5M  JC Penney Co., Inc. – up 168% to $2.2M Home Depot ranked #1 in Network Radio for the quarter in the Home Improvement sub-category at $11M (up 26%) followed by Lowes Cos. at $5.7M (up 81%). If you have any questions, please email revenuereport@rab.com or call 212-681-7200. 6
  • 7. Television/Networks/Cable Providers With total spot volume flat against last year, Television/Networks/Cable enjoys the #2 rank for Spot Radio in Q1, up from #3 same period 2011. Category top spender Comcast Xfinity Cable is also Radio’s leading Spot advertiser at $89.7M (+2% over Q1 ’11) while category #2 Fox TV Network ($39.6M) is ranked #9 across all categories this quarter. NBC-TV Network nearly doubled its Spot Radio commitment to $31.5M (+87%) to move into the #3 category rank this quarter. Also up significantly are Charter Communications Cable, +67%, to $18M and CBS-TV Network, +30% to $11.5M. Restaurants Leading Spot spenders in this category increased their Q1 Radio presence for the most part as they competed to attract consumers who are increasing their dining out events as the economy improves. Restaurant-category topper McDonald’s is Radio’s second-largest Spot advertiser this quarter at $87.6M. This expenditure is greater than the next four combined: Subway, $29.4M (+12% over Q1 2011); Taco Bell, $22.1M (-7%); Dunkin Donuts, $21.5M (+35%); and Wendy’s, $12.9M (+15%). Other spenders upping Q1 Spot Radio dollars are Buffalo Wild Wings, $10.8M (+14%); Bonefish Grill, $8M (+7%); and Firehouse Subs, $7.0M (+119%). Firehouse Subs, not on the air in Q1 2010 – cracked the top 25 at #24 in Q1 ’11 and moves into the #10 slot in category spending for Q1 ’12. Total Q1 Restaurant Spot spending was virtually flat, mainly reflecting cutbacks on the part of a number of third-tier advertisers compared to last year’s Q1. Many of these advertisers also increased their presence on Network Radio for the quarter. Subway, at #1 within the sector, increased spending 2% to $2.5M. The remaining top three advertisers were: Little Caesars Pizza Restaurant, $1.2M (versus no activity in Q1 2011); Buffalo Wild Wings Grill, $582K (+59%); and McDonald’s, $338K (+150%). Financial Services Spot spending among the Financial sector dipped approximately one-fifth versus Q1 2011, reflecting fluctuating signals in the U.S. economy. Bright spots in the Spot picture are Capital One (+61%, to $17M), Wells Fargo Bank (+21%, to $13.7M), and TD Bank Financial Group (from $0.4M to $11.9M). Services aimed at ”The 99%” also increased their Spot spending: Cash Call (+26%, to $6.9M), Consolidated Credit Counseling (+30%, to $4.8M), Ace Cash Express (+11%, to $3.0M), and Quicken Loans (up seven-fold, to $2.1M). Within the Network Radio sector, Wells Fargo increased Q1 2012 spending 168% over Q1 2011 to $2.3M. Capital One placed $264K compared to no activity in Q1 2011. Communications/Cellular Three of Radio’s top ten Spot spenders in Q1 2012 are Communications advertisers: Verizon Wireless (#4), AT&T (#6), and T-Mobile (#7). If you have any questions, please email revenuereport@rab.com or call 212-681-7200. 7
  • 8. Spot for this category is off by nearly one fourth and drops in rank from first to fourth in contrast with Q1 ’11. Recent activity has been affected by complicated merger proposals, as well as a lack of truly innovative new product rollouts that had occurred in prior years. Communications category spending has become much more competitive among the top five Spot advertisers, providing more balance and less reliance on revenue from any one account going forward. Q1 2012 Spending, Top 5 Communications/Cellular (in Millions) Source: Miller, Kaplan, Arase & Co. Insurance Companies The Insurance category’s Spot results are relatively flat against Q1 2011 despite heated competition among the auto insurers. The category holds the #6 rank in spot revenue for the quarter, also on par with last year. Radio’s #5 Spot advertiser GEICO leads this category, outspending all others by sizable amounts: Insurance 2012 vs. 2011 Spot Radio (in Millions) Advertiser $Q1 '12 % Chg GEICO 46.0 1% State Farm 24.3 217% American Family 23.9 75% Allstate Insurance 14.1 -1% Safe Auto Insurance 9.0 41% Source: Miller, Kaplan, Arase & Co.: X-Ray Markets (Extrapolated dollar amounts based on the 40 market X-Ray pool may not be fully indicative of industry results as a whole.) Within the Network Radio sector, this category experienced a 7% increase for the first three months of 2012 compared to the same time period last year. The following top three advertisers within the category collectively increased spending $7.9M:  GEICO – up 30% to $8.8M  Allstate Insurance – up 413% to $6.1M  Progressive – up 24% to $4.9M If you have any questions, please email revenuereport@rab.com or call 212-681-7200. 8
  • 9. Professional Services While the category was flat in Q1 2012, advertisers trying to reach consumers for tax preparation services contributed $6.3M to Spot Radio’s bottom line. H&R Block, the top spender within the category, increased first quarter spending 13% to $28.1M. Jackson Hewitt Tax Service increased spending 50% to $9.8M. Advertisers offering hair services also contributed to the Radio’s growth - by $2.1M collectively.  Great Clips – up 6% to $6.9M  Fantastic Sams – up 44% to $3.1M  Sport Clips – up 50% to $2.3M H&R Block also increased their presence on Network Radio - up 16% to $4.5M. Tax Resolution Services Co. spending also increased in Q1 2012 over Q1 2011 – a 92% spike to $1.5M. Specialty Retail With a 5% increase over Q1 2011, this category has now experienced its fifth consecutive quarter of growth. This category represents a diverse line-up of retailers targeting specific consumer segments. Significant spending increases by recognized advertisers such as PetSmart (up 94% to $3.1M) and Luxottica Group (up 27% to $2.8M) were just part of the reason for the category’s growth. Advertisers placing $12.4M in activity that were not present in Spot Radio in Q1 2011, and contributing to the categories growth were:  GameStop $3.4M  United Retail Group* $3.3M  Fingerhut $3.3M  Ulta Beauty Supply $2.4M *The Avenue Stores Spot Radio Advertiser Category analysis is based on data from Miller, Kaplan, Arase & Co. X-Ray Market Reports. X-Ray Market Reports are compiled from advertiser expenditure data direct from station billing in 35 markets, extrapolated to the entire U.S. Extrapolated dollar amounts may not be fully indicative of industry results as a whole. X-Ray Markets represent approximately 80% of the dollars from the pool of 100 markets. The lineup of markets/stations/networks may vary from year to year. Percent change is calculated on revenue adjusted to current year reporting. Network Radio Advertiser Category spending analysis is based on data from Kantar Media. PQ Media (www.pqmedia.com) is the leading provider of econometric research and consulting services to the media, entertainment and communications industries. PQ Media’s proprietary research methodology delivers actionable strategic intelligence to media companies, financiers, agencies, brands and consultants. PQ Media partners with private equity firm Veronis Suhler Stevenson on the VSS Communications Industry Forecast, the US industry’s benchmark for spending, usage and growth data for 25 years. For more information, contact Gabriella Kallay at gkallay@pqmedia.com or 203-921-0368. If you have any questions, please email revenuereport@rab.com or call 212-681-7200. 9