Back to-school spending grows as parents restock, replenish children’s needs
•
0 gostou•4,886 visualizações


Recomendados
Mais conteúdo relacionado
Semelhante a Back to-school spending grows as parents restock, replenish children’s needs
Semelhante a Back to-school spending grows as parents restock, replenish children’s needs (20)
Mais de 中文互联网数据研究资讯中心--199it
Mais de 中文互联网数据研究资讯中心--199it (20)
Último
Último (14)
Back to-school spending grows as parents restock, replenish children’s needs
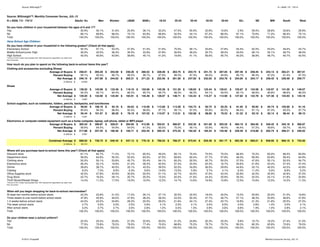
- 1. Source: BIGinsight™ N = 8509, 7/2 - 7/9/12 Source: BIGinsight™, Monthly Consumer Survey, JUL-12 N = 8509, 7/2 - 7/9/12 Adults 18+ Men Women <$50K $50K+ 18-24 25-34 35-44 45-54 55-64 65+ NE MW South West Do you have children in your household between the ages of 6 and 17? Yes 30.9% 30.1% 31.6% 25.9% 36.1% 33.2% 47.5% 55.9% 32.8% 10.6% 2.9% 29.4% 28.8% 33.6% 29.9% No 69.1% 69.9% 68.4% 74.1% 63.9% 66.8% 52.5% 44.1% 67.2% 89.4% 97.1% 70.6% 71.2% 66.4% 70.1% Total 100.0% 100.0% 100.0% 100.0% 100.0% 100.0% 100.0% 100.0% 100.0% 100.0% 100.0% 100.0% 100.0% 100.0% 100.0% Have School Age Children: Do you have children in your household in the following grades? (Check all that apply) Elementary School 50.3% 47.1% 53.2% 47.9% 51.0% 51.6% 75.5% 58.1% 33.6% 27.8% 54.4% 52.0% 53.0% 49.4% 43.7% Middle School/Junior High 35.0% 33.5% 36.3% 35.5% 33.9% 37.8% 35.6% 39.2% 35.7% 28.3% 33.0% 28.1% 35.1% 36.7% 38.0% High School 42.5% 40.9% 43.9% 39.8% 45.1% 41.2% 19.9% 41.1% 56.6% 55.7% 40.2% 38.9% 48.7% 40.7% 42.5% *The sum of the % totals may be greater than 100% because the respondents can select more than one answer. How much do you plan to spend on the following back-to-school items this year? Clothing and accessories (excluding Shoes) Average of Buyers $ 258.91 $ 265.29 $ 253.09 $ 230.26 $ 280.52 $ 228.09 $ 263.75 $ 254.74 $ 241.72 $ 267.65 $ 297.49 $ 258.45 $ 243.13 $ 262.21 $ 267.01 Percent Buying 95.1% 93.4% 96.7% 89.2% 96.7% 97.6% 99.3% 97.3% 96.0% 94.8% 85.7% 98.3% 97.2% 91.4% 97.3% Net Average $ 246.10 $ 247.66 $ 244.63 $ 205.31 $ 271.22 $ 222.56 $ 261.90 $ 247.92 $ 232.02 $ 253.78 $ 254.85 $ 254.17 $ 236.42 $ 239.59 $ 259.77 in billions $ 10.833 Shoes Average of Buyers $ 138.52 $ 143.99 $ 133.48 $ 119.19 $ 152.06 $ 145.38 $ 151.20 $ 138.62 $ 122.44 $ 120.81 $ 155.67 $ 124.58 $ 132.97 $ 141.05 $ 149.07 Percent Buying 93.3% 92.1% 94.4% 86.3% 95.7% 95.7% 98.3% 96.3% 94.1% 93.5% 82.1% 98.6% 95.8% 88.6% 96.0% Net Average $ 129.20 $ 132.66 $ 125.94 $ 102.91 $ 145.49 $ 139.07 $ 148.71 $ 133.43 $ 115.27 $ 112.90 $ 127.82 $ 122.78 $ 127.38 $ 124.93 $ 143.18 in billions $ 5.687 School supplies, such as notebooks, folders, pencils, backpacks, and lunchboxes Average of Buyers $ 99.84 $ 108.19 $ 92.18 $ 84.63 $ 110.58 $ 113.60 $ 113.58 $ 104.73 $ 92.72 $ 83.25 $ 91.92 $ 95.92 $ 94.74 $ 105.60 $ 91.16 Percent Buying 95.6% 94.3% 96.9% 92.4% 96.8% 97.7% 99.1% 97.5% 95.8% 95.5% 88.4% 97.1% 97.3% 93.2% 97.7% Net Average $ 95.44 $ 101.97 $ 89.29 $ 78.19 $ 107.02 $ 110.97 $ 112.51 $ 102.08 $ 88.85 $ 79.53 $ 81.22 $ 93.18 $ 92.14 $ 98.44 $ 89.10 in billions $ 4.201 Electronics or computer-related equipment such as a home computer, laptop, cell phone, tablet or MP3 player Average of Buyers $ 365.54 $ 398.87 $ 328.61 $ 294.95 $ 412.06 $ 355.81 $ 366.87 $ 342.35 $ 341.69 $ 303.55 $ 494.10 $ 384.50 $ 340.42 $ 345.18 $ 366.87 Percent Buying 59.6% 64.5% 54.9% 54.5% 61.3% 83.0% 75.0% 56.1% 53.9% 48.0% 46.4% 57.2% 59.6% 59.7% 65.4% Net Average $ 217.88 $ 257.45 $ 180.56 $ 160.71 $ 252.45 $ 295.43 $ 275.25 $ 192.20 $ 184.34 $ 145.56 $ 229.49 $ 219.88 $ 202.74 $ 206.21 $ 240.02 in billions $ 9.591 Combined Average $ 688.62 $ 739.75 $ 640.42 $ 547.12 $ 776.18 $ 768.03 $ 798.37 $ 675.64 $ 620.48 $ 591.77 $ 693.38 $ 690.01 $ 658.68 $ 669.16 $ 732.06 in billions $ 30.312 Where will you purchase back-to-school items this year? (Check all that apply) Discount store 67.1% 62.7% 71.2% 73.1% 65.5% 49.2% 65.1% 70.4% 75.5% 70.3% 66.9% 70.2% 65.0% 68.4% 60.9% Department store 59.9% 64.8% 55.3% 52.6% 63.5% 67.5% 69.6% 60.4% 57.7% 57.8% 48.3% 56.9% 63.8% 59.4% 64.9% Clothing store 52.0% 50.1% 53.8% 45.7% 55.4% 64.1% 65.2% 52.5% 45.7% 50.3% 37.5% 47.6% 55.1% 52.2% 54.7% Electronics store 26.3% 33.1% 19.9% 21.0% 28.3% 40.5% 37.3% 23.3% 22.3% 16.7% 20.6% 21.6% 24.4% 27.4% 37.4% Online 39.6% 38.7% 40.5% 33.1% 43.5% 39.5% 52.2% 34.9% 36.0% 29.9% 44.6% 33.1% 40.0% 42.2% 43.9% Catalog 8.2% 7.3% 8.9% 6.3% 9.6% 14.9% 13.5% 5.9% 5.7% 4.1% 6.3% 11.2% 5.0% 8.9% 5.2% Office Supplies store 42.0% 37.8% 45.9% 30.6% 50.5% 51.1% 42.7% 43.5% 47.0% 43.4% 25.9% 42.0% 45.9% 42.9% 37.0% Drug Store 22.7% 16.0% 29.1% 20.7% 25.0% 15.2% 22.0% 21.6% 24.4% 20.9% 30.3% 22.5% 23.1% 21.8% 22.8% Thrift Stores/Resale Shops 14.4% 11.2% 17.5% 19.5% 10.0% 12.5% 14.7% 13.6% 16.9% 15.8% 12.5% 15.6% 12.5% 14.2% 11.3% *The sum of the % totals may be greater than 100% because the respondents can select more than one answer. When will you begin shopping for back-to-school merchandise? At least two months before school starts 22.3% 23.8% 21.0% 17.2% 26.1% 27.1% 32.5% 22.0% 18.0% 20.5% 15.2% 25.8% 22.0% 21.0% 18.8% Three weeks to one month before school starts 47.8% 45.9% 49.5% 47.6% 48.2% 39.4% 43.3% 50.3% 47.7% 46.7% 57.1% 48.3% 53.9% 46.6% 47.8% 1-2 weeks before school starts 24.0% 23.2% 24.8% 29.2% 20.5% 29.2% 21.6% 24.1% 27.4% 23.7% 18.8% 21.3% 21.8% 25.5% 27.3% The week school starts 2.7% 3.5% 2.0% 2.5% 2.6% 3.1% 2.2% 2.1% 3.0% 6.5% 0.0% 2.8% 1.4% 3.0% 4.1% After school starts 3.2% 3.7% 2.7% 3.5% 2.6% 1.2% 0.4% 1.5% 3.9% 2.6% 8.9% 1.9% 1.0% 3.9% 2.1% Total 100.0% 100.0% 100.0% 100.0% 100.0% 100.0% 100.0% 100.0% 100.0% 100.0% 100.0% 100.0% 100.0% 100.0% 100.0% Do your children wear a school uniform? Yes 22.5% 24.2% 20.8% 21.0% 22.6% 30.0% 31.2% 24.8% 20.3% 20.3% 9.8% 19.7% 16.2% 27.4% 21.0% No 77.5% 75.8% 79.2% 79.0% 77.4% 70.0% 68.8% 75.2% 79.7% 79.7% 90.2% 80.3% 83.8% 72.6% 79.0% Total 100.0% 100.0% 100.0% 100.0% 100.0% 100.0% 100.0% 100.0% 100.0% 100.0% 100.0% 100.0% 100.0% 100.0% 100.0% © 2012, Prosper® 1 Monthly Consumer Survey, JUL-12
- 2. Source: BIGinsight™ N = 8509, 7/2 - 7/9/12 Source: BIGinsight™, Monthly Consumer Survey, JUL-12 N = 8509, 7/2 - 7/9/12 Adults 18+ Men Women <$50K $50K+ 18-24 25-34 35-44 45-54 55-64 65+ NE MW South West How many children in your household are teenagers (13-17 years of age)? 0 32.8% 31.6% 34.0% 35.9% 31.9% 28.4% 50.2% 37.6% 23.4% 27.2% 29.3% 39.8% 31.2% 31.6% 30.3% 1 49.0% 48.3% 49.7% 43.2% 51.2% 44.3% 35.5% 41.6% 59.5% 60.2% 52.1% 45.5% 51.7% 49.4% 48.9% 2 14.5% 15.6% 13.5% 17.2% 13.6% 22.8% 8.9% 16.1% 14.5% 10.5% 15.7% 11.0% 13.8% 16.5% 16.8% 3 2.5% 2.8% 2.2% 2.6% 2.3% 3.1% 3.8% 3.9% 2.2% 2.0% 0.0% 2.9% 2.7% 2.0% 3.0% 4 or more 1.2% 1.8% 0.6% 1.1% 1.1% 1.5% 1.5% 0.8% 0.4% 0.0% 2.9% 0.8% 0.5% 0.6% 1.0% Total 100.0% 100.0% 100.0% 100.0% 100.0% 100.0% 100.0% 100.0% 100.0% 100.0% 100.0% 100.0% 100.0% 100.0% 100.0% If you have teenagers, how much of their own money do they plan to spend on back-to-school items? Average of Buyers $ 85.19 $ 91.40 $ 76.37 $ 63.18 $ 95.84 $ 83.62 $ 108.45 $ 93.83 $ 74.38 $ 76.25 $ 75.50 $ 88.72 $ 92.02 $ 76.93 $ 98.91 Percent Buying 42.8% 51.8% 34.3% 44.0% 43.5% 51.6% 43.0% 36.2% 40.1% 40.7% 47.6% 41.0% 44.3% 39.9% 51.5% Net Average $ 36.48 $ 47.35 $ 26.22 $ 27.80 $ 41.67 $ 43.18 $ 46.61 $ 33.96 $ 29.82 $ 31.07 $ 35.95 $ 36.40 $ 40.73 $ 30.69 $ 50.95 in billions $ 1.079 How many children in your household are pre-teens (6-12 years of age)? 0 36.8% 39.1% 34.7% 37.9% 36.5% 36.5% 13.8% 26.9% 51.9% 56.7% 35.8% 35.3% 38.6% 37.1% 36.6% 1 43.3% 41.7% 44.8% 43.9% 44.0% 45.0% 60.4% 47.7% 33.0% 34.6% 39.2% 49.7% 41.1% 42.4% 40.1% 2 15.1% 14.3% 15.8% 12.6% 15.8% 14.0% 20.2% 20.6% 12.3% 6.6% 16.1% 11.4% 16.5% 16.1% 16.2% 3 3.1% 3.0% 3.2% 3.1% 2.8% 2.9% 4.9% 3.6% 2.4% 2.1% 2.7% 2.8% 3.0% 4.0% 1.7% 4 or more 1.7% 1.9% 1.5% 2.5% 0.9% 1.6% 0.7% 1.2% 0.4% 0.0% 6.3% 0.8% 0.8% 0.4% 5.4% Total 100.0% 100.0% 100.0% 100.0% 100.0% 100.0% 100.0% 100.0% 100.0% 100.0% 100.0% 100.0% 100.0% 100.0% 100.0% If you have pre-teens, how much of their own money do they plan to spend on back-to-school items? Average of Buyers $ 79.33 $ 88.24 $ 68.19 $ 66.96 $ 86.99 $ 75.72 $ 104.49 $ 91.26 $ 55.31 $ 65.97 $ 67.83 $ 65.09 $ 76.27 $ 77.37 $ 78.02 Percent Buying 32.3% 37.0% 27.9% 28.0% 33.5% 39.3% 43.4% 28.1% 23.1% 25.4% 36.4% 36.8% 31.5% 27.7% 36.0% Net Average $ 25.63 $ 32.65 $ 19.01 $ 18.76 $ 29.18 $ 29.77 $ 45.37 $ 25.67 $ 12.80 $ 16.78 $ 24.67 $ 23.95 $ 24.03 $ 21.45 $ 28.10 in billions $ 0.713 What percentage of back-to-school spending is a direct result of your child's influence? 0% 8.7% 9.4% 8.0% 8.7% 8.3% 7.0% 6.1% 9.3% 6.9% 13.8% 9.3% 7.3% 9.6% 9.8% 5.7% 25% 27.9% 27.1% 28.6% 36.2% 22.8% 25.0% 30.5% 30.0% 26.5% 21.2% 32.8% 27.7% 21.7% 29.5% 28.1% 50% 35.8% 38.1% 33.7% 31.0% 38.2% 35.9% 37.3% 32.5% 34.7% 33.0% 41.5% 41.6% 35.2% 33.1% 36.8% 75% 20.3% 19.8% 20.8% 17.9% 22.2% 23.0% 18.9% 21.9% 24.6% 20.5% 12.9% 16.9% 22.4% 21.1% 22.3% 100% 7.4% 5.7% 8.9% 6.2% 8.5% 9.1% 7.2% 6.3% 7.4% 11.4% 3.6% 6.5% 11.0% 6.5% 7.0% Total 100.0% 100.0% 100.0% 100.0% 100.0% 100.0% 100.0% 100.0% 100.0% 100.0% 100.0% 100.0% 100.0% 100.0% 100.0% How will the state of the U.S. economy impact your back-to-school plans? (Check all that apply) Buying more store brand/generic products 37.0% 36.1% 37.7% 44.6% 32.0% 46.4% 42.1% 34.5% 38.3% 27.8% 33.9% 37.7% 35.7% 38.1% 38.6% Doing more comparative shopping online 32.1% 34.1% 30.1% 29.8% 33.0% 31.7% 43.3% 32.1% 32.0% 28.4% 24.1% 26.7% 39.3% 31.6% 33.3% Doing more comparative shopping with ad circulars/newspapers 35.9% 32.3% 39.4% 36.0% 35.2% 27.2% 36.8% 34.9% 39.5% 40.3% 34.8% 29.7% 48.1% 35.6% 33.2% Making do with last year's school items 25.8% 23.1% 28.4% 27.9% 25.4% 26.8% 24.6% 25.3% 27.0% 23.5% 27.7% 20.0% 30.3% 24.4% 32.4% Shopping for sales more often 51.1% 47.0% 55.0% 57.7% 48.0% 48.6% 50.3% 47.5% 52.4% 48.0% 58.9% 50.8% 59.0% 49.0% 49.6% Shopping more online 17.9% 18.9% 17.0% 17.3% 18.5% 21.6% 26.9% 17.4% 15.0% 13.7% 13.4% 15.5% 16.6% 17.9% 24.7% Spending less overall 37.8% 33.7% 41.6% 42.9% 33.9% 36.4% 29.4% 35.5% 42.8% 39.1% 42.9% 40.2% 40.3% 33.5% 42.3% Using coupons more 35.8% 32.5% 39.0% 39.9% 33.8% 37.8% 39.7% 38.1% 35.0% 33.4% 31.3% 36.8% 40.3% 36.1% 28.6% The economy is impacting whether children will attend private or public school 6.5% 7.6% 5.5% 6.7% 6.1% 11.8% 10.8% 6.2% 5.2% 3.4% 2.7% 7.8% 7.5% 5.9% 5.5% Postponing educational investments (i.e. family computer) 6.3% 7.1% 5.6% 6.1% 6.5% 9.7% 7.4% 4.9% 6.5% 4.7% 5.4% 7.2% 7.0% 5.1% 6.4% Cutting back on extracurricular activities or sports 11.0% 10.6% 11.3% 11.9% 9.3% 12.6% 13.3% 10.6% 10.5% 10.1% 8.9% 10.1% 12.3% 10.5% 13.5% Other (please specify) 0.8% 0.8% 0.7% 0.9% 0.6% 1.4% 0.8% 1.2% 1.1% 0.0% 0.0% 0.5% 0.6% 1.1% 0.5% Back-to-school plans will not change 15.2% 17.2% 13.2% 9.4% 19.4% 11.9% 10.7% 14.9% 16.0% 22.2% 15.2% 14.3% 13.6% 17.0% 11.1% *The sum of the % totals may be greater than 100% because the respondents can select more than one answer. © 2012, Prosper® 2 Monthly Consumer Survey, JUL-12
- 3. Source: BIGinsight™ Back-to-School 2012 Source: BIGinsight™, Monthly Consumer Survey, JUL 07-12 2007 2008 2009 2010 2011 2012 Do you have children in your household between the ages of 6 and 17? Yes 24.1% 24.7% 23.0% 25.2% 26.8% 30.9% No 75.9% 75.3% 77.0% 74.8% 73.2% 69.1% Total 100.0% 100.0% 100.0% 100.0% 100.0% 100.0% Do you have children in your household in the following grades? (Check all that apply) Elementary School 45.3% 52.2% 47.3% 46.4% 43.8% 50.3% Middle School/Junior High 32.8% 33.8% 32.1% 31.7% 31.9% 35.0% High School 43.1% 43.9% 45.2% 42.6% 47.1% 42.5% *The sum of the % totals may be greater than 100% because the respondents can select more than one answer. How much do you plan to spend on the following back-to-school items this year? Clothing and accessories (excluding Shoes) Average of Buyers $ 242.98 $ 247.32 $ 217.40 $ 233.74 $ 236.70 $ 258.91 Percent Buying 95.4% 94.8% 94.1% 96.5% 93.2% 95.1% Net Average $ 231.80 $ 234.51 $ 204.67 $ 225.47 $ 220.60 $ 246.10 in billions $ 7.569 $ 7.922 $ 6.499 $ 7.939 $ 8.333 $ 10.833 Shoes Average of Buyers $ 116.43 $ 117.29 $ 100.92 $ 108.32 $ 113.72 $ 138.52 Percent Buying 93.1% 93.6% 92.7% 95.0% 91.9% 93.3% Net Average $ 108.42 $ 109.75 $ 93.59 $ 102.93 $ 104.53 $ 129.20 in billions $ 3.540 $ 3.708 $ 2.972 $ 3.624 $ 3.949 $ 5.687 School supplies, such as notebooks, folders, pencils, backpacks, and lunchboxes Average of Buyers $ 98.44 $ 102.55 $ 87.41 $ 99.32 $ 96.04 $ 99.84 Percent Buying 95.5% 95.9% 94.5% 97.0% 92.7% 95.6% Net Average $ 94.02 $ 98.37 $ 82.62 $ 96.39 $ 88.99 $ 95.44 in billions $ 3.070 $ 3.323 $ 2.624 $ 3.394 $ 3.361 $ 4.201 Electronics or computer-related equipment such as a home computer, laptop, handheld organizer, or calculator Average of Buyers $ 222.58 $ 259.66 $ 293.80 $ 285.21 $ 365.48 $ 365.54 Percent Buying 58.1% 58.4% 57.1% 63.7% 51.9% 59.6% Net Average $ 129.24 $ 151.61 $ 167.84 $ 181.61 $ 189.51 $ 217.88 in billions $ 4.220 $ 5.122 $ 5.330 $ 6.395 $ 7.159 $ 9.591 Combined Average $ 563.49 $ 594.24 $ 548.72 $ 606.40 $ 603.63 $ 688.62 in billions $ 18.400 $ 20.075 $ 17.424 $ 21.352 $ 22.801 $ 30.312 Where will you purchase back-to-school items this year? (Check all that apply) Discount store 67.6% 73.0% 74.5% 71.2% 68.4% 67.1% Department store 54.9% 56.6% 54.4% 53.9% 57.0% 59.9% Clothing store NA 47.8% 48.4% 49.0% 48.7% 52.0% Electronics store NA 21.4% 20.8% 23.0% 21.7% 26.3% Specialty store, such as a clothing or electronics store 31.6% NA NA NA NA NA Online 21.4% 24.8% 22.2% 30.8% 31.7% 39.6% Catalog 7.2% 8.5% 7.9% 8.7% 8.6% 8.2% Office Supplies store 41.4% 41.8% 41.2% 41.2% 38.0% 42.0% Drug Store 17.9% 18.2% 21.5% 19.5% 21.1% 22.7% Thrift Stores/Resale Shops NA NA 18.2% 17.0% 16.1% 14.4% *The sum of the % totals may be greater than 100% because the respondents can select more than one answer. When will you begin shopping for back-to-school merchandise? At least two months before school starts 14.6% 17.4% 18.1% 21.6% 21.8% 22.3% Three weeks to one month before school starts 45.2% 46.4% 44.4% 47.6% 42.4% 47.8% © 2012, Prosper® 3 Monthly Consumer Survey, JUL 07-12
- 4. Source: BIGinsight™ Back-to-School 2012 Source: BIGinsight™, Monthly Consumer Survey, JUL 07-12 2007 2008 2009 2010 2011 2012 1-2 weeks before school starts 32.1% 30.5% 31.8% 24.8% 31.2% 24.0% The week school starts 5.4% 3.8% 3.2% 3.0% 2.0% 2.7% After school starts 2.7% 1.9% 2.5% 3.0% 2.6% 3.2% Total 100.0% 100.0% 100.0% 100.0% 100.0% 100.0% Do your children wear a school uniform? Yes 15.8% 17.8% 19.2% 20.2% 18.4% 22.5% No 84.2% 82.2% 80.8% 79.8% 81.6% 77.5% Total 100.0% 100.0% 100.0% 100.0% 100.0% 100.0% How many children in your household are teenagers (13-17 years of age)? 0 38.0% 38.1% 38.7% 39.0% 33.9% 32.8% 1 43.7% 47.2% 45.1% 45.7% 47.3% 49.0% 2 12.3% 11.9% 13.3% 12.5% 14.3% 14.5% 3 5.3% 2.4% 2.1% 2.0% 3.3% 2.5% 4 or more 0.7% 0.3% 0.9% 0.8% 1.2% 1.2% Total 100.0% 100.0% 100.0% 100.0% 100.0% 100.0% If you have teenagers, how much of their own money do they plan to spend on back-to-school items? Average of Buyers $ 72.32 $ 64.53 $ 78.59 $ 81.49 $ 83.52 $ 85.19 Percent Buying 43.1% 40.7% 39.3% 39.0% 37.9% 42.8% Net Average $ 31.19 $ 26.29 $ 30.88 $ 31.74 $ 31.64 $ 36.48 in billions $ 0.596 $ 0.549 $ 0.601 $ 0.682 $ 0.790 $ 1.079 How many children in your household are pre-teens (6-12 years of age)? 0 42.2% 37.7% 42.8% 40.0% 41.7% 36.8% 1 41.0% 47.2% 40.1% 42.7% 41.6% 43.3% 2 13.4% 13.0% 14.1% 13.7% 12.7% 15.1% 3 2.6% 1.7% 2.7% 2.2% 2.7% 3.1% 4 or more 0.7% 0.4% 0.4% 1.4% 1.3% 1.7% Total 100.0% 100.0% 100.0% 100.0% 100.0% 100.0% If you have pre-teens, how much of their own money do they plan to spend on back-to-school items? Average of Buyers $ 47.21 $ 50.23 $ 47.35 $ 68.25 $ 62.50 $ 79.33 Percent Buying 32.6% 22.8% 25.2% 26.8% 24.2% 32.3% Net Average $ 15.38 $ 11.44 $ 11.94 $ 18.27 $ 15.12 $ 25.63 in billions $ 0.299 $ 0.241 $ 0.217 $ 0.386 $ 0.333 $ 0.713 What percentage of back-to-school spending is a direct result of your child's influence? 0% 11.3% 12.6% 12.3% 9.8% 10.6% 8.7% 25% 30.9% 32.9% 33.5% 29.0% 28.2% 27.9% 50% 31.1% 30.1% 30.3% 31.1% 34.2% 35.8% 75% 20.6% 17.0% 17.1% 22.8% 21.3% 20.3% 100% 6.1% 7.4% 6.7% 7.2% 5.7% 7.4% Total 100.0% 100.0% 100.0% 100.0% 100.0% 100.0% How will the state of the U.S. economy impact your back-to-school plans? (Check all that apply) Buying more store brand/generic products NA NA 41.7% 44.3% 39.9% 37.0% Doing more comparative shopping online NA NA 26.4% 30.3% 29.8% 32.1% Doing more comparative shopping with ad circulars/newspapers NA NA 42.5% 38.5% 37.0% 35.9% Making do with last year's school items NA NA 35.1% 29.8% 28.3% 25.8% Shopping for sales more often NA NA 56.2% 53.3% 50.0% 51.1% Shopping more online NA NA 9.6% 12.3% 15.3% 17.9% © 2012, Prosper® 4 Monthly Consumer Survey, JUL 07-12
- 5. Source: BIGinsight™ Back-to-School 2012 Source: BIGinsight™, Monthly Consumer Survey, JUL 07-12 2007 2008 2009 2010 2011 2012 Spending less overall NA NA 49.6% 42.6% 43.7% 37.8% Using coupons more NA NA 40.0% 36.8% 36.9% 35.8% The economy is impacting whether children will attend private or public school NA NA 5.7% 8.1% 5.3% 6.5% Postponing educational investments (ie: family computer) NA NA 6.8% 6.8% 6.0% 6.3% Cutting back on extracurricular activities or sports NA NA 11.4% 13.3% 10.2% 11.0% Back-to-school plans will not change NA NA 14.9% 14.3% 13.9% 15.2% Other: NA NA 2.3% 1.5% 1.7% 0.8% *The sum of the % totals may be greater than 100% because the respondents can select more than one answer. © 2012, Prosper® 5 Monthly Consumer Survey, JUL 07-12
- 6. Source: BIGinsight™ N = 8509, 7/2 - 7/9/12 Source: BIGinsight™, Monthly Consumer Survey, JUL-12 N = 8509, 7/2 - 7/9/12 Adults 18+ Men Women <$50K $50K+ 18-24 25-34 35-44 45-54 55-64 65+ NE MW South West Do you have child/dependent attending college this fall? Yes 12.3% 12.6% 12.0% 9.0% 15.5% 21.6% 10.1% 11.9% 19.7% 9.5% 2.1% 12.9% 12.2% 11.8% 12.3% No 87.7% 87.4% 88.0% 91.0% 84.5% 78.4% 89.9% 88.1% 80.3% 90.5% 97.9% 87.1% 87.8% 88.2% 87.7% Total 100.0% 100.0% 100.0% 100.0% 100.0% 100.0% 100.0% 100.0% 100.0% 100.0% 100.0% 100.0% 100.0% 100.0% 100.0% Will you be attending college this fall? Yes 14.3% 15.6% 13.0% 15.6% 11.3% 54.6% 22.6% 10.3% 4.7% 1.8% 1.0% 13.4% 12.4% 15.1% 15.2% No 85.7% 84.4% 87.0% 84.4% 88.7% 45.4% 77.4% 89.7% 95.3% 98.2% 99.0% 86.6% 87.6% 84.9% 84.8% Total 100.0% 100.0% 100.0% 100.0% 100.0% 100.0% 100.0% 100.0% 100.0% 100.0% 100.0% 100.0% 100.0% 100.0% 100.0% If you will be attending college, which year will you begin? Freshman 21.5% 19.1% 23.8% 25.1% 16.5% 27.7% 22.5% 17.3% 27.5% 11.9% 22.2% 19.1% 38.7% 15.6% 33.3% Sophomore 14.1% 14.6% 13.7% 16.2% 10.2% 25.5% 15.6% 16.9% 18.7% 9.6% 0.0% 10.0% 9.8% 17.4% 15.5% Junior 18.8% 25.5% 12.6% 20.7% 17.9% 18.9% 18.0% 23.5% 17.0% 13.6% 21.6% 8.4% 11.5% 24.7% 20.7% Senior 11.3% 14.1% 8.7% 8.3% 12.7% 15.4% 13.9% 11.1% 11.9% 4.8% 10.8% 12.0% 8.6% 10.0% 7.0% Grad School/Law School/Med School/Other 34.2% 26.7% 41.4% 29.8% 42.8% 12.4% 29.9% 31.1% 24.9% 60.0% 45.5% 50.5% 31.4% 32.2% 23.6% Total 100.0% 100.0% 100.0% 100.0% 100.0% 100.0% 100.0% 100.0% 100.0% 100.0% 100.0% 100.0% 100.0% 100.0% 100.0% Have a Child/Dependent Attending College or Yourself Attending College: How much do you plan to spend on the following back-to-college items this year? Clothing and accessories (excluding Shoes) Average of Buyers $ 179.20 $ 175.50 $ 182.67 $ 176.48 $ 188.07 $ 143.28 $ 146.52 $ 165.69 $ 173.61 $ 183.19 $ 280.50 $ 174.47 $ 179.14 $ 173.80 $ 180.47 Percent Buying 74.2% 74.0% 74.4% 73.3% 74.9% 93.5% 86.7% 73.8% 69.6% 59.2% 66.0% 76.3% 68.7% 72.0% 79.2% Net Average $ 132.97 $ 129.88 $ 135.90 $ 129.35 $ 140.83 $ 133.98 $ 126.96 $ 122.21 $ 120.90 $ 108.36 $ 185.11 $ 133.06 $ 123.10 $ 125.16 $ 142.87 in billions $ 7.83 Shoes Average of Buyers $ 106.78 $ 109.01 $ 104.67 $ 96.59 $ 116.04 $ 93.23 $ 104.44 $ 123.24 $ 89.04 $ 89.18 $ 136.83 $ 100.66 $ 98.77 $ 101.84 $ 113.66 Percent Buying 71.0% 70.9% 71.1% 69.7% 71.9% 88.3% 82.9% 70.0% 64.5% 54.2% 69.1% 77.0% 64.9% 66.8% 75.2% Net Average $ 75.81 $ 77.32 $ 74.38 $ 67.28 $ 83.46 $ 82.33 $ 86.55 $ 86.28 $ 57.47 $ 48.37 $ 94.57 $ 77.55 $ 64.11 $ 68.03 $ 85.43 in billions $ 4.47 Collegiate Branded Gear or Supplies (apparel, bumper stickers, etc.) Average of Buyers $ 99.50 $ 98.92 $ 100.11 $ 84.52 $ 111.22 $ 80.37 $ 103.72 $ 114.57 $ 79.77 $ 69.89 $ 132.51 $ 85.06 $ 90.62 $ 87.06 $ 126.68 Percent Buying 53.1% 56.4% 50.1% 53.0% 54.2% 69.1% 70.3% 55.0% 42.8% 33.2% 51.3% 49.2% 52.3% 56.1% 51.4% Net Average $ 52.87 $ 55.75 $ 50.15 $ 44.83 $ 60.25 $ 55.55 $ 72.89 $ 62.98 $ 34.11 $ 23.19 $ 67.93 $ 41.87 $ 47.41 $ 48.82 $ 65.15 in billions $ 3.11 School supplies, such as notebooks, folders, pencils, and backpacks Average of Buyers $ 89.06 $ 94.94 $ 83.69 $ 84.32 $ 95.63 $ 89.01 $ 84.65 $ 86.66 $ 79.02 $ 75.65 $ 120.11 $ 84.06 $ 95.23 $ 88.17 $ 89.16 Percent Buying 85.0% 83.6% 86.4% 86.0% 83.2% 97.7% 94.8% 90.8% 80.9% 70.2% 77.7% 88.9% 83.5% 83.6% 85.2% Net Average $ 75.73 $ 79.39 $ 72.29 $ 72.52 $ 79.56 $ 86.97 $ 80.29 $ 78.65 $ 63.90 $ 53.10 $ 93.28 $ 74.69 $ 79.52 $ 73.72 $ 76.00 in billions $ 4.46 Electronics or computer-related equipment such as a home computer, laptop, tablet, cell phone, digital camera or MP3 player Average of Buyers $ 400.64 $ 385.03 $ 417.58 $ 343.69 $ 439.96 $ 351.82 $ 319.19 $ 368.20 $ 391.82 $ 470.44 $ 580.71 $ 375.91 $ 459.63 $ 335.95 $ 449.42 Percent Buying 54.0% 57.9% 50.3% 52.4% 54.5% 73.2% 75.3% 57.6% 40.3% 28.1% 52.8% 46.9% 54.4% 53.4% 57.5% Net Average $ 216.40 $ 223.00 $ 210.18 $ 180.02 $ 239.84 $ 257.68 $ 240.50 $ 212.09 $ 157.71 $ 132.30 $ 306.58 $ 176.18 $ 249.90 $ 179.36 $ 258.36 in billions $ 12.75 Dorm or apartment furnishings like bedspreads, posters, answering machine, or microwave/fridge Average of Buyers $ 214.45 $ 207.23 $ 222.38 $ 188.38 $ 226.57 $ 201.09 $ 194.40 $ 219.11 $ 191.75 $ 219.62 $ 271.97 $ 194.21 $ 242.92 $ 214.49 $ 212.34 Percent Buying 46.8% 50.5% 43.3% 42.2% 49.7% 69.6% 58.9% 44.0% 39.4% 28.4% 44.7% 45.2% 43.8% 46.2% 49.4% Net Average $ 100.27 $ 104.57 $ 96.22 $ 79.56 $ 112.70 $ 139.90 $ 114.48 $ 96.34 $ 75.59 $ 62.42 $ 121.48 $ 87.73 $ 106.44 $ 99.17 $ 104.94 in billions $ 5.91 Food items, such as snacks, beverages, etc. Average of Buyers $ 144.95 $ 149.66 $ 141.00 $ 118.10 $ 159.72 $ 149.50 $ 133.97 $ 129.77 $ 146.01 $ 133.39 $ 184.53 $ 124.47 $ 136.39 $ 137.97 $ 173.65 Percent Buying 69.1% 65.0% 73.0% 70.7% 66.5% 91.9% 83.1% 70.1% 62.5% 55.9% 55.8% 69.1% 69.9% 68.4% 69.1% Net Average $ 100.18 $ 97.30 $ 102.88 $ 83.55 $ 106.28 $ 137.36 $ 111.32 $ 90.97 $ 91.22 $ 74.60 $ 103.06 $ 86.04 $ 95.30 $ 94.38 $ 119.94 in billions $ 5.90 Personal care items, such as skin care, hair care, oral care, makeup, OTC medicine, etc. Average of Buyers $ 109.98 $ 109.29 $ 110.56 $ 93.23 $ 120.00 $ 92.71 $ 117.68 $ 109.61 $ 91.51 $ 94.57 $ 150.77 $ 104.62 $ 114.76 $ 96.47 $ 119.53 Percent Buying 74.3% 69.7% 78.7% 75.9% 73.0% 92.0% 87.4% 76.9% 67.6% 57.7% 67.5% 72.9% 69.1% 76.6% 77.4% Net Average $ 81.76 $ 76.15 $ 87.05 $ 70.76 $ 87.65 $ 85.30 $ 102.90 $ 84.29 $ 61.87 $ 54.55 $ 101.80 $ 76.27 $ 79.24 $ 73.88 $ 92.51 © 2012, Prosper® 1 Monthly Consumer Survey, JUL-12
- 7. Source: BIGinsight™ N = 8509, 7/2 - 7/9/12 Source: BIGinsight™, Monthly Consumer Survey, JUL-12 N = 8509, 7/2 - 7/9/12 Adults 18+ Men Women <$50K $50K+ 18-24 25-34 35-44 45-54 55-64 65+ NE MW South West in billions $ 4.82 Gift Cards or Pre-Paid Cards Average of Buyers $ 187.85 $ 187.80 $ 187.91 $ 158.25 $ 210.83 $ 139.57 $ 165.04 $ 183.09 $ 172.24 $ 185.98 $ 333.19 $ 196.83 $ 185.68 $ 180.74 $ 183.09 Percent Buying 37.9% 42.1% 34.0% 33.1% 40.5% 47.4% 56.0% 43.6% 30.7% 24.8% 26.4% 41.2% 34.6% 37.1% 39.3% Net Average $ 71.23 $ 79.06 $ 63.85 $ 52.46 $ 85.32 $ 66.15 $ 92.45 $ 79.81 $ 52.96 $ 46.04 $ 87.95 $ 81.07 $ 64.26 $ 67.06 $ 71.99 in billions $ 4.20 Combined Average $ 907.22 $ 922.41 $ 892.90 $ 780.34 $ 995.89 $ 1,045.22 $ 1,028.36 $ 913.61 $ 715.72 $ 602.93 $ 1,161.78 $ 834.46 $ 909.28 $ 829.58 $ 1,017.20 in billions $ 53.45 Where will you purchase back-to-college items this year? (Check all that apply) Catalog 15.1% 15.5% 14.7% 15.1% 16.7% 19.5% 24.9% 10.9% 8.7% 7.9% 19.8% 17.3% 15.8% 14.4% 12.8% College Bookstore 40.9% 39.9% 41.8% 40.5% 42.3% 53.9% 48.0% 39.1% 31.0% 37.6% 39.6% 39.1% 45.5% 43.1% 37.0% Discount Store 51.9% 45.3% 58.2% 51.7% 52.9% 44.4% 48.7% 52.1% 57.0% 54.6% 52.8% 50.0% 52.0% 53.7% 52.5% Department Store 45.4% 45.8% 45.1% 44.3% 46.2% 58.1% 51.1% 40.1% 40.8% 40.7% 44.7% 46.9% 42.8% 48.1% 43.8% Drug Store 22.3% 17.1% 27.2% 22.6% 23.3% 22.3% 25.5% 18.1% 17.4% 18.8% 32.0% 30.8% 24.7% 17.1% 19.8% Home Furnishings or Home Décor Store 16.4% 15.4% 17.4% 12.8% 19.1% 22.0% 21.3% 12.9% 9.3% 9.7% 24.9% 15.6% 16.4% 15.5% 18.5% Office Supply Store 40.3% 36.9% 43.6% 39.5% 41.3% 44.7% 36.6% 37.1% 38.7% 28.2% 56.9% 42.3% 35.2% 42.3% 40.0% Online 37.3% 37.5% 37.2% 35.9% 39.3% 48.0% 43.4% 34.0% 35.5% 32.3% 33.0% 35.9% 37.0% 35.7% 41.2% Clothing Store 34.8% 31.4% 38.0% 33.6% 36.0% 51.6% 32.7% 28.2% 31.0% 29.9% 39.6% 34.5% 36.2% 36.1% 31.1% Electronics Store 21.1% 21.1% 21.1% 21.6% 21.1% 34.8% 24.3% 19.0% 17.0% 10.4% 23.9% 20.3% 24.1% 19.8% 20.3% Thrift Stores/Resale Shops 15.0% 13.2% 16.6% 19.0% 12.1% 17.4% 12.1% 10.6% 14.4% 11.0% 24.9% 10.8% 18.2% 15.0% 14.3% *The sum of the % totals may be greater than 100% because the respondents can select more than one answer. When will you begin shopping for back-to-college merchandise? At least two months before school starts 29.0% 29.2% 28.9% 25.7% 33.5% 29.3% 34.5% 27.7% 23.7% 27.6% 31.9% 34.0% 34.0% 22.3% 29.2% Three weeks to one month before school starts 31.9% 30.5% 33.3% 31.6% 31.6% 34.2% 31.4% 29.8% 39.5% 33.1% 23.3% 30.5% 29.9% 34.4% 31.8% 1-2 weeks before school starts 23.3% 26.3% 20.5% 23.2% 22.8% 27.0% 21.4% 29.5% 22.3% 21.8% 18.7% 15.1% 23.4% 27.1% 26.8% The week school starts 6.5% 5.3% 7.6% 7.9% 5.6% 5.6% 6.3% 6.3% 3.8% 8.4% 8.8% 12.2% 4.5% 4.7% 5.8% After school starts 9.2% 8.7% 9.8% 11.5% 6.5% 3.9% 6.3% 6.7% 10.7% 9.1% 17.4% 8.2% 8.3% 11.5% 6.3% Total 100.0% 100.0% 100.0% 100.0% 100.0% 100.0% 100.0% 100.0% 100.0% 100.0% 100.0% 100.0% 100.0% 100.0% 100.0% Where will the college student be living this year? Dorm room or college housing 25.9% 29.0% 23.0% 22.5% 29.8% 35.8% 24.4% 24.4% 26.5% 24.9% 21.7% 30.6% 27.7% 29.1% 16.1% Fraternity or sorority house 4.7% 5.9% 3.4% 4.4% 5.0% 5.9% 10.4% 4.9% 1.1% 1.9% 4.1% 4.3% 4.7% 3.9% 6.1% Off campus apartment or housing 24.8% 22.3% 27.2% 26.9% 22.9% 24.5% 21.7% 17.4% 25.7% 23.8% 35.7% 21.2% 25.9% 22.1% 31.2% At home 42.9% 40.4% 45.3% 45.4% 40.1% 33.2% 43.1% 52.6% 44.8% 47.6% 33.9% 41.0% 40.9% 43.6% 46.1% Other (please specify) 1.7% 2.4% 1.1% 0.7% 2.3% 0.6% 0.5% 0.7% 1.9% 1.8% 4.5% 2.9% 0.9% 1.3% 0.5% Total 100.0% 100.0% 100.0% 100.0% 100.0% 100.0% 100.0% 100.0% 100.0% 100.0% 100.0% 100.0% 100.0% 100.0% 100.0% How will the state of the U.S. economy impact your back-to-college purchases? (Check all that apply) Buying more store brand/generic products 32.3% 31.0% 33.6% 34.3% 31.5% 41.8% 34.8% 33.3% 33.0% 25.0% 27.4% 40.7% 30.3% 28.4% 31.7% Doing more comparative shopping online 34.6% 32.3% 36.8% 32.6% 36.4% 36.7% 38.7% 33.3% 29.5% 25.9% 43.7% 38.3% 31.4% 34.1% 37.2% Doing more comparative shopping with ad circulars/newspapers 29.8% 26.7% 32.8% 28.7% 33.9% 24.3% 30.6% 31.3% 31.0% 27.0% 33.0% 34.1% 31.2% 29.6% 27.5% Making do with last year's school items 31.2% 26.7% 35.5% 34.1% 29.8% 32.7% 31.4% 26.2% 28.0% 33.1% 37.1% 37.8% 31.4% 27.1% 36.2% Shopping for sales more often 41.2% 34.5% 47.4% 47.0% 40.0% 43.6% 38.3% 32.7% 41.4% 41.5% 50.3% 42.2% 39.3% 44.7% 40.3% Shopping more online 20.5% 22.5% 18.6% 23.9% 20.3% 25.8% 28.4% 18.3% 14.7% 17.6% 19.8% 24.6% 21.4% 19.3% 19.2% Spending less overall 38.7% 34.8% 42.4% 40.7% 38.9% 41.1% 36.7% 32.4% 40.8% 41.3% 40.6% 39.5% 42.0% 35.1% 42.9% Using coupons more 31.2% 25.5% 36.5% 30.7% 32.1% 35.2% 31.1% 25.6% 28.7% 36.4% 32.0% 33.8% 32.0% 31.2% 31.1% Sharing or borrowing textbooks instead of buying them 15.1% 12.5% 17.5% 13.3% 16.2% 24.0% 19.7% 13.3% 15.7% 10.4% 9.1% 18.9% 18.9% 11.7% 16.3% The economy is impacting students, living situation (living with parents/relatives, on-campus housing, fraternity/sorority housing) 11.4% 10.4% 12.3% 13.6% 10.5% 17.8% 10.9% 7.1% 12.2% 12.9% 9.1% 9.0% 13.5% 7.6% 15.2% The economy is impacting choice of college (two-year school vs. four-year, closer to home, college that offered a scholarship, public vs. private) 12.7% 11.0% 14.4% 13.0% 12.2% 14.7% 12.5% 11.2% 13.7% 15.9% 9.1% 12.5% 21.8% 9.6% 11.9% Other (please specify) 1.6% 2.4% 0.7% 1.2% 1.8% 0.8% 0.7% 0.7% 1.4% 3.3% 2.5% 0.5% 2.1% 1.3% 0.1% Back-to-college plans will not change 16.5% 17.2% 15.9% 16.0% 16.9% 11.6% 10.4% 16.3% 19.9% 27.0% 13.2% 14.0% 19.7% 17.5% 13.8% *The sum of the % totals may be greater than 100% because the respondents can select more than one answer. © 2012, Prosper® 2 Monthly Consumer Survey, JUL-12
- 8. Source: BIGinsight™ Back-to-College 2012 Source: BIGinsight™, Monthly Consumer Survey, JUL 07-12 2007 2008 2009 2010 2011 2012 Do you have child/dependent attending college this fall? Yes 9.8% 11.1% 10.5% 10.4% 10.7% 12.3% No 90.2% 88.9% 89.5% 89.6% 89.3% 87.7% Total 100.0% 100.0% 100.0% 100.0% 100.0% 100.0% Will you be attending college this fall? Yes 12.1% 11.8% 10.6% 13.2% 13.6% 14.3% No 87.9% 88.2% 89.4% 86.8% 86.4% 85.7% Total 100.0% 100.0% 100.0% 100.0% 100.0% 100.0% If you will be attending college which year will you begin? Freshman 18.9% 14.9% 22.0% 17.8% 22.9% 21.5% Sophomore 17.5% 14.6% 12.4% 18.7% 20.3% 14.1% Junior 14.5% 12.1% 17.0% 15.1% 16.8% 18.8% Senior 14.5% 10.3% 9.6% 11.2% 9.2% 11.3% Grad School/Law School/Med School/Other 34.5% 48.1% 38.9% 37.1% 30.9% 34.2% Total 100.0% 100.0% 100.0% 100.0% 100.0% 100.0% How much do you plan to spend on the following back-to-college items this year? Clothing and accessories (excluding Shoes) Average of Buyers $ 216.47 $ 202.61 $ 173.79 $ 166.94 $ 172.89 $ 179.20 Percent Buying 69.2% 66.3% 68.2% 72.4% 73.7% 74.2% Net Average $ 149.85 $ 134.40 $ 118.56 $ 120.88 $ 127.37 $ 132.97 in billions $ 7.41 $ 7.01 $ 5.77 $ 6.63 $ 7.25 $ 7.83 Shoes Average of Buyers $ 96.63 $ 97.35 $ 91.46 $ 94.71 $ 87.09 $ 106.78 Percent Buying 62.0% 60.1% 63.2% 65.7% 69.6% 71.0% Net Average $ 59.90 $ 58.46 $ 57.85 $ 62.20 $ 60.58 $ 75.81 in billions $ 2.96 $ 3.05 $ 2.82 $ 3.41 $ 3.45 $ 4.47 Collegiate Branded Gear or Supplies (apparel, bumper stickers, etc.) Average of Buyers NA $ 82.53 $ 79.09 $ 80.32 $ 72.51 $ 99.50 Percent Buying NA 42.7% 43.7% 45.1% 45.5% 53.1% Net Average NA $ 35.26 $ 34.52 $ 36.26 $ 33.00 $ 52.87 in billions NA $ 1.84 $ 1.68 $ 1.99 $ 1.88 $ 3.11 School supplies, such as notebooks, folders, pencils, and backpacks Average of Buyers $ 76.15 $ 84.13 $ 74.63 $ 77.17 $ 73.65 $ 89.06 Percent Buying 83.4% 81.4% 81.8% 81.5% 83.5% 85.0% Net Average $ 63.52 $ 68.47 $ 61.05 $ 62.91 $ 61.48 $ 75.73 in billions $ 3.14 $ 3.57 $ 2.97 $ 3.45 $ 3.50 $ 4.46 Electronics or computer-related equipment such as a home computer, laptop, handheld organizer, cell phone, calculator, digital camera or MP3 player Average of Buyers $ 513.36 $ 444.69 $ 528.11 $ 465.44 $ 458.21 $ 400.64 Percent Buying 50.3% 47.6% 50.4% 50.9% 45.8% 54.0% Net Average $ 258.43 $ 211.89 $ 266.08 $ 236.94 $ 209.93 $ 216.40 in billions $ 12.77 $ 11.05 $ 12.95 $ 12.99 $ 11.95 $ 12.75 Dorm or apartment furnishings like bedspreads, posters, answering machine, or microwave/fridge Average of Buyers $ 300.90 $ 266.83 $ 261.30 $ 272.74 $ 243.39 $ 214.45 Percent Buying 36.5% 34.1% 30.6% 35.5% 39.8% 46.8% Net Average $ 109.85 $ 90.90 $ 80.06 $ 96.94 $ 96.84 $ 100.27 in billions $ 5.43 $ 4.74 $ 3.90 $ 5.31 $ 5.51 $ 5.91 Food items, such as snacks, beverages, etc. Average of Buyers NA NA $ 170.72 $ 158.82 $ 141.54 $ 144.95 Percent Buying NA NA 62.2% 65.5% 66.8% 69.1% © 2012, Prosper® 3 Monthly Consumer Survey, JUL 07-12
- 9. Source: BIGinsight™ Back-to-College 2012 Source: BIGinsight™, Monthly Consumer Survey, JUL 07-12 2007 2008 2009 2010 2011 2012 Net Average NA NA $ 106.11 $ 104.08 $ 94.60 $ 100.18 in billions NA NA $ 5.16 $ 5.71 $ 5.39 $ 5.90 Personal care items, such as skin care, hair care, oral care, makeup, OTC medicine, etc. Average of Buyers NA NA $ 104.67 $ 98.43 $ 88.43 $ 109.98 Percent Buying NA NA 66.6% 70.9% 72.9% 74.3% Net Average NA NA $ 69.70 $ 69.79 $ 64.44 $ 81.76 in billions NA NA $ 3.39 $ 3.83 $ 3.67 $ 4.82 Gift Cards or Pre-Paid Cards Average of Buyers NA NA $ 197.31 $ 161.93 $ 199.17 $ 187.85 Percent Buying NA NA 26.4% 28.2% 30.4% 37.9% Net Average NA NA $ 52.05 $ 45.73 $ 60.46 $ 71.23 in billions NA NA $ 2.53 $ 2.51 $ 3.44 $ 4.20 Combined Average $ 641.56 $ 599.38 $ 845.98 $ 835.73 $ 808.71 $ 907.22 in billions $ 31.71 $ 31.26 $ 41.17 $ 45.81 $ 46.03 $ 53.45 Where will you purchase back-to-college items this year? (Check all that apply) Catalog 10.5% 9.4% 11.5% 8.3% 11.4% 15.1% College Bookstore 57.2% 41.8% 44.5% 43.2% 41.1% 40.9% Discount Store 51.5% 52.0% 53.4% 53.8% 53.9% 51.9% Department Store 41.8% 41.8% 43.1% 42.5% 47.6% 45.4% Drug Store 13.2% 14.3% 23.4% 17.0% 19.4% 22.3% Home Furnishings or Home Decor Store 12.7% 13.1% 11.0% 9.8% 11.2% 16.4% Office Supply Store 35.6% 37.3% 32.5% 36.5% 33.4% 40.3% Online 30.5% 29.9% 28.6% 28.6% 33.4% 37.3% Clothing Store 34.3% 30.7% 29.8% 28.2% 34.2% 34.8% Electronics Store 20.9% 19.6% 20.9% 18.0% 19.6% 21.1% Thrift Stores/Resale Shops 14.0% 14.2% 18.6% 18.9% 16.7% 15.0% *The sum of the % totals may be greater than 100% because the respondents can select more than one answer. When will you begin shopping for back-to-college merchandise? At least two months before school starts 20.9% 21.5% 22.3% 20.2% 24.4% 29.0% Three weeks to one month before school starts 28.6% 29.8% 33.7% 33.1% 28.9% 31.9% 1-2 weeks before school starts 31.0% 27.9% 25.7% 23.2% 27.9% 23.3% The week school starts 9.4% 12.1% 9.0% 12.6% 9.4% 6.5% After school starts 10.1% 8.7% 9.4% 10.9% 9.4% 9.2% Total 100.0% 100.0% 100.0% 100.0% 100.0% 100.0% Where will the college student be living this year? Dorm room or college housing 18.7% 18.0% 15.8% 18.8% 18.1% 25.9% Fraternity or sorority house 1.3% 2.1% 2.0% 2.0% 3.6% 4.7% Off campus apartment or housing 28.6% 24.3% 22.4% 23.0% 24.7% 24.8% At home 49.7% 54.1% 58.5% 51.8% 52.9% 42.9% Other: 1.8% 1.5% 1.2% 4.4% 0.7% 1.7% Total 100.0% 100.0% 100.0% 100.0% 100.0% 100.0% How will the state of the U.S. economy impact your back-to-college purchases? (Check all that apply) Buying more store brand/generic products NA NA 32.5% 34.1% 38.0% 32.3% Doing more comparative shopping online NA NA 26.0% 23.2% 30.7% 34.6% Doing more comparative shopping with ad circulars/newspapers NA NA 30.8% 29.8% 30.5% 29.8% Making due with last year's school items NA NA 33.6% 29.5% 29.7% 31.2% Shopping for sales more often NA NA 46.1% 42.0% 39.5% 41.2% Shopping more online NA NA 15.4% 18.2% 18.8% 20.5% © 2012, Prosper® 4 Monthly Consumer Survey, JUL 07-12
- 10. Source: BIGinsight™ Back-to-College 2012 Source: BIGinsight™, Monthly Consumer Survey, JUL 07-12 2007 2008 2009 2010 2011 2012 Spending less overall NA NA 48.0% 45.0% 44.6% 38.7% Using coupons more NA NA 32.5% 32.9% 32.7% 31.2% Sharing or borrowing textbooks instead of buying them NA NA 17.4% 19.3% 18.4% 15.1% The economy is impacting students' living situation (living with parents/relatives on-campus housing fraternity/sorority housing) NA NA 12.8% 11.9% 13.3% 11.4% The economy is impacting choice of college (two- year school vs. four-year, closer to home, college that offered a scholarship, public vs. private) NA NA 15.0% 13.9% 14.2% 12.7% Back-to-college plans will not change NA NA 16.9% 20.6% 16.3% 16.5% Other: NA NA 4.4% 2.8% 2.7% 1.6% *The sum of the % totals may be greater than 100% because the respondents can select more than one answer. © 2012, Prosper® 5 Monthly Consumer Survey, JUL 07-12
- 11. Source: BIGinsight™ N = 8509, 7/2 - 7/9/12 Source: BIGinsight™, Monthly Consumer Survey, JUL-12 Graduate N = 8509, 7/2 - 7/9/12 Adults 18+ Freshman Sophomore Junior Senior Student Do you have child/dependent attending college this fall? Yes 12.3% 0.0% 0.0% 0.0% 0.0% 0.0% No 87.7% 100.0% 100.0% 100.0% 100.0% 100.0% Total 100.0% 100.0% 100.0% 100.0% 100.0% 100.0% Will you be attending college this fall? Yes 14.3% 100.0% 100.0% 100.0% 100.0% 100.0% No 85.7% 0.0% 0.0% 0.0% 0.0% 0.0% Total 100.0% 100.0% 100.0% 100.0% 100.0% 100.0% If you will be attending college, which year will you begin? Freshman 21.5% 100.0% 0.0% 0.0% 0.0% 0.0% Sophomore 14.1% 0.0% 100.0% 0.0% 0.0% 0.0% Junior 18.8% 0.0% 0.0% 100.0% 0.0% 0.0% Senior 11.3% 0.0% 0.0% 0.0% 100.0% 0.0% Grad School/Law School/Med School/Other 34.2% 0.0% 0.0% 0.0% 0.0% 100.0% Total 100.0% 100.0% 100.0% 100.0% 100.0% 100.0% Have a Child/Dependent Attending College or Yourself Attending College: How much do you plan to spend on the following back-to-college items this year? Clothing and accessories (excluding Shoes) Average of Buyers $ 179.20 $ 138.51 $ 138.82 $ 137.40 $ 118.08 $ 155.66 Percent Buying 74.2% 87.1% 84.0% 80.2% 83.5% 80.1% Net Average $ 132.97 $ 120.68 $ 116.58 $ 110.14 $ 98.65 $ 124.63 in billions $ 7.83 Shoes Average of Buyers $ 106.78 $ 78.65 $ 87.91 $ 78.85 $ 86.39 $ 100.43 Percent Buying 71.0% 84.4% 79.6% 76.5% 75.5% 73.4% Net Average $ 75.81 $ 66.38 $ 70.02 $ 60.29 $ 65.22 $ 73.72 in billions $ 4.47 Collegiate Branded Gear or Supplies (apparel, bumper stickers, etc.) Average of Buyers $ 99.50 $ 69.14 $ 68.81 $ 77.37 $ 68.87 $ 82.24 Percent Buying 53.1% 63.3% 57.7% 57.7% 55.9% 56.5% Net Average $ 52.87 $ 43.74 $ 39.67 $ 44.64 $ 38.51 $ 46.49 in billions $ 3.11 School supplies, such as notebooks, folders, pencils, and backpacks Average of Buyers $ 89.06 $ 88.25 $ 67.51 $ 75.93 $ 62.31 $ 75.19 Percent Buying 85.0% 98.4% 97.5% 94.0% 96.0% 92.8% Net Average $ 75.73 $ 86.82 $ 65.80 $ 71.37 $ 59.79 $ 69.76 in billions $ 4.46 Electronics or computer-related equipment such as a home computer, laptop, tablet, cell phone, digital camera or MP3 player Average of Buyers $ 400.64 $ 347.37 $ 317.77 $ 321.24 $ 266.53 $ 374.44 Percent Buying 54.0% 75.6% 65.3% 56.3% 57.0% 61.6% Net Average $ 216.40 $ 262.58 $ 207.60 $ 180.87 $ 151.98 $ 230.69 in billions $ 12.75 Dorm or apartment furnishings like bedspreads, posters, answering machine, or microwave/fridge Average of Buyers $ 214.45 $ 192.22 $ 190.84 $ 176.28 $ 163.16 $ 189.21 Percent Buying 46.8% 57.8% 48.9% 47.4% 44.9% 43.6% Net Average $ 100.27 $ 111.10 $ 93.31 $ 83.64 $ 73.34 $ 82.43 in billions $ 5.91 Food items, such as snacks, beverages, etc. Average of Buyers $ 144.95 $ 125.45 $ 128.89 $ 130.73 $ 115.81 $ 154.49 Percent Buying 69.1% 84.8% 82.7% 80.7% 82.1% 74.9% Net Average $ 100.18 $ 106.35 $ 106.53 $ 105.44 $ 95.07 $ 115.64 © 2012, Prosper® 6 Monthly Consumer Survey, JUL-12
- 12. Source: BIGinsight™ N = 8509, 7/2 - 7/9/12 Source: BIGinsight™, Monthly Consumer Survey, JUL-12 Graduate N = 8509, 7/2 - 7/9/12 Adults 18+ Freshman Sophomore Junior Senior Student in billions $ 5.90 Personal care items, such as skin care, hair care, oral care, makeup, OTC medicine, etc. Average of Buyers $ 109.98 $ 86.89 $ 83.42 $ 83.55 $ 67.65 $ 104.44 Percent Buying 74.3% 86.3% 86.0% 86.9% 82.5% 78.8% Net Average $ 81.76 $ 74.98 $ 71.73 $ 72.64 $ 55.82 $ 82.25 in billions $ 4.82 Gift Cards or Pre-Paid Cards Average of Buyers $ 187.85 $ 124.24 $ 113.92 $ 118.59 $ 133.19 $ 152.64 Percent Buying 37.9% 45.6% 36.6% 32.4% 31.8% 35.6% Net Average $ 71.23 $ 56.71 $ 41.73 $ 38.38 $ 42.32 $ 54.27 in billions $ 4.20 Combined Average $ 907.22 $ 929.35 $ 812.97 $ 767.41 $ 680.70 $ 879.89 in billions $ 53.45 Where will you purchase back-to-college items this year? (Check all that apply) Catalog 15.1% 18.1% 17.9% 14.5% 8.8% 16.8% College Bookstore 40.9% 40.1% 50.9% 47.4% 51.7% 49.9% Discount Store 51.9% 49.1% 45.4% 46.2% 39.3% 49.7% Department Store 45.4% 47.6% 51.5% 55.0% 46.8% 51.4% Drug Store 22.3% 21.1% 20.4% 26.0% 11.6% 21.2% Home Furnishings or Home Décor Store 16.4% 16.1% 16.4% 17.7% 9.1% 19.1% Office Supply Store 40.3% 39.9% 39.9% 40.3% 30.1% 44.5% Online 37.3% 42.7% 48.6% 47.7% 46.2% 51.6% Clothing Store 34.8% 44.0% 44.1% 37.2% 36.3% 37.3% Electronics Store 21.1% 30.0% 28.2% 22.8% 20.1% 26.6% Thrift Stores/Resale Shops 15.0% 19.0% 14.2% 16.8% 10.0% 14.7% *The sum of the % totals may be greater than 100% because the respondents can select more than one answer. When will you begin shopping for back-to-college merchandise? At least two months before school starts 29.0% 34.8% 24.5% 25.7% 18.7% 23.6% Three weeks to one month before school starts 31.9% 30.4% 40.2% 29.3% 23.1% 33.0% 1-2 weeks before school starts 23.3% 24.1% 24.6% 32.3% 39.7% 23.7% The week school starts 6.5% 4.7% 6.9% 6.8% 10.9% 10.7% After school starts 9.2% 6.0% 3.8% 5.9% 7.6% 9.0% Total 100.0% 100.0% 100.0% 100.0% 100.0% 100.0% Where will the college student be living this year? Dorm room or college housing 25.9% 28.3% 25.1% 16.5% 20.3% 12.1% Fraternity or sorority house 4.7% 3.8% 3.8% 5.4% 3.7% 3.1% Off campus apartment or housing 24.8% 16.1% 21.1% 25.0% 35.7% 29.2% At home 42.9% 51.4% 49.7% 52.3% 39.2% 55.0% Other (please specify) 1.7% 0.4% 0.3% 0.8% 1.1% 0.6% Total 100.0% 100.0% 100.0% 100.0% 100.0% 100.0% How will the state of the U.S. economy impact your back-to-college purchases? (Check all that apply) Buying more store brand/generic products 32.3% 41.3% 37.3% 33.7% 35.9% 33.2% Doing more comparative shopping online 34.6% 30.3% 39.5% 38.3% 34.5% 40.6% Doing more comparative shopping with ad circulars/newspapers 29.8% 24.4% 26.1% 26.0% 16.7% 27.9% Making do with last year's school items 31.2% 20.5% 35.5% 33.6% 38.9% 34.5% Shopping for sales more often 41.2% 38.6% 43.9% 42.5% 33.5% 46.0% Shopping more online 20.5% 19.5% 23.2% 25.6% 24.5% 32.0% Spending less overall 38.7% 33.1% 44.7% 49.3% 42.6% 42.5% Using coupons more 31.2% 32.6% 32.5% 28.8% 31.2% 39.6% Sharing or borrowing textbooks instead of buying them 15.1% 17.2% 22.6% 19.9% 23.7% 17.2% © 2012, Prosper® 7 Monthly Consumer Survey, JUL-12
- 13. Source: BIGinsight™ N = 8509, 7/2 - 7/9/12 Source: BIGinsight™, Monthly Consumer Survey, JUL-12 Graduate N = 8509, 7/2 - 7/9/12 Adults 18+ Freshman Sophomore Junior Senior Student The economy is impacting students, living situation (living with parents/relatives, on-campus housing, fraternity/sorority housing) 11.4% 10.6% 16.8% 10.0% 12.6% 9.8% The economy is impacting choice of college (two-year school vs. four-year, closer to home, college that offered a scholarship, public vs. private) 12.7% 14.9% 13.4% 11.7% 14.2% 10.2% Other (please specify) 1.6% 0.0% 0.3% 1.4% 0.0% 0.4% Back-to-college plans will not change 16.5% 15.0% 13.4% 13.5% 13.4% 14.6% *The sum of the % totals may be greater than 100% because the respondents can select more than one answer. © 2012, Prosper® 8 Monthly Consumer Survey, JUL-12