Mapping to the Metabolomic Manifold
•Transferir como PPTX, PDF•
1 gostou•4,244 visualizações

Description of network mapping and data visualization approaches for metabolomic and genomic data integration.

Recomendados
Recomendados
Mais conteúdo relacionado
Mais procurados
Mais procurados (20)
Semelhante a Mapping to the Metabolomic Manifold
Semelhante a Mapping to the Metabolomic Manifold (20)
Mais de Dmitry Grapov
Mais de Dmitry Grapov (10)
Último
Último (20)
Mapping to the Metabolomic Manifold
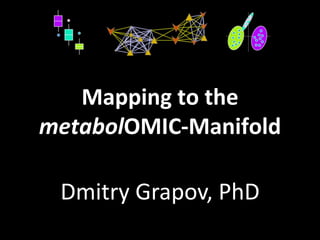
- 1. Mapping to the metabolOMIC-Manifold Dmitry Grapov, PhD
- 2. Metabolomics: study of small molecules
- 3. Metabolome: a proxy for phenotype
- 4. Type 2 Diabetes PMID:24204828 2009 ~10% variance explained Many diseases, including aging, have dominant metabolic components (e.g. metabolic syndrome) Genotype + metabolome >40% variance explained
- 5. Integromics Nature Genetics 46, 543–550 (2014) doi:10.1038/ng.2982 Variance in SNPs mapped to variance in metabolite concentrations Empirical metabolic network displaying gene-metabolite associations Utilize network manifold to uncover latent relationships
- 6. Applications of Metabolomics: Diabetes Type 2 Diabetes x genotype •mitochondrial function is a determinant of T2D severity •signaling lipids are stored in adipose triglycerides Grapov et. al., PLoS ONE (2012) doi:10.1371/journal.pone.0048852 Type 1 Diabetes non-progressors •genetically and environmentally identical animals avoid T1D onset and display significant metabolic differences Grapov et. al., Metabolomics (2014) doi:10.1007/s11306-014-0706-2 TEDDY: The Environmental Determinants of Type 1 Diabetes in the Young Time •multi-Omic longitudinal study involving > 15,000 samples acquired over 3 yrs http://Time teddy.epi.usf.edu/TEDDY/
- 7. Applications of Metabolomics: Early Life Milk Glycans and Immune Markers Markers of Autism in Twins Birth Weight J Matern Fetal Neonatal Med. (2014) PMID 2528417 J Matern Fetal Neonatal Med. (2014) PMID 25284173 •Metabolomics can offer non-genetic insight into into pathpphysiological states with complex heritability patterns J Nutr (2013) PMID: 24047700 •Maternal phenotype has a large impact on milk protein expression, modification (e.g. glycosylation) and function Milk Proteins Grapov et. al.,Journal of Proteome Research (2014, in Press) •Changes in milk protein composition can lead to lasting perturbations in infant gut microbiota and energy metabolism
- 8. Applications of Metabolomics: Cancer Biochemical Lung Cancer •Multifactorial diseases such as cancer require unique of combinations of algorithms and analyses to identify important drivers of biochemical changes associated with these complex states Empirical Grapov et. al., Cancer Prevention Research (2014, under review )
- 9. Applications of Metabolomics: Interventions Drug effects Drug Response Grapov et. al., Circ. Cardiovasc. Genet. (2014, in press). doi:10.1161/CIRCGENETICS.114.000606 Lifestyle (diet and exercise) Grapov et. al.,PLoS ONE (2014) doi:10.1371/journal.pone.0084260 Journal of Proteome Research (2014, revision) •Metabolomics can offer real-time insight into treatment efficacy and drive personalized medicine decisions
- 10. Analysis at the Metabol-OMIC Scale Dynamic a priori or a posteriori network construction, visualization and analysis
- 11. Network Mapping + = Network Mappings Mapped Network Grapov D.,American Society of Mass Spectrometry Conference (2013, 2014)
- 12. Statistical and Multivariate Analysis Group 1 Statistics + + = Multivariate Context Network Mapping Ranked statistically significant differences within a a biochemical context Group 2 What analytes are different between the two groups of samples? Statistical t-Test significant differences lacking rank and context Multivariate O-PLS-DA ranked differences lacking significance and context
- 13. Statistical and Multivariate Analysis Group 1 Statistics + + = Multivariate Context Network Mapping Ranked statistically significant differences within a a biochemical To see the big picture it is necessary to view context Group 2 What analytes are different between the two groups of samples? Statistical t-Test significant differences lacking rank and context Multivariate O-PLS-DA ranked differences lacking significance and context the data from many different angles
- 14. Data Visualization http://uncyclopedia.wikia.com/wiki/Pac-Man_(walkthrough) Seems like a legitimate solution, but how can we confirm? Hint: Visualize!
- 15. Data Visualization TROLL LVL 99 Can not be the solution because it does not conform to square boundaries. (Level 8) http://uncyclopedia.wikia.com/wiki/Pac-Man_(walkthrough)
- 16. Data Analysis and Visualization Data Quality Assessment • accuracy, precision, etc. Statistical • hypotheses testing, FDR • power analysis, design of experiments Multivariate • exploratory, non- or semi-supervised • clustering, dimensional reduction, feature selection • predictive modeling, classification, machine learning Functional • biochemical enrichment or overrepresentation Network • relationships, graph analyses Network Mapping • data integration, visual data mining • pattern recognition
- 17. Devium Dynamic MultivariatE Data Analysis and VIsUalization PlatforM https://github.com/dgrapov/DeviumWeb • Interactive visualizations • Statistics • Clustering • Multivariate • Predictive modeling • Machine Learning • Pathway analysis • Etc.
- 18. Devium Dynamic MultivariatE Data Analysis and VIsUalization PlatforM https://github.com/dgrapov/DeviumWeb
- 19. Metabolomic Networks Biochemical (substrate/product) •Local Database •Web services Chemical (structural or spectral similarity ) •fingerprint generation •similarity calculation Empirical (dependency) •correlation •partial-correlation BMC Bioinformatics 2012, 13:99 doi:10.1186/1471-2105-13-99
- 20. MetaMapR Metabolomic Network Analysis Tool https://github.com/dgrapov/MetaMapR
- 21. MetaMapR Metabolomic Network Analysis Tool https://github.com/dgrapov/MetaMapR
- 22. Pathway Based Omic-Integration Biochemical Pathway Biochemical Ontology
- 23. Pathway Independent Omic-Integration Modified from Barend Mons, 2012 Concept: Use metabolic networks as a foundation to form the core of large-scale small molecule, protein and gene ‘interaction’ networks Challenges: •Database optimization •Visualization
- 24. Domain independent network generation Topological Data Analysis (TDA): mapping multivariate properties of data (nodes) to a network like manifold Test hypotheses on the manifold representation of the data